By Robert Mace, Chief Water Policy Officer at The Meadows Center for Water and the Environment
SUMMARY:
-
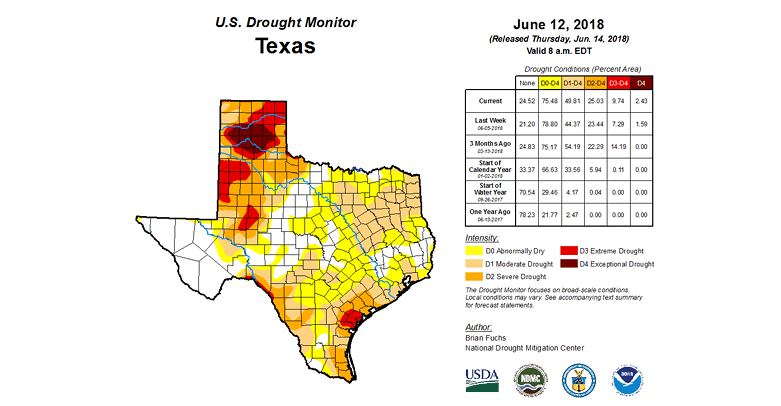
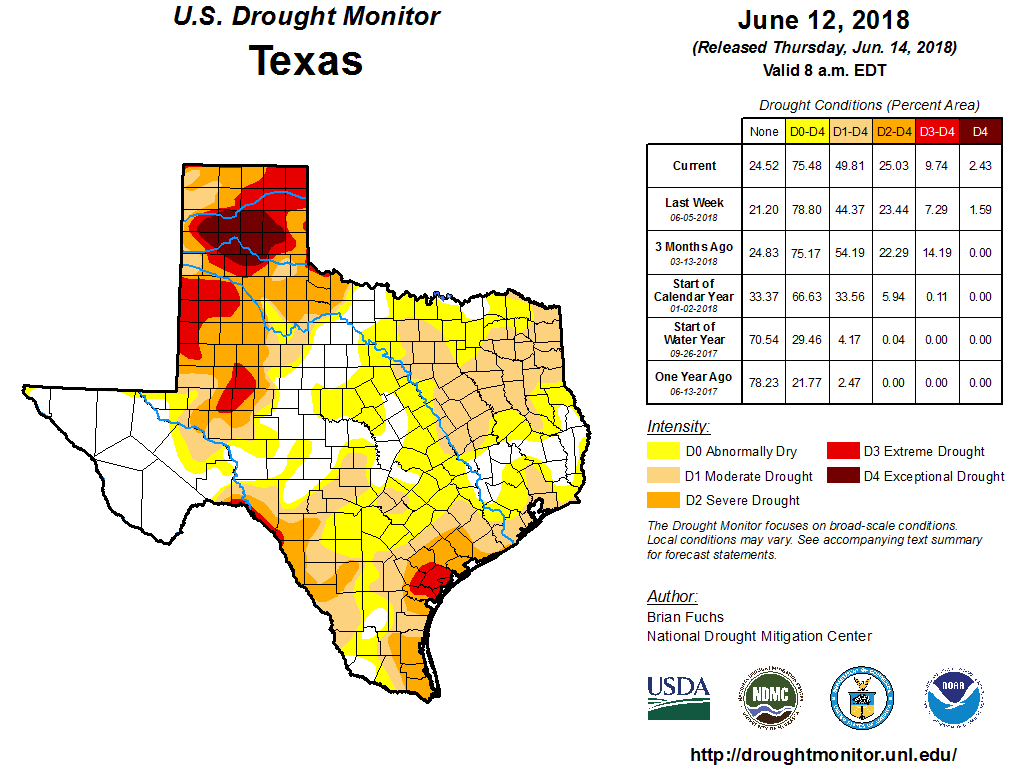
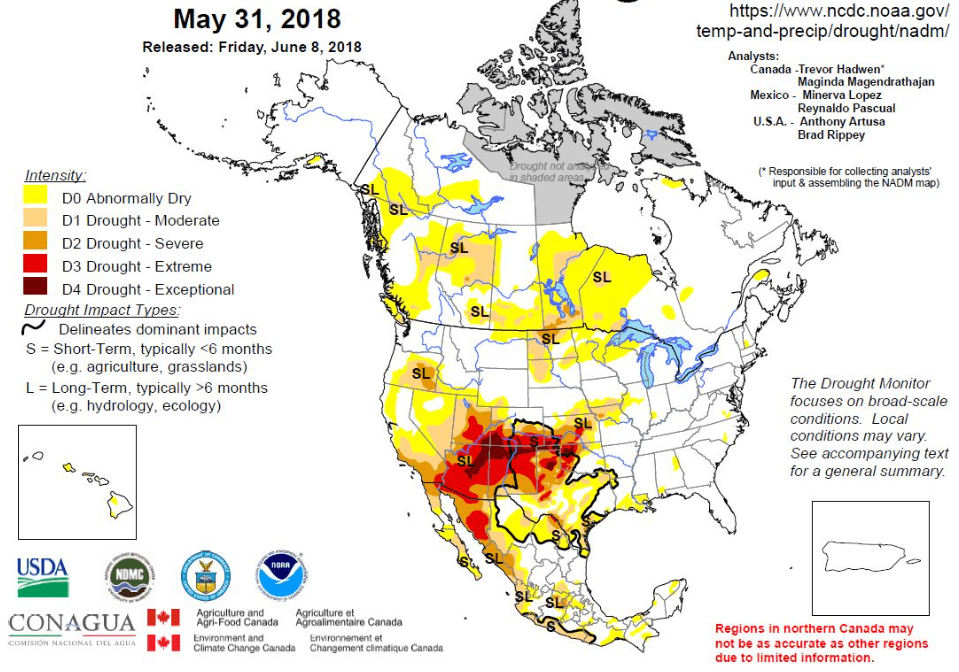
Drought conditions expanded to the eastern and southern parts of Texas
-
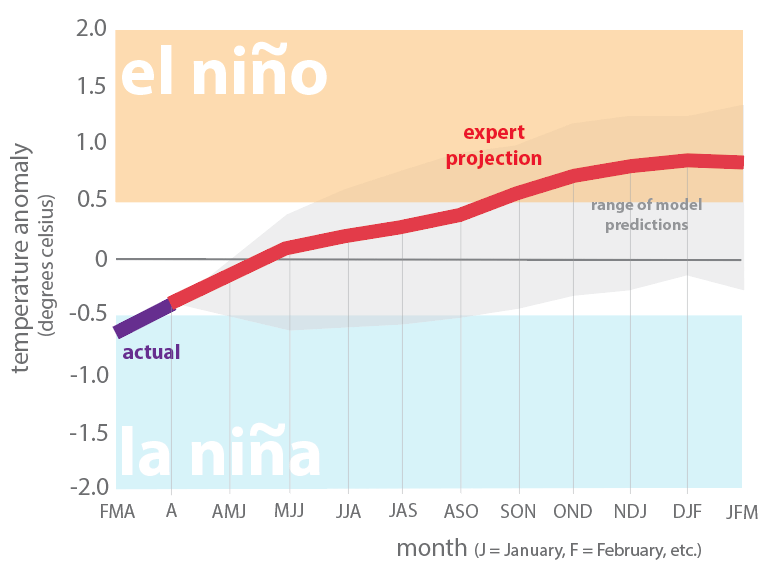
La Niña is gone and El Niño is expected to arrive this fall
-
There’s a 70-percent chance of 10 to 16 named storms of which 5 to 9 could become hurricanes
“It’s so dry that they’ve shut down lane 3 at the swimming pool.”
(written June 18, 2018)
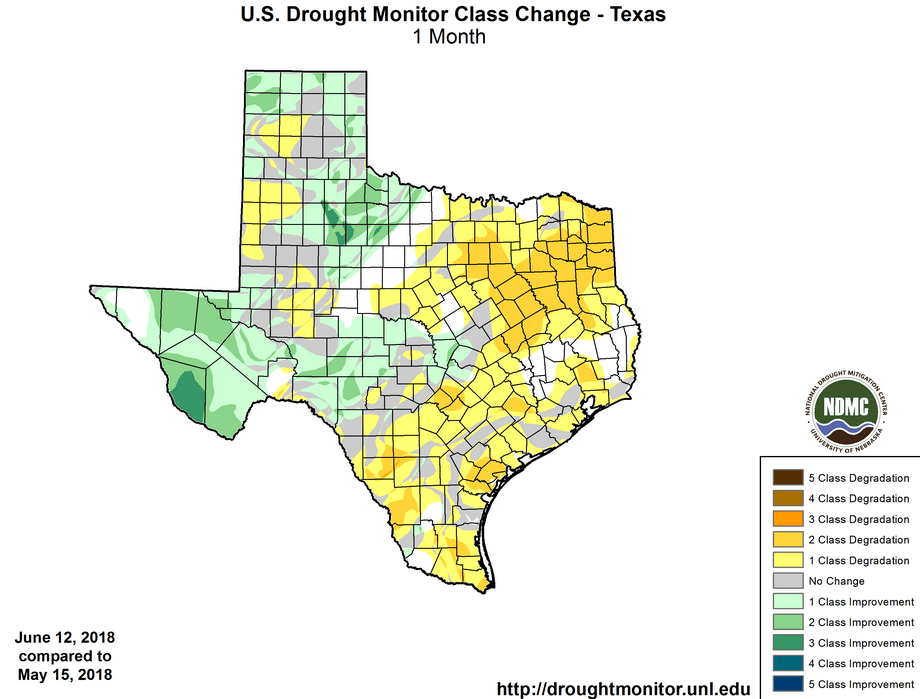
The statewide drought has taken a turn for the worse with dry conditions spreading across the state deep into east and south Texas (Figure 1). The western half of the state has improved from last month, especially in the Big Bend area (Figure 2), but severe, extreme, and exceptional drought continues to impact the High Plains from Amarillo through Midland. As of June 18, about 50 percent of the state was in drought with about 75 percent in abnormally dry or worse conditions.
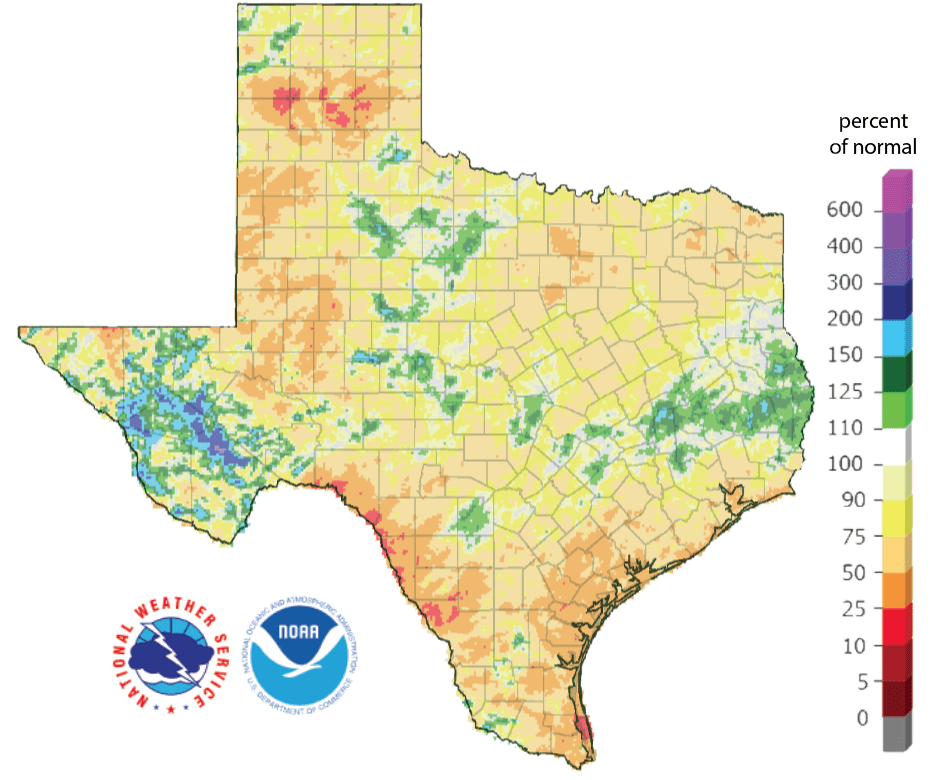
Most of the Texas has received less than 75 percent of normal for the past three months with a healthy smattering across the state of areas receiving less than 50 percent. The driest parts of the state—areas receiving less than 25 percent of normal rainfall over the past 90 days—are along the Prairie Town Fork of the Red River over by Amarillo and along the Rio Grande from the eastern side of the Big Bend to Laredo.
The North American Drought Monitor looks much worse than the one from February with drought worsening in the American Southwest including in the headwaters of the upper Rio Grande (Figure 4).
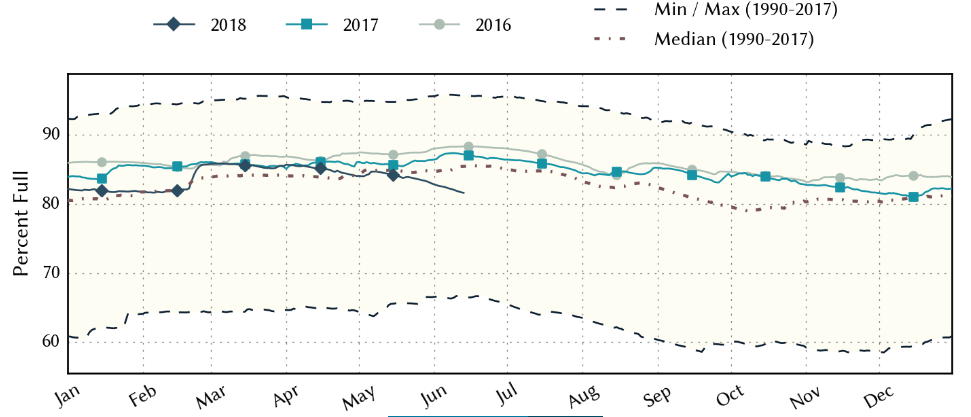
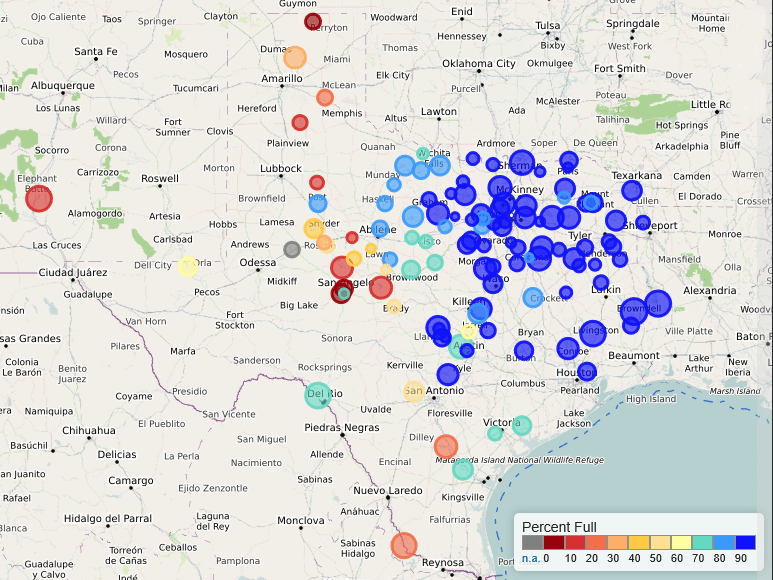
For the state, reservoir storage has taken a dive over the past month and is about 4 percentage points below normal for this time of year (below the median as measured since 1990) at about 82 percent full (Figure 5). The last time our reservoirs were this much below normal was toward the end of the 2010 to 2015 drought on May 24, 2015. As has been the case since the late-1990s, many West Texas reservoirs have been less than 50 percent full (Figure 6).
The Climate Prediction Center has us out of La Niña conditions and under an El Niño Watch for the fall and winter. The Center projects a 50-percent chance of El Niño conditions appearing this fall (with a 45-percent chance of La Nada and 5-percent chance of La Niña) and a 65-percent chance of El Niño conditions during the winter (with a 30-percent chance of La Nada and a 5-percent chance of La Niña). El Niño conditions generally result in wetter-than-normal and cooler-than-normal conditions for Texas and act as a hurricane suppressor.
The National Oceanic and Atmospheric Administration projects a 75-percent chance that the Atlantic hurricane season will be near or above normal (35-percent chance above normal, 40-percent chance near normal, and a 25-percent chance below normal). There’s a 70-percent chance of 10 to 16 named storms of which 5 to 9 could become hurricanes. An average season produces 12 named storms with 6 hurricanes. The Administration will provide an updated outlook in August.