SUMMARY:
-
Above-normal rainfall continues to fall for much of the state.
-
H. Ivie and E.V. Spence are at their highest reservoir levels since the late 1990s. However, drought is peeking back into South Texas.
-
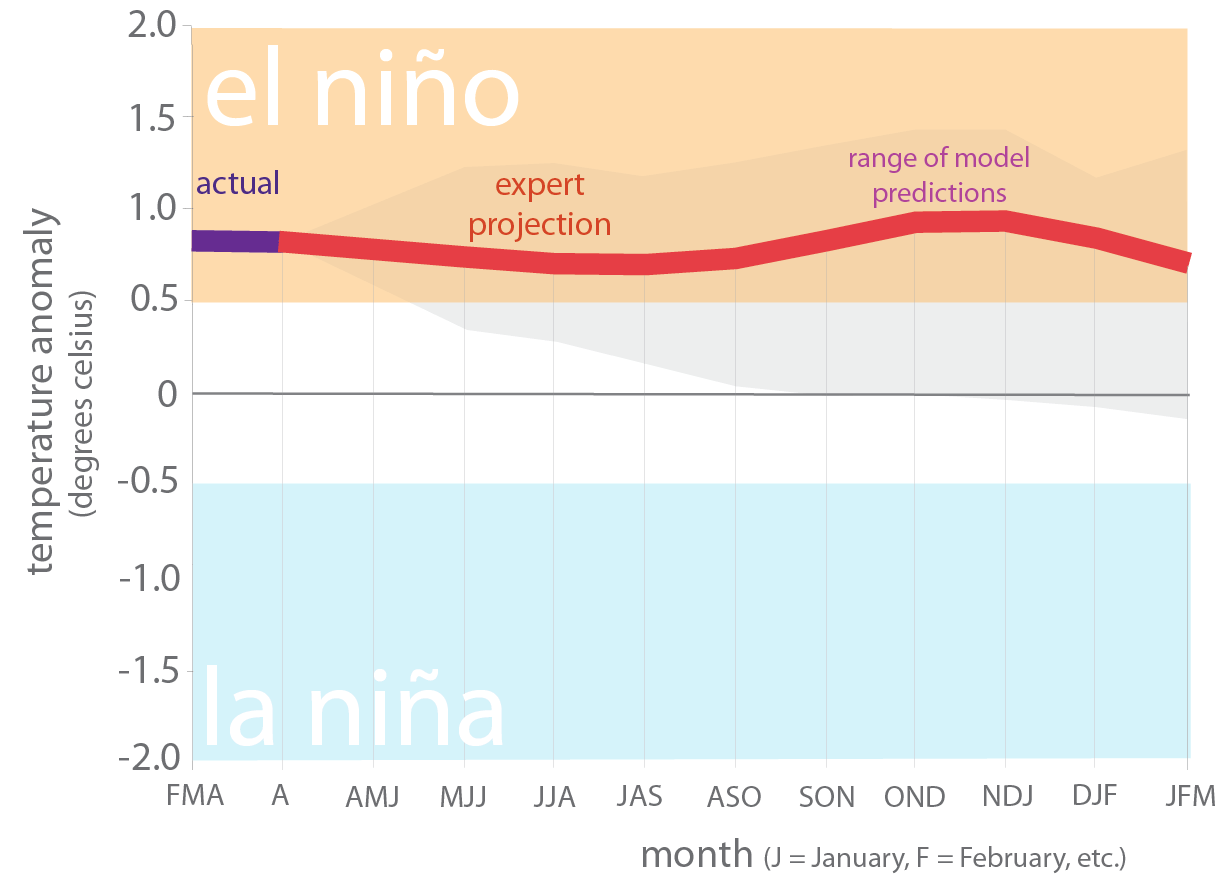
The odds of El Niño staying with us through the summer have decreased slightly to 66 percent with a 50 to 55 percent chance of conditions remaining through the fall and winter.
-
The Atlantic hurricane season has been upgraded to normal from less-than-normal due to uncertain El Niño conditions.
The continental United States just experienced its wettest 12 months in 124 years of recorded history, and Texas has certainly seen its share of rainfall. Much of the northern half of the state, including the western parts that tend to stay drier, received at least 5 inches of rain over the past month. This has kept statewide reservoir levels above normal and brought O.H. Ivie and E.V. Spence—long-suffering reservoirs in West Texas—up to their highest levels since the late 1990s. Nonetheless, drought is re-appearing in South Texas as we head into one of our traditional hot-and-dry seasons.
The Department of Atmospheric Science at Colorado State University released its second projections of the Atlantic hurricane season, which started June 1 and runs through November 30. The department has revised its earlier projection of a below-normal season to a normal season with 14 named storms, 6 hurricanes, and 2 major hurricanes. The Rams now predict a 31 percent chance of hurricane landfall along the Gulf Coast from the Florida Panhandle to Brownsville (the long-term average is 30 percent). The Department will issue revised updates on July 9 and August 5.
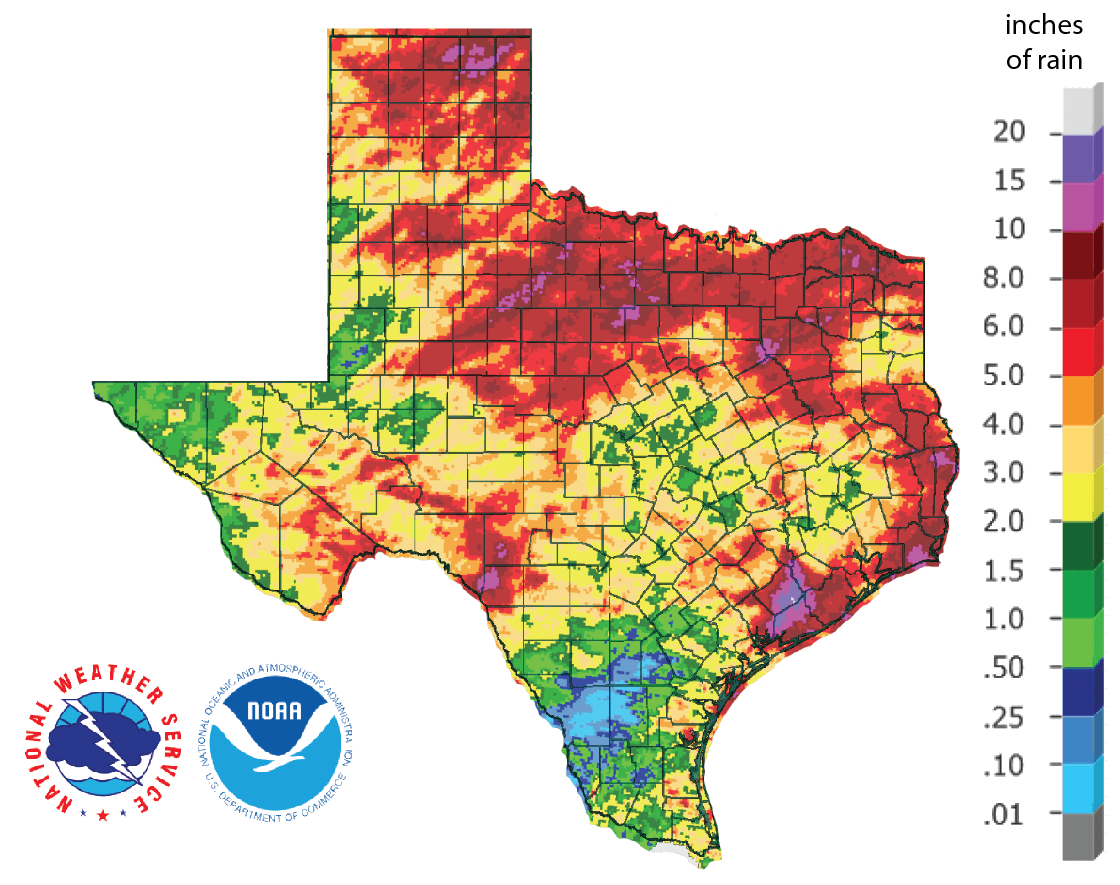
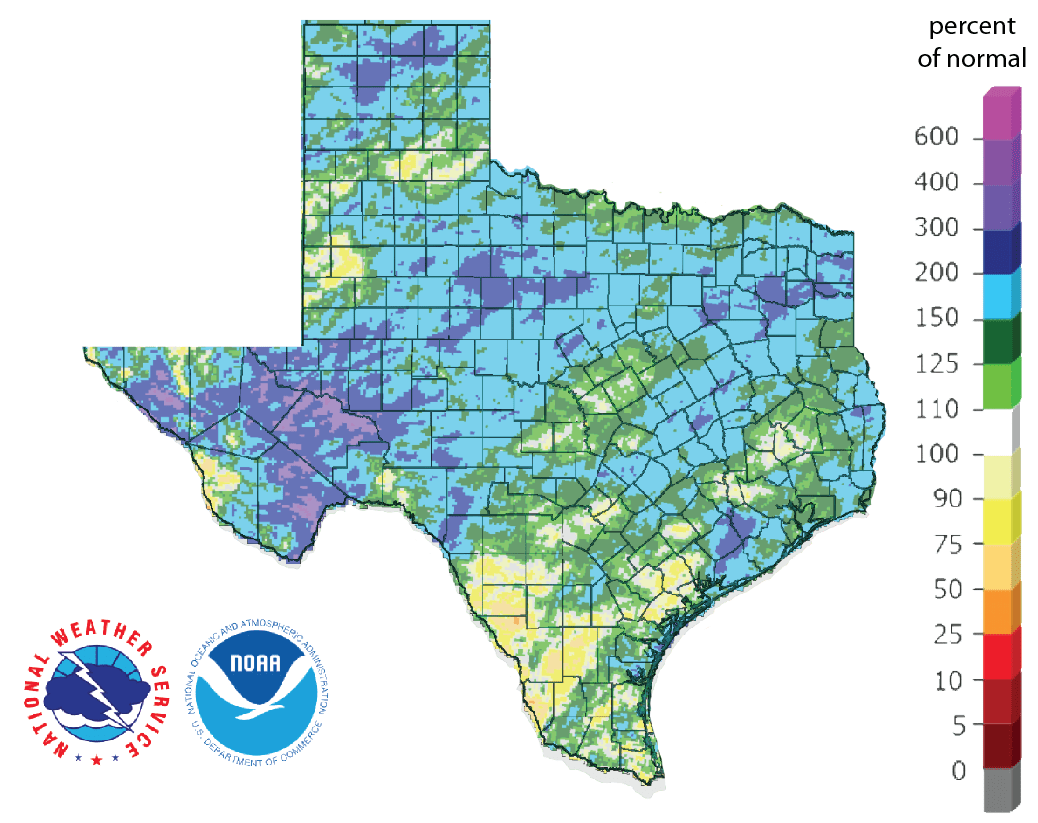
A sizable part of the state received at least 5 inches of rain over the past month with North, West, and East Texas as well as the Panhandle and parts of the Edwards Plateau receiving the most rainfall (Figure 1). South Texas was a dry spot with parts receiving less than 0.10 inches (Figure 1).
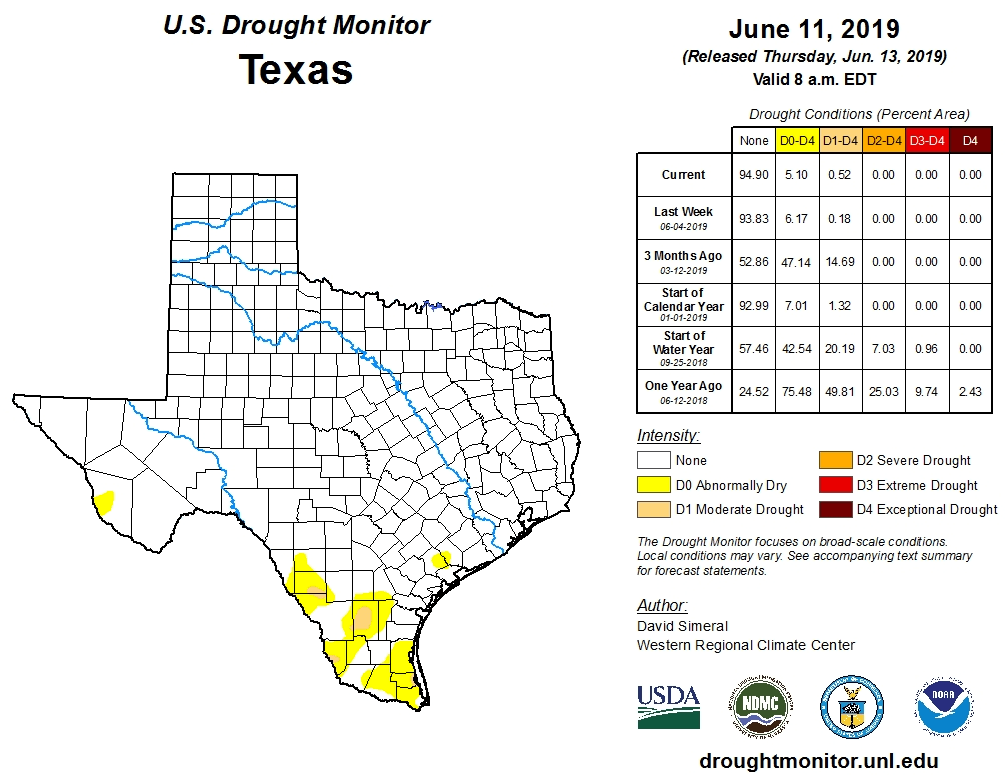
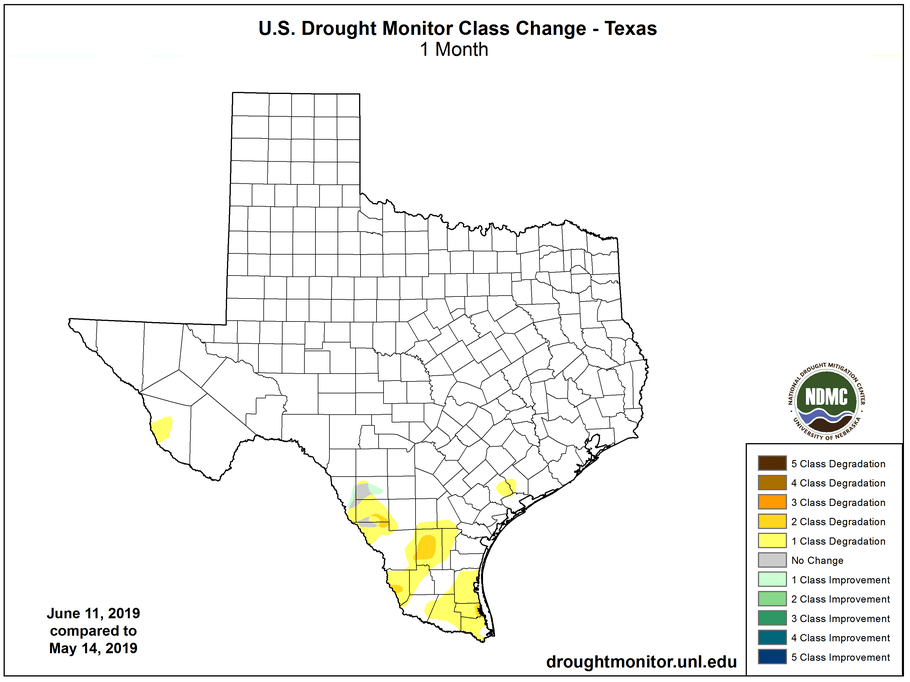
The vast majority of the state remains drought-free; however, Moderate Drought conditions have appeared in parts of South Texas, and a blotch of Abnormally Dry conditions have appeared in Presidio County (Figures 2a and 2b).
Almost all of the state has received greater than normal rainfall for the past 90 days; however, the Moderate Drought and Abnormally Dry conditions on the drought map show less than normal rainfall (Figure 3). About half of the state has received at least 1.5 times as much as normal with a large area receiving three times the normal amount.
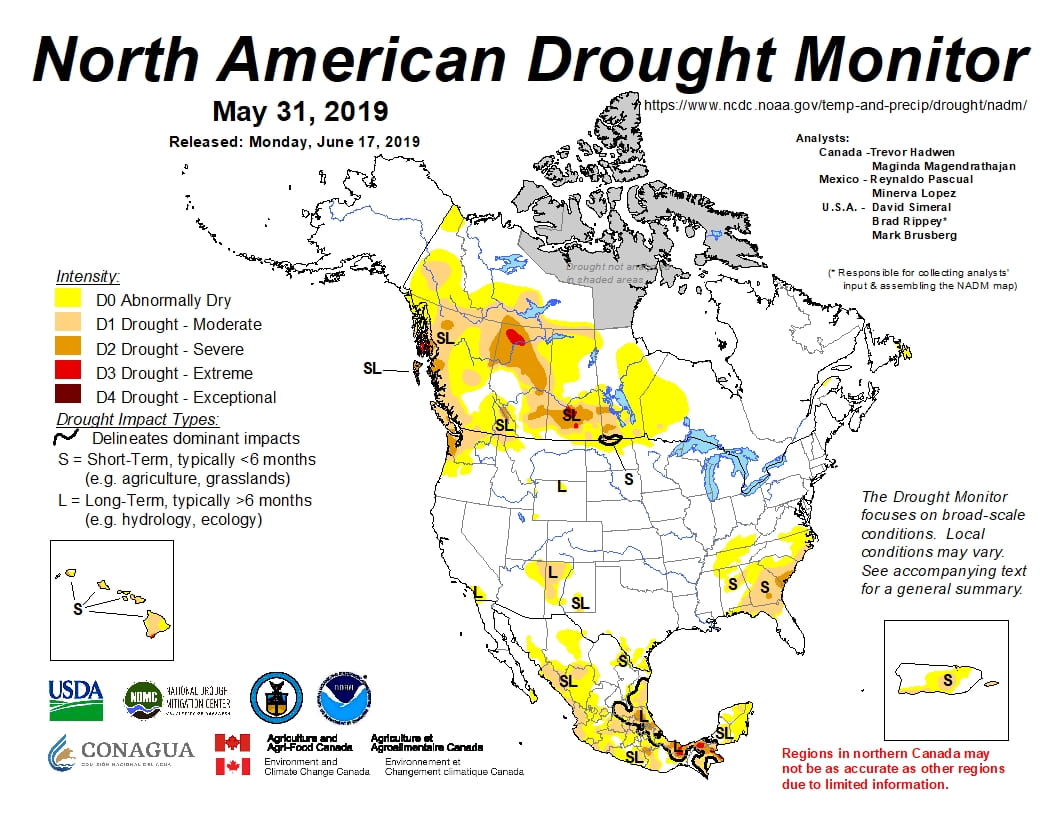
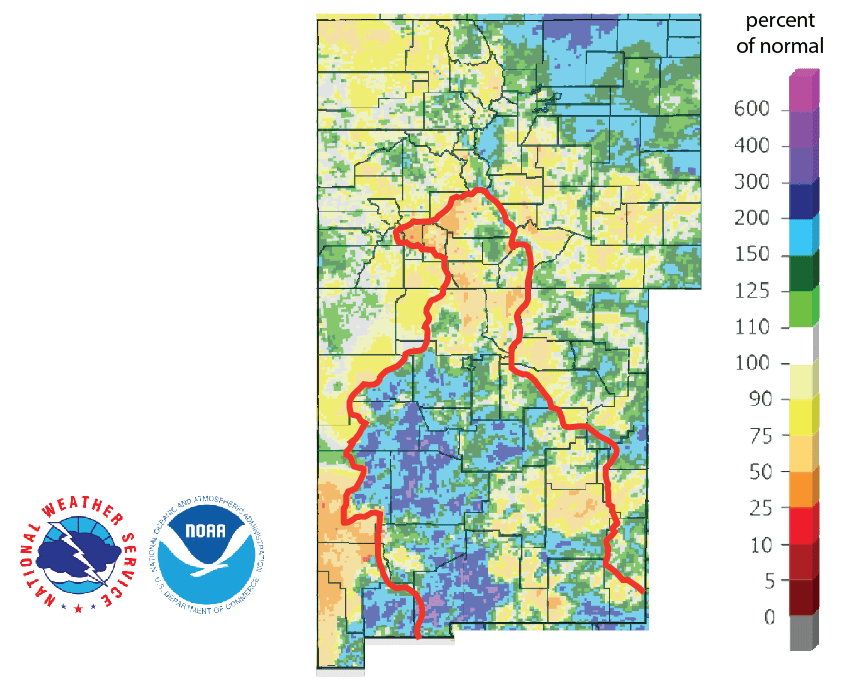
The North American Drought Monitor for the end of April shows short-term drought in Texas with long-term drought in northwestern New Mexico near the headwaters of the Rio Grande (Figure 4a). Percent of normal precipitation in the Rio Grande watershed in Colorado, the primary source of water for Elephant Butte Reservoir, over the last 90 days shows less than normal rainfall; however, much of the basin in New Mexico has benefitted from much greater-than-normal rainfall (Figure 4b).
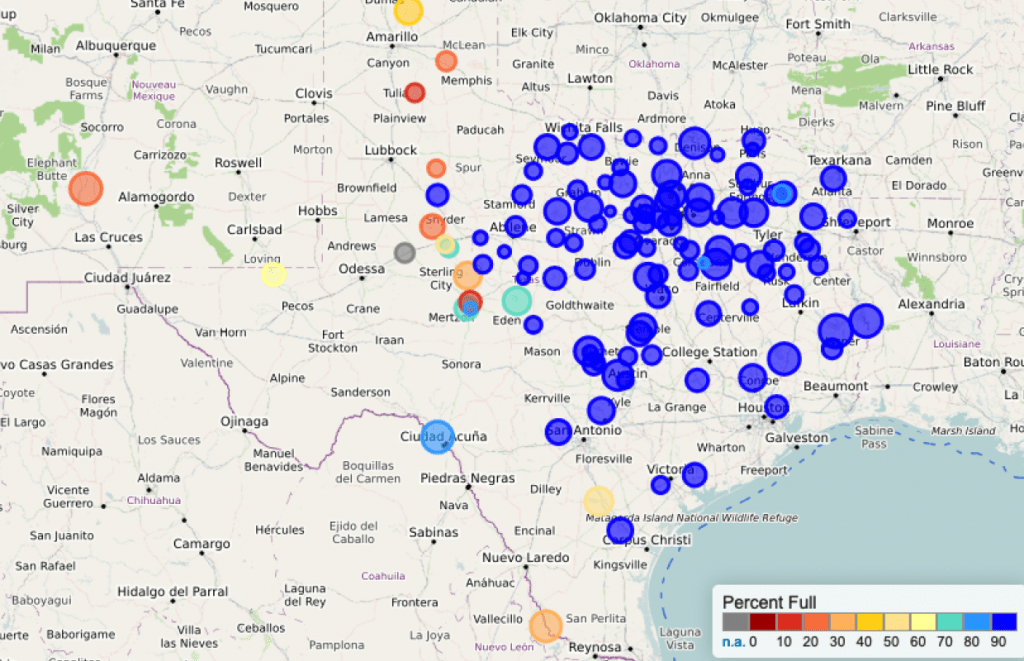
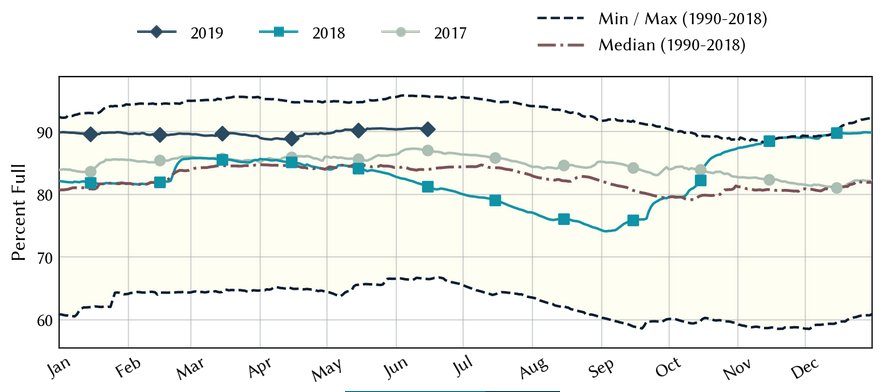
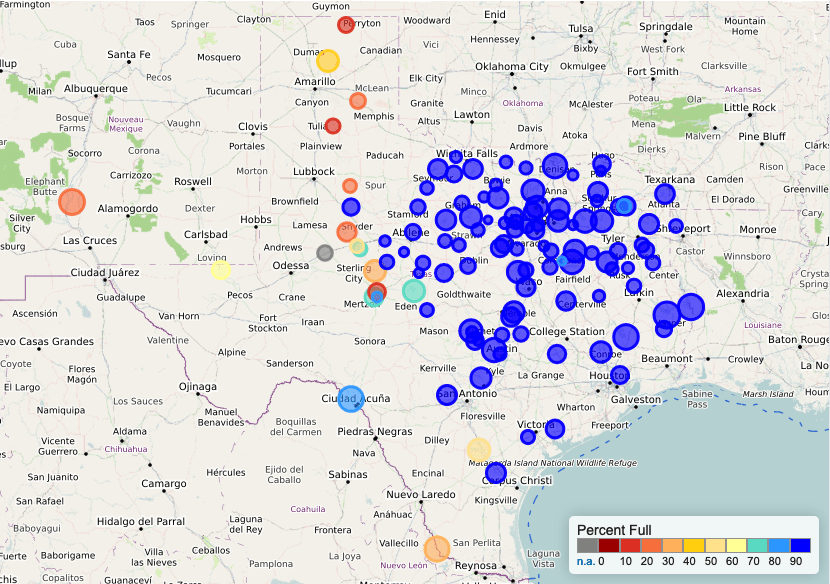
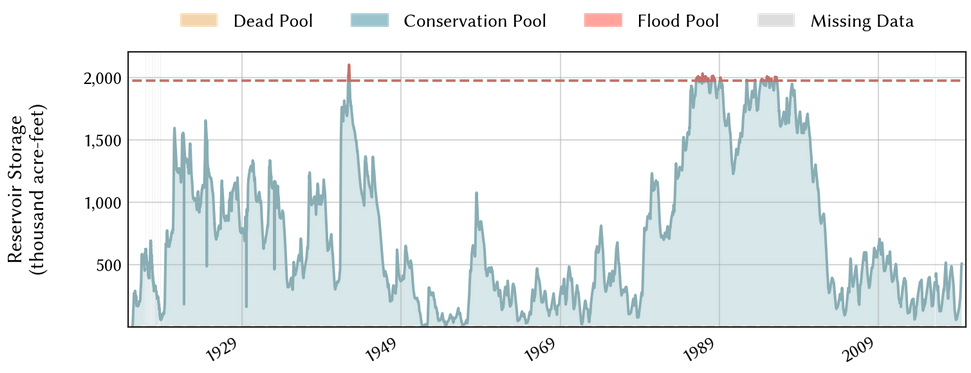
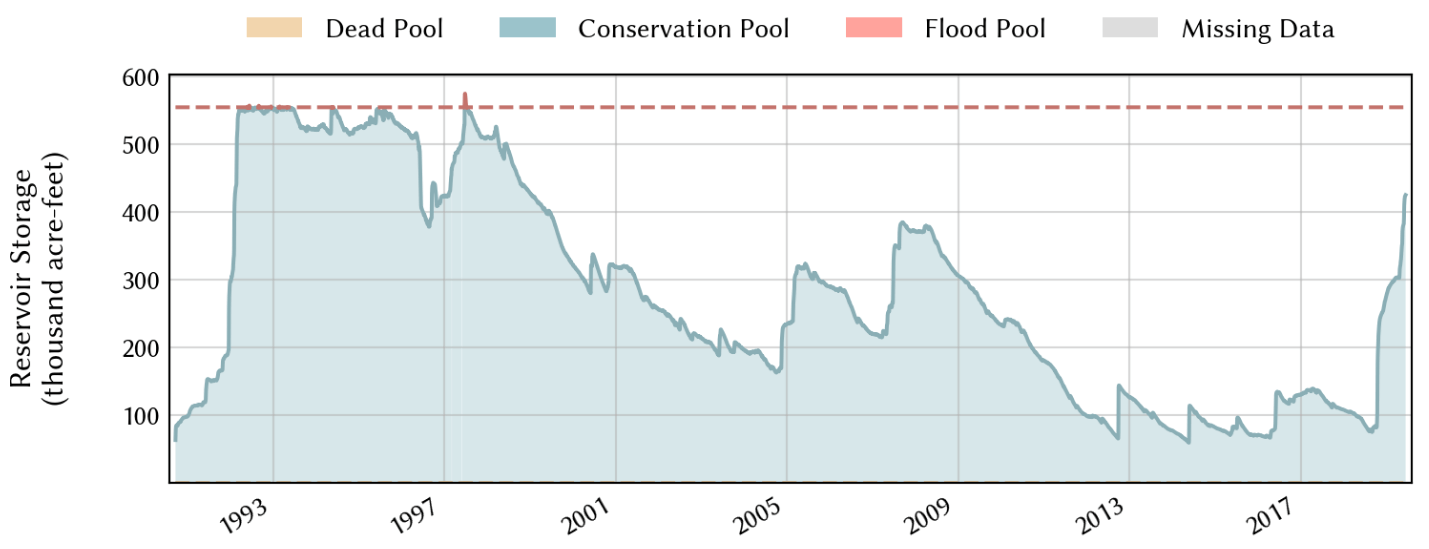
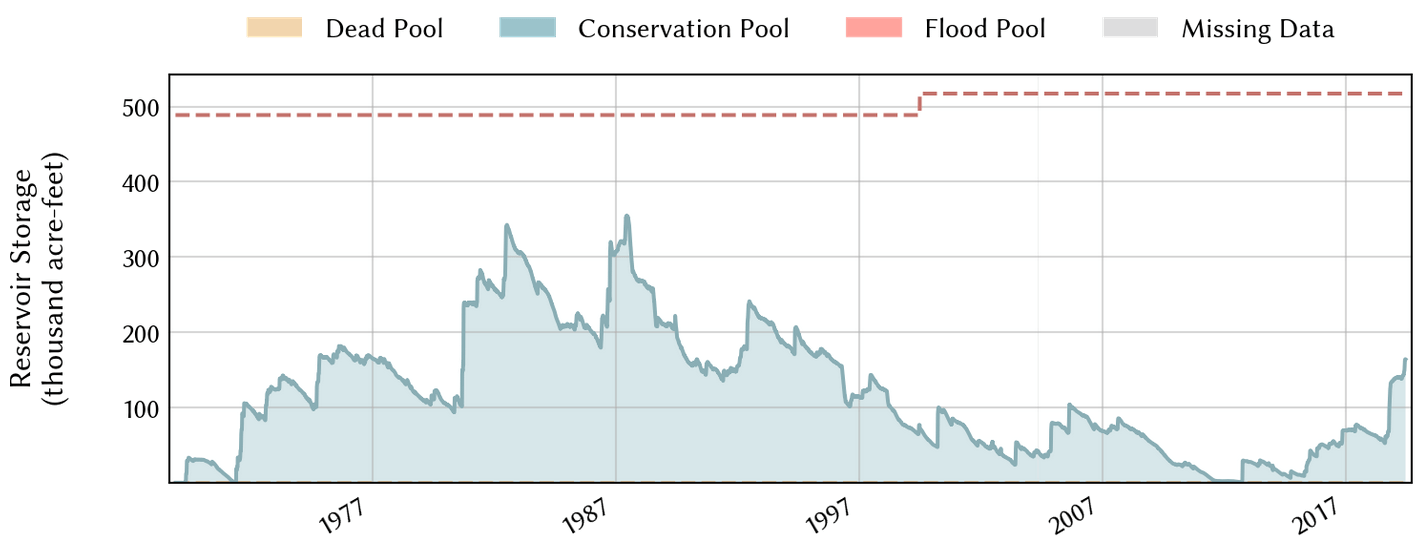
Statewide reservoir storage increased slightly over the past month and remains about 6 percentage points above normal for this time of year (Figure 5a). Percent full status for individual reservoirs this month (Figure 5b) is about the same as last month although Elephant Butte Reservoir is now about 25 percent full, up from 20 percent a month ago (Figure 5c); O.H. Ivie is now 77 percent full, up from 16 percent a year ago (Figure 5d); and E.V. Spence is now 32 percent full, up from 11 percent a year ago (Figure 5e). O.H. Ivie and E.V. Spence are at their highest levels since the late 1990s.
We are still under an El Niño Advisory with a 66 percent chance (down from 70 percent a month ago) of weak El Niño conditions continuing through the summer and a 50 to 55 percent chance (down from 55 to 60 percent a month ago) through the fall (Figure 6). El Niños generally result in wetter-than-normal and cooler-than-normal conditions for Texas and act as a tropical storm suppressor.
The U.S. Seasonal Drought Outlook through August 31, 2019, suggests an absence of drought conditions in the state (an already irrelevant projection…) with lingering drought in the Sacramento Mountains just north of the Texas-New Mexico border (Cloudcroft is under drought restrictions) (Figure 7).

Author
 Robert Mace,
Interim Executive Director & Chief Water Policy Officer at The Meadows Center for Water and the Environment
Robert Mace is a Professor of Practice in the Department of Geography at Texas State University. Robert has over 30 years of experience in hydrology, hydrogeology, stakeholder processes, and water policy, mostly in Texas.