SUMMARY:
- The amount of the state under drought conditions increased from about 25 percent four weeks ago to about 36 percent.
- Despite drought conditions, statewide reservoir storage is normal for this time of year.
- Tropical Storm Hanna should improve drought conditions in Central and South-Central Texas.
I wrote this article on July 24, 2020.
As I write this, the cats and I are awaiting the outer-ring arrival of rains from Tropical Storm Hanna (Figure 1a). Impending big weather always makes writing these columns a challenge when the time between the column due date and publication can approach a week. But the weather waits for no one, and Hanna is no exception. Drought conditions and rainfall deficits will likely look much different on the other side of this storm than what I present below.
Thus far, the 2020 tropical season has been one for the record books, having produced the earliest “C,” “E,” “F,” “G” and “H” storms with Gonzalo forming a full two months earlier than the average “G” storm (Figure 1b). With Hanna, we’ve already had eight named storms of the 13 to 19 projected by NOAA’s Climate Prediction Center and we are still a month and a half away from the season’s average peak in early September. Like your favorite mutual fund or first marriage, past performance does not guarantee future results, so only time will tell if 2020 beats 2005 (28 named storms and 15 hurricanes) as the most active on record.
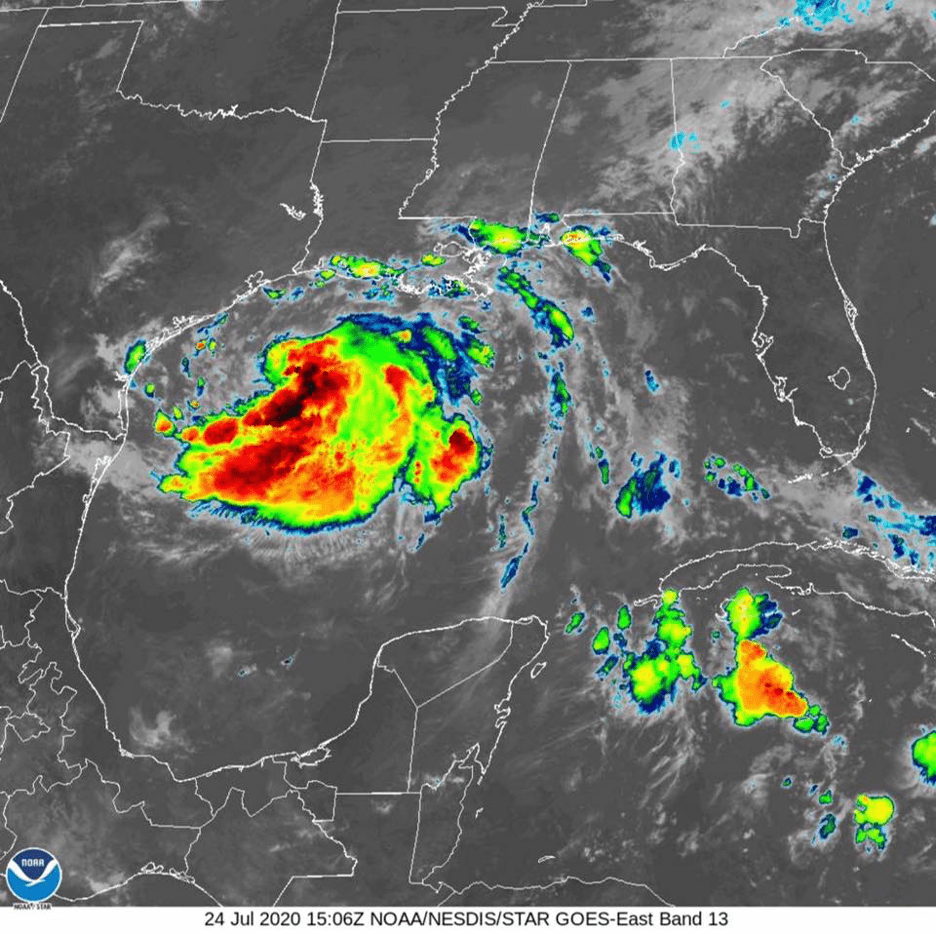
Figure 1a: Tropical Storm Hanna on July 24, 2020 (source).
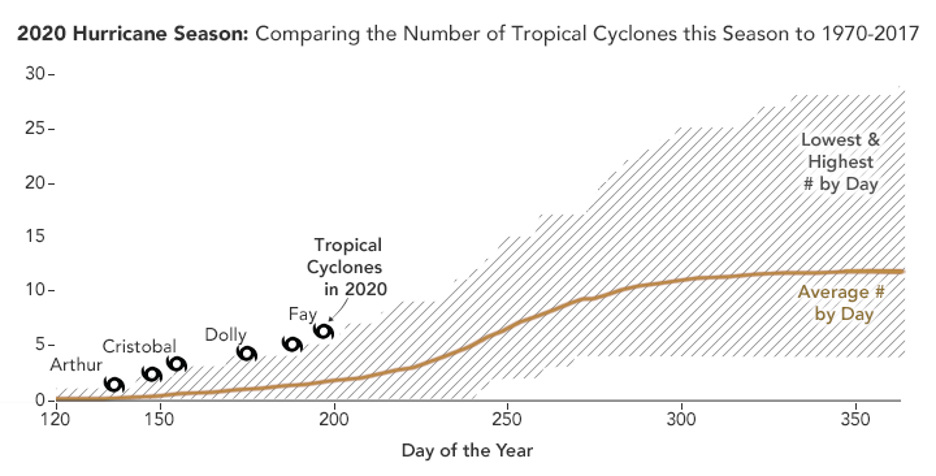
Figure 1b: Cumulative number of tropical storms in the Atlantic for day of the year for the average, fewest and most storms and for 2020 as of May (source).
Summer storms dropped five inches or more of rainfall on East Texas as well as the drought-ravaged Panhandle (Figure 2a). Much of the central part of the state and West Texas received less than half of inch (Figure 2a). Most of the state received less than normal rainfall over the past four weeks with much of Central and West Texas getting less than 25 percent of normal (Figure 2b). Looking back 90 days, most of the state is in deficit with Far West Texas at less than 25 percent of normal (Figure 2c).
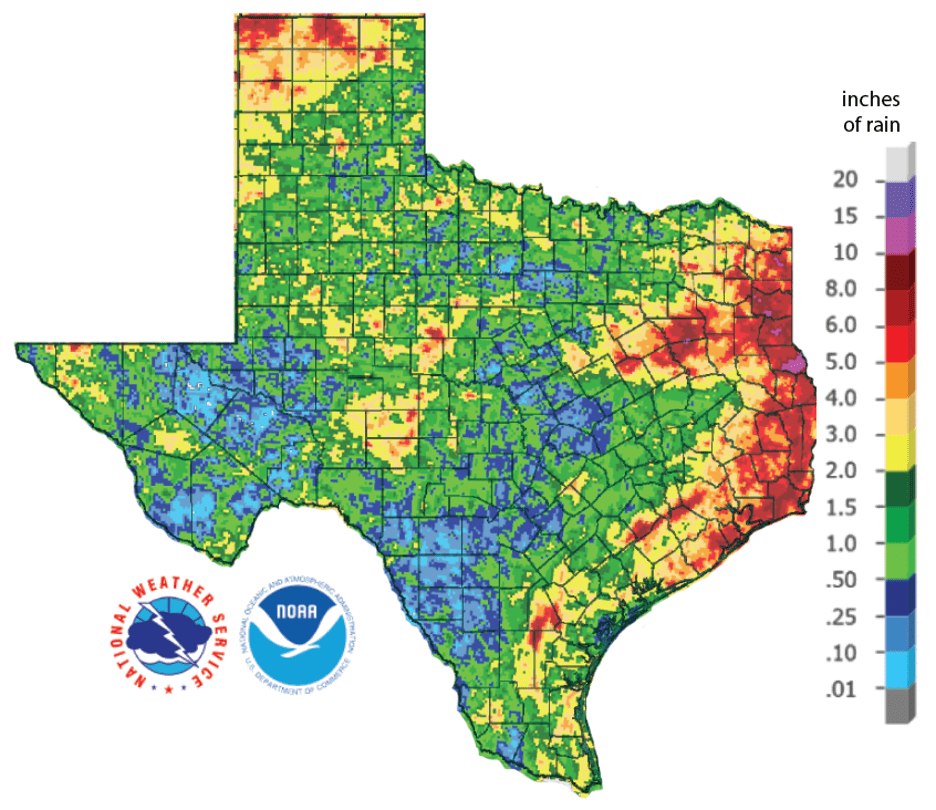
Figure 2a: Inches of precipitation that fell in Texas in the 30 days before July 24, 2020 (source). Note that cooler colors indicate lower values and warmer indicate higher values.
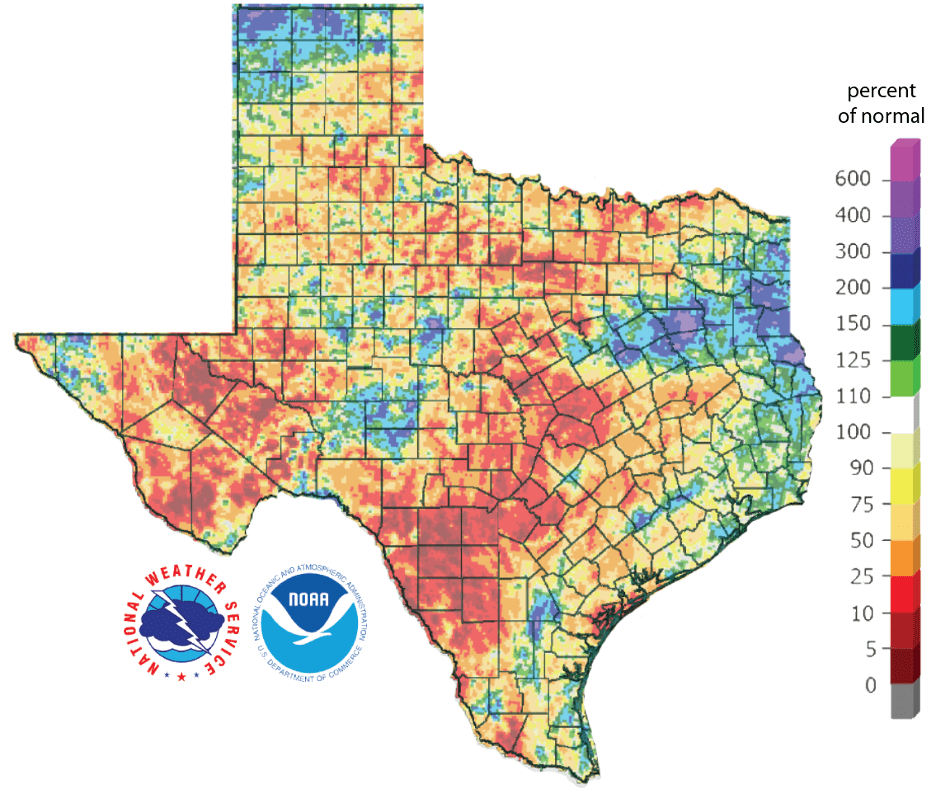
Figure 2b: Rainfall as a percent of normal for the past 30 days as of July 24, 2020 (source).
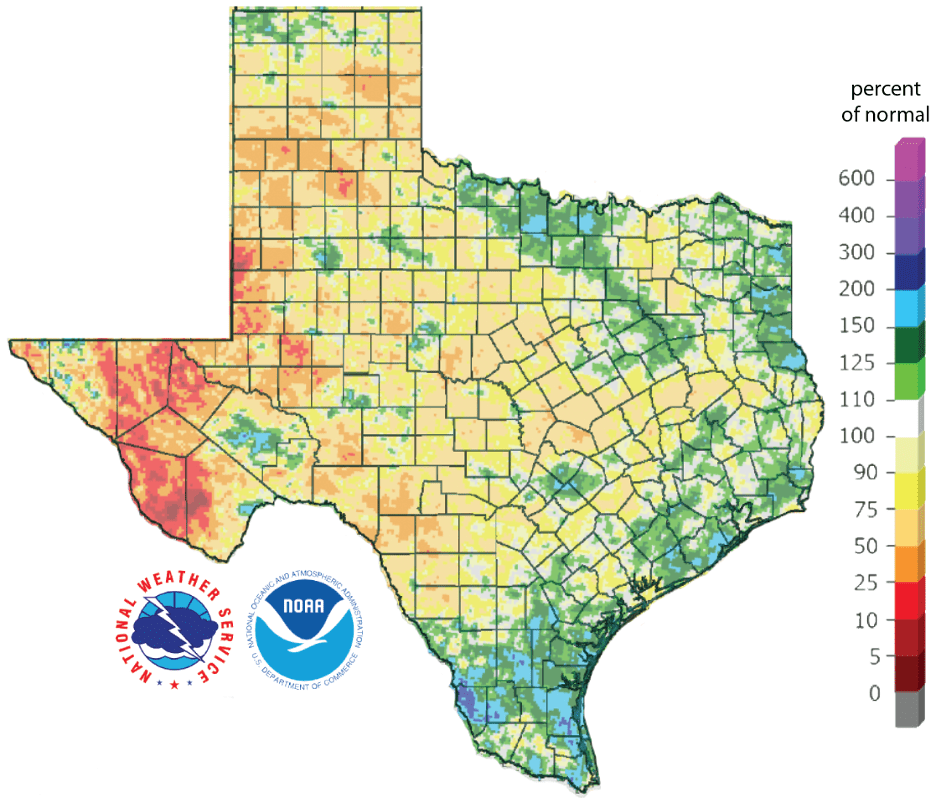
Figure 2c: Rainfall as a percent of normal for the past 90 days as of June 20, 2020 (source).
The amount of the state under drought conditions (D1-D4) increased from 24.8 percent four weeks ago to 36.4 percent today (Figure 3a). Rains over the past month knocked drought onto its tushy in the Panhandle but developed or intensified in Central and Far West Texas with four areas of Extreme Drought in West Texas (Figure 3b). About 14 percent of the state is now experiencing severe drought or worse (Figure 3a). In all, about 66 percent of the state is abnormally dry or worse (D0-D4; Figure 3a), up from 38 percent four weeks ago.
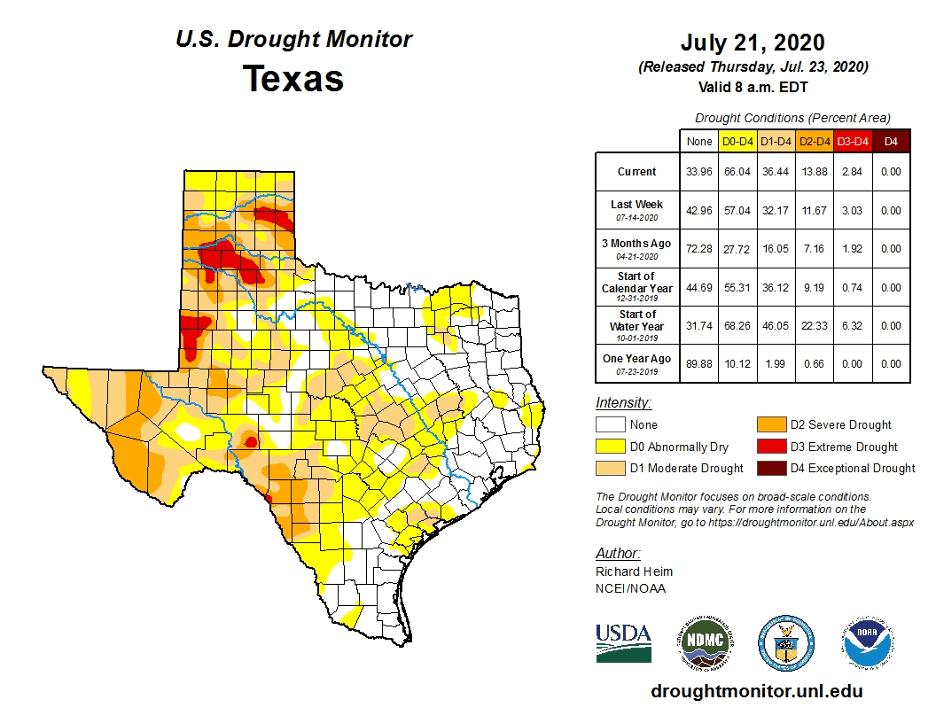
Figure 3a: Drought conditions in Texas according to the U.S. Drought Monitor (as of July 21, 2020; source).
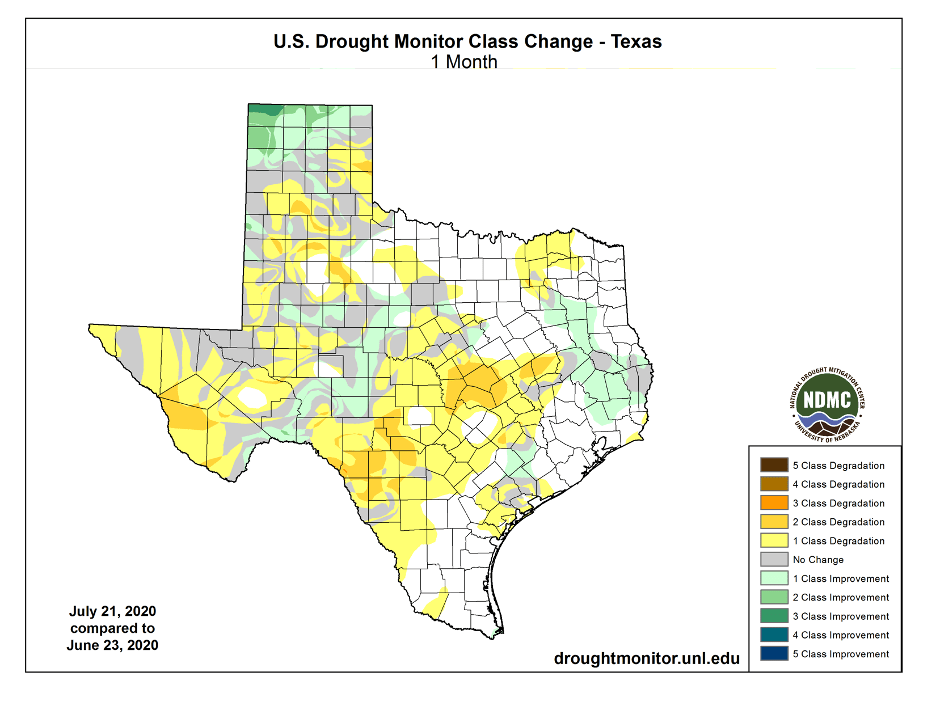
Figure 3b: Changes in the U.S. Drought Monitor for Texas between June 23, 2020 and July 21, 2020 (source).
The North American Drought Monitor for May shows the heart of the High Plains drought up in the Colorado- Kansas-New Mexico-Oklahoma area stretching west into the southern Colorado-northern New Mexico region (Figure 4a). Precipitation in the Rio Grande watershed in Colorado over the last 90 days is improved from last month but remains less than 50 percent of normal (Figure 4b). Conservation storage in Elephant Butte Reservoir decreased from 16.2 percent full on June 23 to 10.2 percent on July 24, 2020, some 15 percentage points below normal for this time of year (Figure 4c).
The Rio Conchos basin in Mexico, which confluences into the Rio Grande just above Presidio and is an important source of water to the lower part of the Rio Grande in Texas, continues to show moderate drought conditions with short-term impacts (Figure 4a). Combined conservation storage in Amistad and Falcon reservoirs decreased over the past month from 45.3 percent on June 23 to 41.9 percent on July 24, about 15 percentage points below normal for this time of year (Figure 4d).
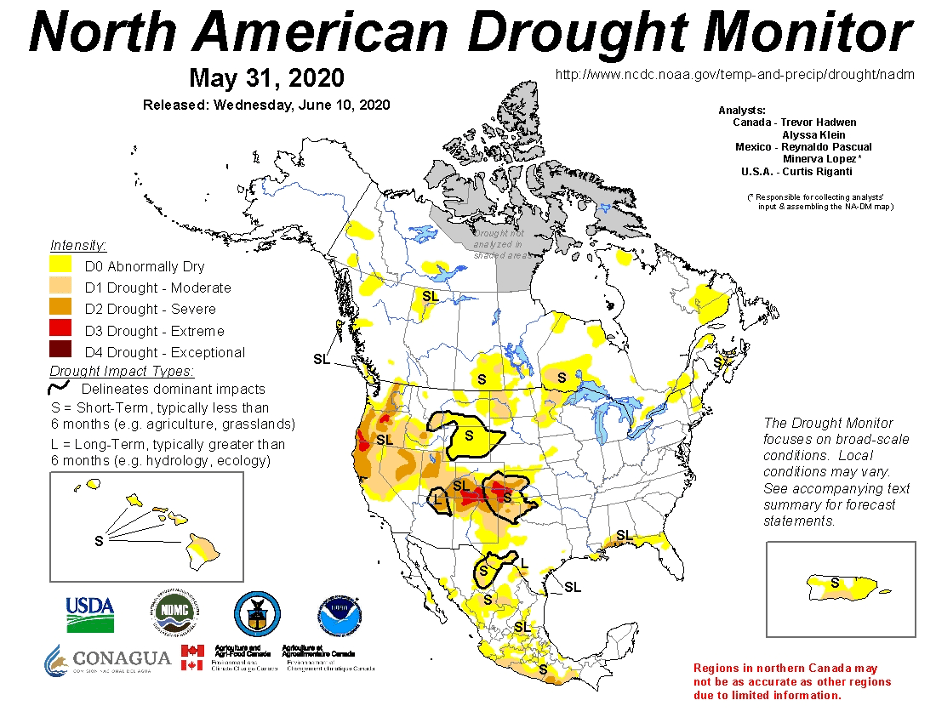
Figure 4a: The North American Drought Monitor for May 31, 2020 (source).

Figure 4b: Percent of normal precipitation for the past 90 days for Colorado and New Mexico as of July 24, 2020 (source). The red line is the Rio Grande Basin. I use this map to see check precipitation trends in the headwaters of the Rio Grande in southern Colorado, the main source of water to Elephant Butte Reservoir downstream.
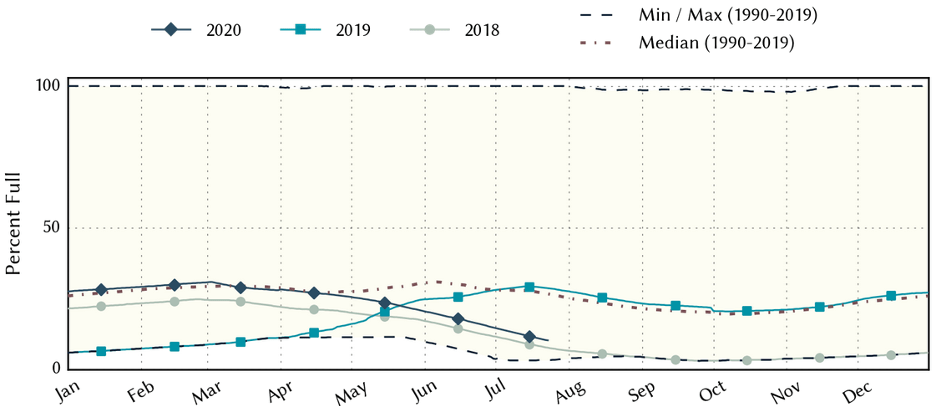
Figure 4c: Reservoir storage in Elephant Butte Reservoir since 2018 with the median, min and max for measurements since 1990 (source).
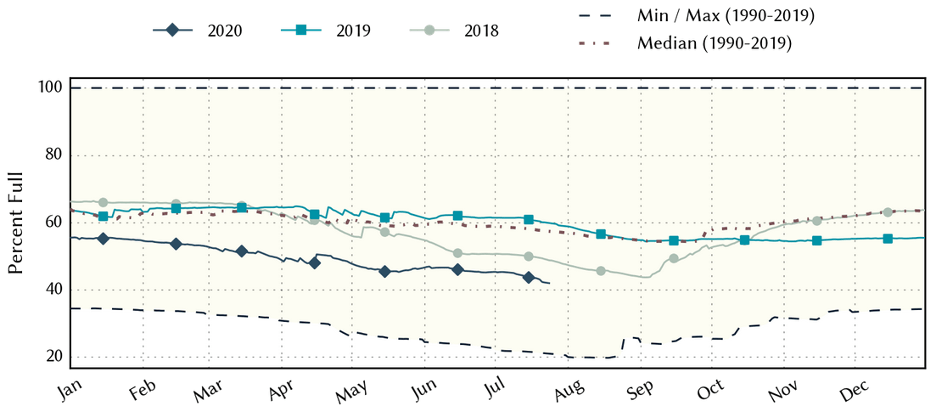
Figure 4d: Reservoir storage in Amistad and Falcon reservoirs since 2018 with the median, min and max for measurements since 1990 (source).
A number of river/stream basins in the state have flows over the past seven days less than 25 percent of normal with a half dozen or so catchments with flows less than 10 percent of normal and three less than 5 percent of normal (Figure 5a). Statewide reservoir storage is at 84.0 percent full as of July 24, down from 85.7 percent a month ago, and is normal for this time of year (Figure 5b). Storage in individual reservoirs remained relatively stable over the past month (Figure 5c).
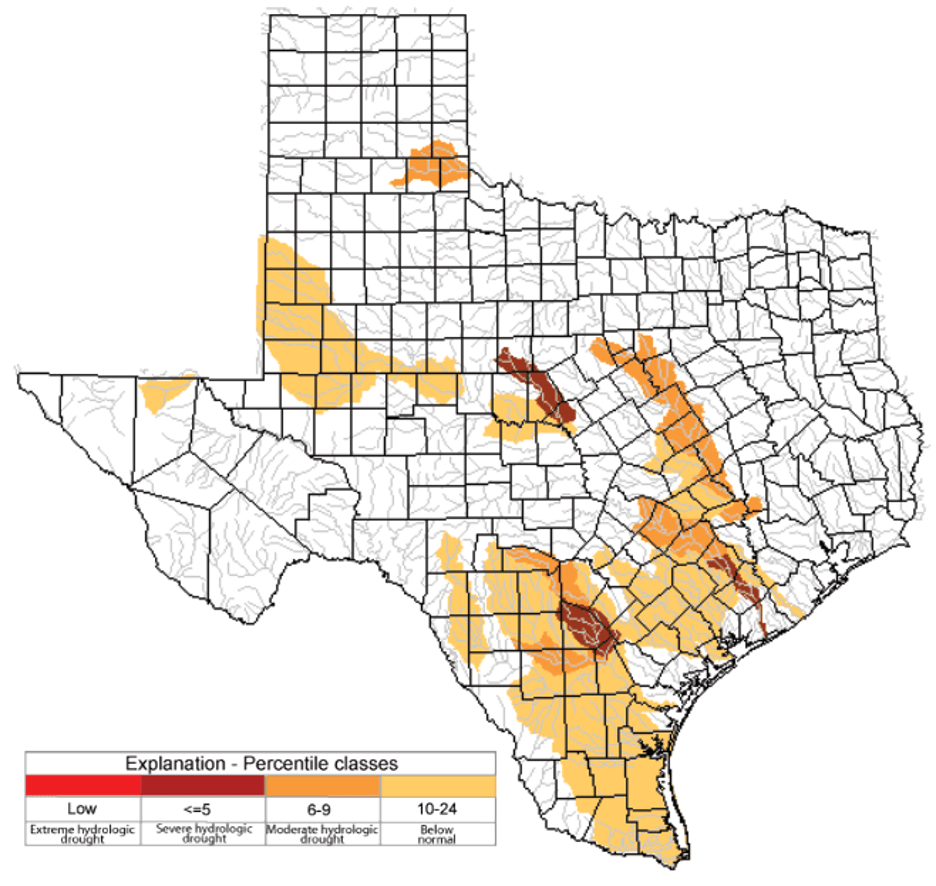
Figure 5a: Parts of the state with below-normal seven-day average streamflow as of July 23, 2020 (source).
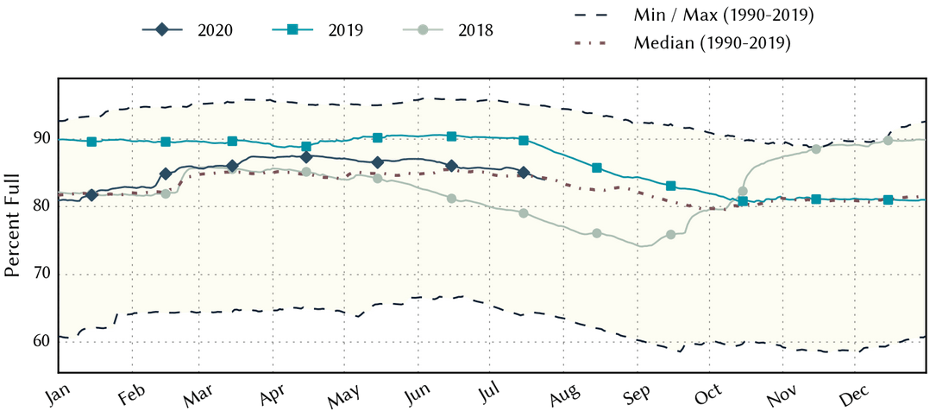
Figure 5b: Statewide reservoir storage since 2018 compared to statistics (median, min and max) for statewide storage since 1990 (source).
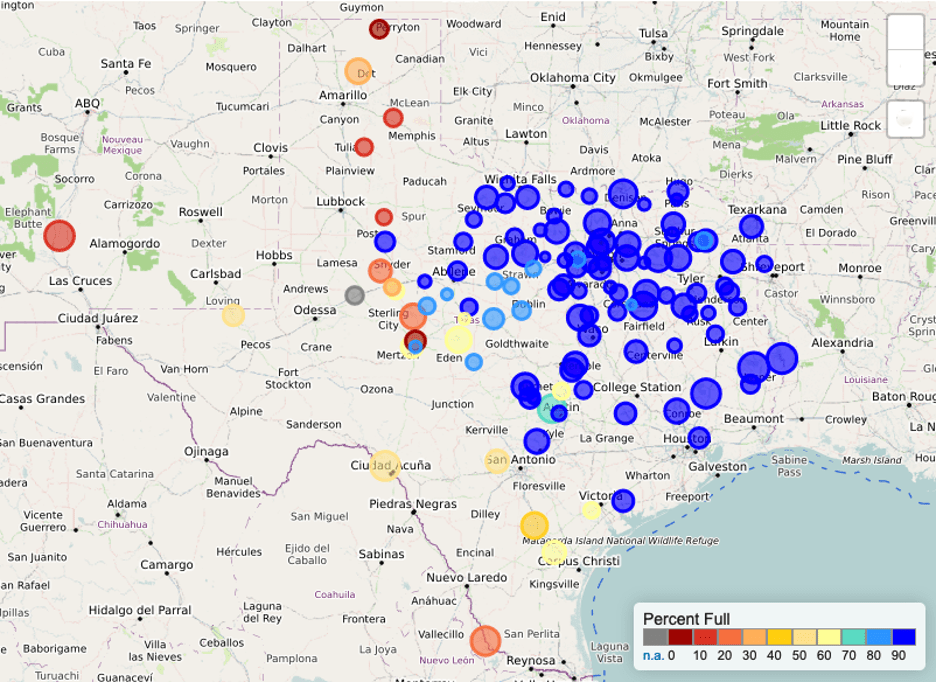
Figure 5c: Reservoir storage as July 24, 2020, in the major reservoirs of the state (source).
Sea-surface temperatures in the Central Pacific dropped into neutral territory (Figure 6a), so we remain in La Nada (neutral) conditions. The Climate Prediction Center projects neutral conditions to continue through the summer with a 50 to 55 percent chance of La Niña conditions developing for the fall and a 50 percent chance of La Niña continuing through the winter (Figure 6b).
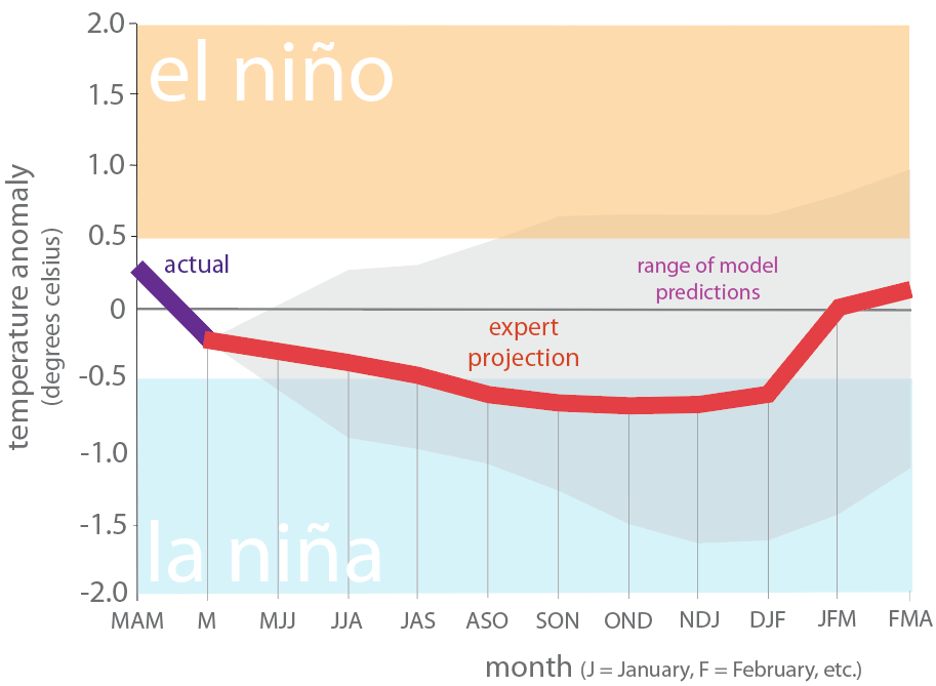
Figure 6a. Forecasts of sea-surface temperature anomalies for the Niño 3.4 Region as of June 19, 2020 (modified from source).
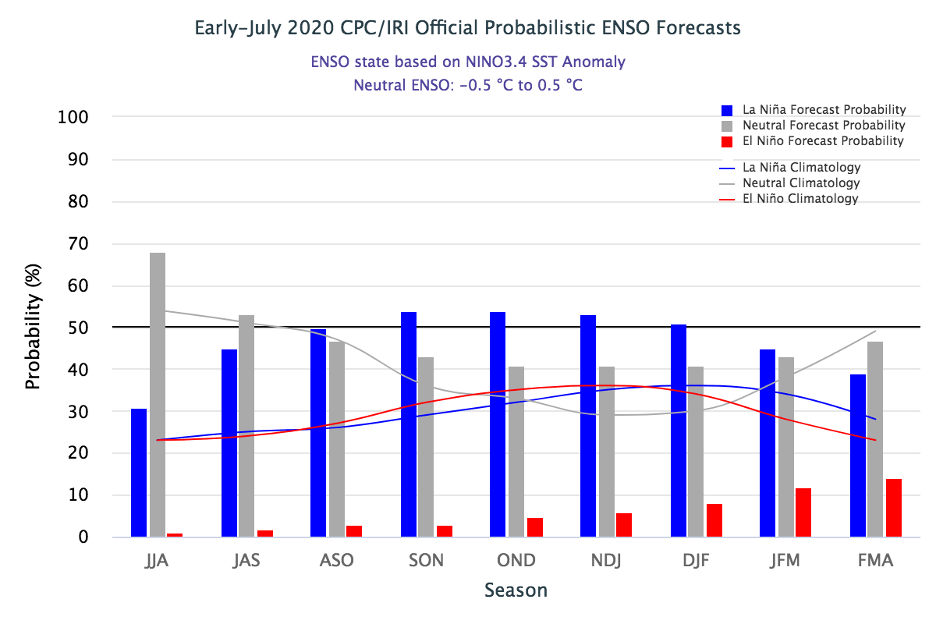
Figure 6b. Probabilistic forecasts of El Niño, La Niña and La Nada conditions (source).
The U.S. Seasonal Drought Outlook through October 31, 2020, projects drought persistence and development along much of West, Far West and Central Texas (Figure 7a). The Outlook also continues to show the drought consolidating across the western United States. The three-month temperature outlook projects (surprise surprise) warmer-than-normal conditions statewide with greater warming to the west (Figure 7b), while the three-month precipitation slightly favors drier-than-normal conditions for the Panhandle (Figure 7c).
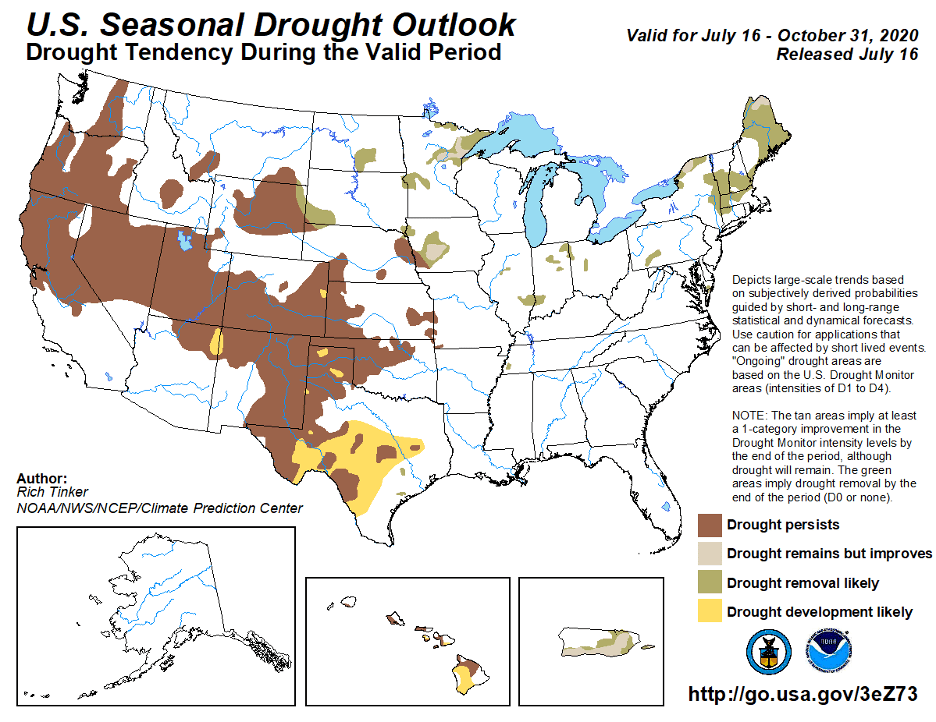
Figure 7a: The U.S. Seasonal Drought Outlook for July 16, 2020, through October 31, 2020 (source).
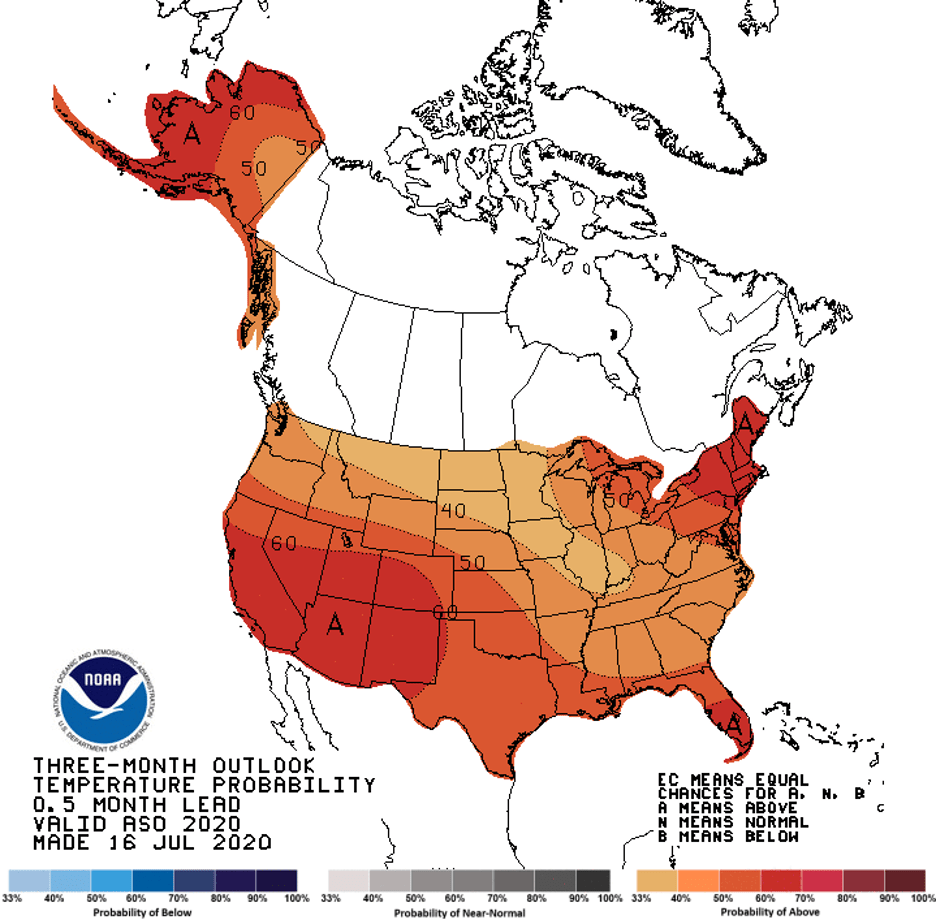
Figure 7b: Three-month temperature outlook from July 16, 2020 (source).

Figure 7c: Three-month precipitation outlook from July 16, 2020 (source).
Author

Robert Mace
Executive Director & Chief Water Policy Officer at The Meadows Center for Water and the Environment
Robert Mace is the Executive Director and the Chief Water Policy Officer at The Meadows Center. He is also Professor of Practice in the Department of Geography at Texas State University. Robert has over 30 years of experience in hydrology, hydrogeology, stakeholder processes and water policy, mostly in Texas.