SUMMARY:
- Continued rains remove drought across the state except the Big Bend Area.
- We are under a La Niña watch for the fall.
- The next month is projected to be cooler than normal and wetter than normal for much of the state.
I wrote this article on July 25, 2021.
It’s been something of an unusual summer so far, at least compared with summers in the somewhat recent past, seemingly cooler and wetter than normal. I decided to peek at where June ranks (too soon to look at July…) with respect to the record. The 1901 to 2000 average temperature was 79.6 degrees Fahrenheit compared to June 2021 temperature of 80.3 degrees Fahrenheit. Although June seemed cooler than normal, it was 0.7 degrees Fahrenheit warmer than normal (or at least the normal between 1901 to 2000; Figure 1a). However, our high temperatures have been 0.4 degrees Fahrenheit cooler than the record (but our lows have been 1.9 degrees Fahrenheit warmer than normal). Rainfall-wise, the state received 3.85 inches in June compared to the normal of 2.86 inches, 35 percent more than normal. Washington state—in the news lately for high temperatures—came in at 7.1 degrees Fahrenheit warmer than normal in June due to the heat dome that formed in the Pacific Northwest. Interestingly, June 2021 wasn’t the warmest June on record—2015 was (Figure 1b).

Figure 1a: Average temperature for June in Texas with the 1901 to 2000 mean (source).

Figure 1b: Average temperature for June in Washington with the 1901 to 2000 mean (source).
Well, the rains continued for another month with much of the Gulf Coast receiving more than 10 inches, much of West Texas getting more than 5 inches, and the El Paso area getting a year’s worth of rain (8 inches) over the past four weeks (Figure 2a). Only the Big Bend Area got less than half an inch of rain this month. A sizable part of the entire state got two to three times more than average over the past 28 days with the Big Bend Area missing out yet again (Figure 2b). Rain over the past 90 days was much less than normal in the Big Bend Area with the rest of state near normal or above (Figure 2c).

Figure 2a: Inches of precipitation that fell in Texas in the 30 days before July 25, 2021 (source). Note that cooler colors indicate lower values and warmer indicate higher values.

Figure 2b: Rainfall as a percent of normal for the 30 days before July 25, 2021 (source).

Figure 2c: Rainfall as a percent of normal for the 90 days before July 25, 2021 (source).
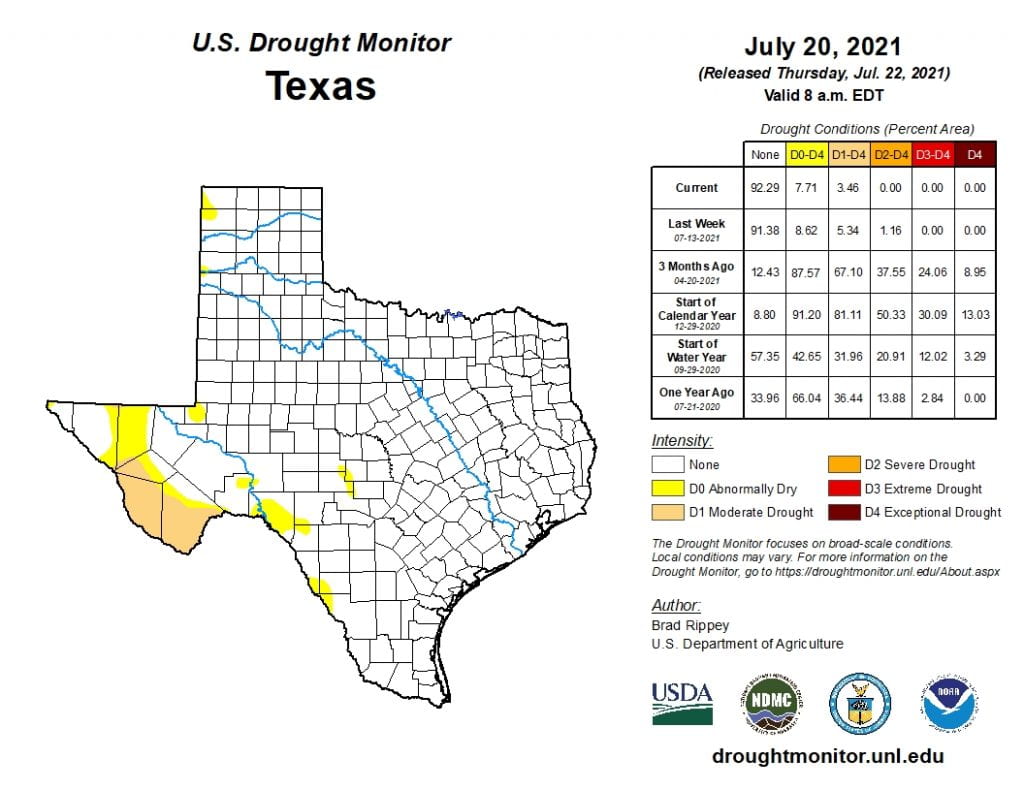
The amount of the state under drought conditions (D1–D4) decreased from 12.6 percent four weeks ago to 3.5 percent at present (Figure 3a) with drought and dry conditions fading away over much of the western parts of the state (Figure 3b). Exceptional drought, the most intense drought category, is now gone with only moderate drought in the Big Bend area (Figure 3a). Overall, 7.7 percent of the state remains abnormally dry or worse (D0–D4; Figure 3a), down considerably from 23.7 percent four weeks ago.

Figure 3a: Drought conditions in Texas according to the U.S. Drought Monitor (as of July 20, 2021; source).

Figure 3b: Changes in the U.S. Drought Monitor for Texas between June 22, 2021, and July 20, 2021 (source).
The North American Drought Monitor, which runs a month behind reality, continues to show a raging drought in much of the western United States with exceptional drought entrenched in the American Southwest (Figure 4a). In a welcome change, precipitation in most of the Rio Grande watershed in Colorado and New Mexico over the last 90 days was much greater than normal (Figure 4b). Conservation storage in Elephant Butte Reservoir decreased from 7.6 percent full last month to 6.5 percent (Figure 4c), just above historic (since 1990) lows.
The Rio Conchos basin in Mexico, which confluences into the Rio Grande just above Presidio and is an important source of water to the lower part of the Rio Grande in Texas, is in moderate to severe drought conditions (Figure 4a). Combined conservation storage in Amistad and Falcon reservoirs increased from 39.5 percent last month to 40.7 percent full today, still about 18 percentage points below normal for this time of year (Figure 4d).

Figure 4a: The North American Drought Monitor for June 30, 2021 (source).

Figure 4b: Percent of normal precipitation for Colorado and New Mexico for the 90 days before July 25, 2021 (source). The red line is the Rio Grande Basin. I use this map to see check precipitation trends in the headwaters of the Rio Grande in southern Colorado, the main source of water to Elephant Butte Reservoir downstream.

Figure 4c: Reservoir storage in Elephant Butte Reservoir since 2019 with the median, min, and max for measurements from 1990 through 2020 (source).

Figure 4d: Reservoir storage in Amistad and Falcon reservoirs since 2019 with the median, min, and max for measurements from 1990 through 2020 (source).
Despite the rains, there are still basins with flows below the historical 25th percentiles (Figure 5a). Statewide reservoir storage is at 85.7 percent full as of today, up from 85.3 percent a month ago and above normal for this time of year (Figure 5b). Most reservoirs in the eastern part of the state are now above 90 percent full (Figure 5c).

Figure 5a: Parts of the state with below-25th-percentile seven-day average streamflow as of July 25, 2021 (source).

Figure 5b: Statewide reservoir storage since 2019 compared to statistics (median, min, and max) for statewide storage from 1990 through 2020 (source).

Figure 5c: Reservoir storage as July 25, 2021 in the major reservoirs of the state (source).
Sea-surface temperatures in the Central Pacific that, in part, define the status of the El Niño Southern Oscillation, have continued their warming trend such that we remain in neutral (La Nada) conditions (Figure 6a). Projections of sea-surface temperatures remain above La Niña conditions through the summer with the possible return to La Niña conditions in early fall (Figure 6a). The jump in temperature projections in late fall and early winter appears to be an artifact reflecting uncertainty in projecting that far in the future. The Climate Prediction Center projects neutral conditions holding through the June-August season (Figure 6b) and issued a La Nina Watch for the September-November season.

Figure 6a. Forecasts of sea-surface temperature anomalies for the Niño 3.4 Region as of June 19, 2021 (modified from source). “Range of model predictions -1” is the range of the various statistical and dynamical models’ projections minus the most outlying upper and lower projections.

Figure 6b. Probabilistic forecasts of El Niño, La Niña, and La Nada conditions (source).
The U.S. Seasonal Drought Outlook through October 31, projects drought removal in Far West Texas over the next three months, a development that would drive drought out of Texas (Figure 7a). The three-month temperature outlook projects warmer-than-normal conditions for the western half of the state (Figure 7b) while the three-month precipitation favors wetter-than-normal conditions for the easternmost parts of the state and drier-than-normal conditions for the westernmost parts (Figure 7c). The one-month temperature outlook projects cooler-than-normal conditions for the northern half of the state (Figure 7d) while the one-month precipitation favors wetter-than-normal conditions for the entire state except the Big Bend Area (Figure 7e).

Figure 7a: The U.S. Seasonal Drought Outlook for July 15, 2021, through October 31, 2021 (source).

Figure 7b: Three-month temperature outlook from July 15, 2021 (source).

Figure 7c: Three-month precipitation outlook from July 15, 2021 (source).

Figure 7d: One-month temperature outlook from July 15, 2021 (source).

Figure 7e: One-month precipitation outlook from July 15, 2021 (source).