SUMMARY:
- Drought continues to shrink.
- Warmest July on record for the planet but 21st coolest in Texas.
- Hurricane season is in full force.
I wrote this article on August 21, 2021.
It continues to be something of an unusual summer so far, seemingly cooler and wetter than normal. July numbers are now available, so let’s take a look! The July 2021 temperature was 80.9 °F, 1.4 degrees cooler than the 1901 to 2000 average July temperature of 82.3 °F (Figure 1a). July 2021 came in as the 21st coolest July on record (for the past 127 years), tied with Julys in 2002, 1991, and 1941. Rainfall-wise, the state received 4.01 inches in July, 1.68 inches more that the normal of 2.33 inches (Figure 1b). Indeed, this past July was a wet one, clocking in as the 9th wettest on record. The wettest and the second wettest Julys on record were in 2007 and 2010, with 5.37 and 5.12 inches of rain, respectively.
Globally, it’s a different story. According to NOAA, July was the warmest month on the planet for our 142-year record, raising the mercury to 1.67 °F above the average for the 20th Century. The land-surface temperature for the Northern Hemisphere was the highest ever recorded for July at 2.77 degrees warmer than normal.
The planet is not the only thing warming up around here—so is hurricane season. Although at one point it looked like Grace might beach in Texas, she followed a more southern track into the Yucatan. Grace arrived in Mexico as a Category 1, softened back into a storm, and then—once back over the Gulf—quickly jumped to a Category 3. Rapid intensification of tropical systems is becoming far more common and is yet another product of climate change.

Figure 1a: Average temperature for July in Texas with the 1901 to 2000 mean (source).

Figure 2a: Rainfall for July in Texas with the 1901 to 2000 mean (source).
The relentless rains eased for much of the state, but a number of blotchy spots across Texas received five inches or more including, unusually, a sizable part of Far West Texas (Figure 2a). The Big Bend area continued to miss out on the largess, although even it had a spot with more than five inches of rainfall (Figure 2a). Where the rain fell, it was not uncommon for it to exceed normal amounts by two to three times (Figure 2b). However, there were also parts of the state, especially the Big Bend area and the northern part of the High Plains, where only 25% or less of normal fell (Figure 2b). Rain over the past 90 days is much less than normal in the Big Bend area with the rest of state near normal or above (Figure 2c).

Figure 2a: Inches of precipitation that fell in Texas in the 30 days before August 21, 2021 (source). Note that cooler colors indicate lower values and warmer indicate higher values.

Figure 2b: Rainfall as a percent of normal for the 30 days before August 21, 2021 (source).

Figure 2c: Rainfall as a percent of normal for the 90 days before August 21, 2021 (source).
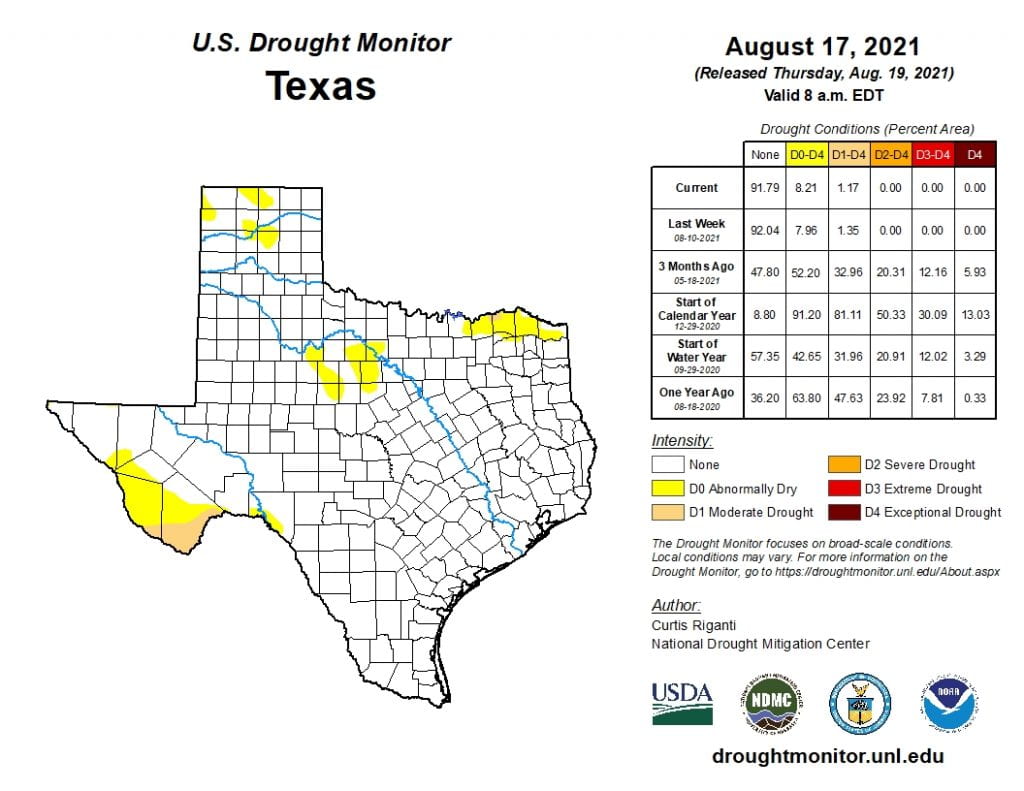
The amount of the state under drought conditions (D1–D4) decreased from 3.5% four weeks ago to 1.2% today (Figure 3a) with drought and dry conditions continuing to fade away in the far western part of the state (Figure 3b). The Big Bend area is showing moderate drought while a small patch of moderate drought has appeared in northwestern Lamar County along the Red River (Figure 3a). In all, 8.2% of the state remains abnormally dry or worse (D0–D4; Figure 3a), up slightly from 7.7% four weeks ago with abnormally dry conditions appearing in a few areas in the northern half of the state (Figure 3b).

Figure 3a: Drought conditions in Texas according to the U.S. Drought Monitor (as of August 17, 2021; source).

Figure 3b: Changes in the U.S. Drought Monitor for Texas between July 20, 2021, and August 17, 2021 (source).
The North American Drought Monitor, which runs a month behind reality, continues to show a raging drought in much of the western United States, with exceptional drought entrenched in the American Southwest (Figure 4a). In a welcome change, precipitation in most of the Rio Grande watershed in Colorado and New Mexico over the last 90 days was much greater than normal (Figure 4b). Conservation storage in Elephant Butte Reservoir decreased from 6.5% full last month to 5.1% (Figure 4c), just above historic (since 1990) lows.
The Rio Conchos basin in Mexico, which confluences into the Rio Grande just above Presidio and is an important source of water to the lower part of the Rio Grande in Texas, is out of drought conditions (Figure 4a). Combined conservation storage in Amistad and Falcon reservoirs decreased from 40.7% last month to 39.9% full today, still about 18 percentage points below normal for this time of year (Figure 4d).

Figure 4a: The North American Drought Monitor for July 31, 2021 (source).

Figure 4b: Percent of normal precipitation for Colorado and New Mexico for the 90 days before August 21, 2021 (source). The red line is the Rio Grande Basin. I use this map to see check precipitation trends in the headwaters of the Rio Grande in southern Colorado, the main source of water to Elephant Butte Reservoir downstream.

Figure 4c: Reservoir storage in Elephant Butte Reservoir since 2019 with the median, min, and max for measurements from 1990 through 2020 (source).

Figure 4d: Reservoir storage in Amistad and Falcon reservoirs since 2019 with the median, min, and max for measurements from 1990 through 2020 (source).
Despite the rains, there are still basins with flows below historical 25th flow percentiles (Figure 5a). Statewide reservoir storage is at 84.9% full as of today, down from 85.7% a month ago but a few percentage points above normal for this time of year (Figure 5b). Most reservoirs in the eastern part of the state are now above 90% full, although a few are below 90% and 80% full (Figure 5c).

Figure 5a: Parts of the state with below-25th-percentile seven-day average streamflow as of August 21, 2021 (source).

Figure 5b: Statewide reservoir storage since 2019 compared to statistics (median, min, and max) for statewide storage from 1990 through 2020 (source).

Figure 5c: Reservoir storage as August 21, 2021 in the major reservoirs of the state (source).
Sea-surface temperatures in the Central Pacific that, in part, define the status of the El Niño Southern Oscillation, have continued their warming trend such that we remain in neutral (La Nada) conditions (Figure 6a). Projections of sea-surface temperatures remain in neutral conditions through mid-to-late summer with a projected return to La Niña conditions in late summer or early fall. This month’s projection favors a return to La Niña more than last month’s (Figure 6a). The Climate Prediction Center projects a 60% chance of neutral conditions holding through the July–September season with a 70% percent chance of La Niña conditions forming during the August–October season and lasting through the winter (Figure 6b). As a result, we remain under a La Niña watch. Projections suggest a return to neutral conditions in January of next year, but the prediction skill that far out is suspect, so don’t place your chips just yet.

Figure 6a. Forecasts of sea-surface temperature anomalies for the Niño 3.4 Region as of July 19, 2021 (modified from source). “Range of model predictions -1” is the range of the various statistical and dynamical models’ projections minus the most outlying upper and lower projections.

Figure 6b. Probabilistic forecasts of El Niño, La Niña, and La Nada (neutral) conditions (source).
The U.S. Seasonal Drought Outlook through November 30, 2021, projects drought removal in Far West Texas over the next three months, a development that would drive drought out of Texas (Figure 7a). The three-month temperature outlook projects warmer-than-normal conditions for the western two-thirds of the state (Figure 7b), while the three-month precipitation favors drier-than-normal conditions for the western third of the state (Figure 7c).

Figure 7a: The U.S. Seasonal Drought Outlook for August 19, 2021, through November 30, 2021 (source).

Figure 7b: Three-month temperature outlook from August 19, 2021 (source).

Figure 7c: Three-month precipitation outlook from August 19, 2021 (source).