SUMMARY:
-
September was the wettest September on record for Texas and the third wettest month on record.
-
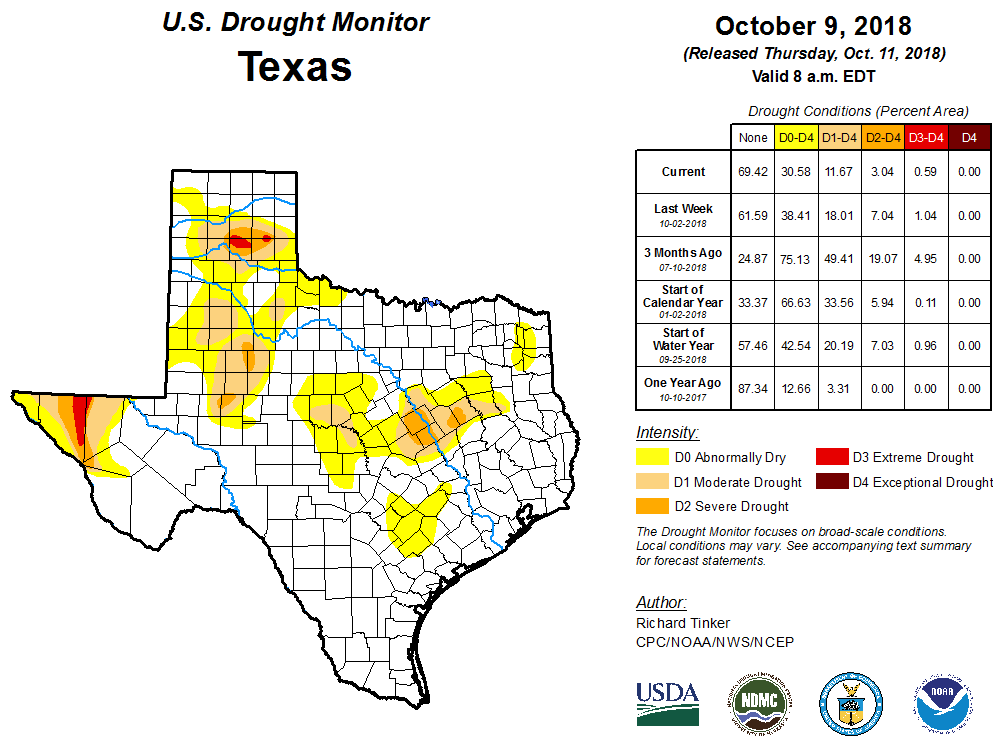
Drought is down to affecting 12 percent of the state.
-
Statewide reservoir levels continue to rise.
-
The odds of El Niño paying a visit are up to 70 to 75 percent.
Our cats have not been happy. Over the past couple of months, their hollow gazes have been fringed with disappointment and concern, plaintive mews escaping their cute little lips: “You write about the weather, but you don’t seem to do anything about it. Where’s the sun?!?!” Indeed, the weather pattern has changed dramatically from sunny, dry days to overcast and rainy (and precious few moments for sunbathing).
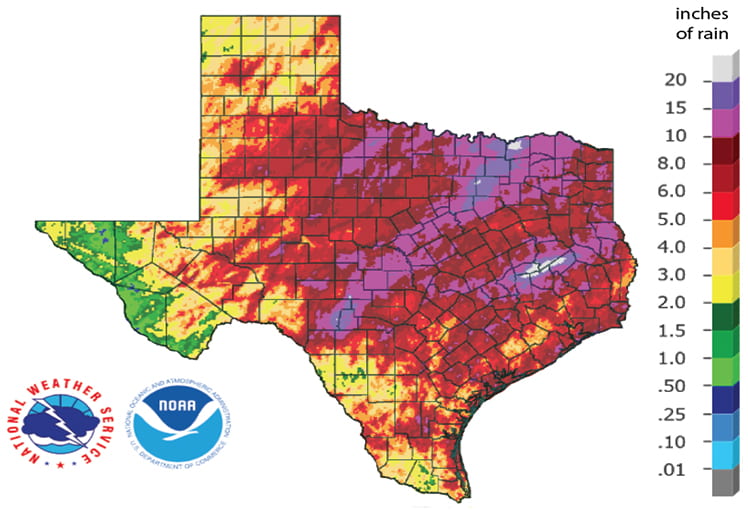
The big rains in north-east, north-central, and central Texas have continued from last month with sizable parts of the state receiving 10 inches or more and some parts seeing more than 20 inches (Figure 1a). According to the National Centers for Environmental Information, September 2018 was the wettest September on record (since 1895) and, at statewide precipitation total of 6.77 inches, the third wettest on record after May 2015 and August 2017 (source).
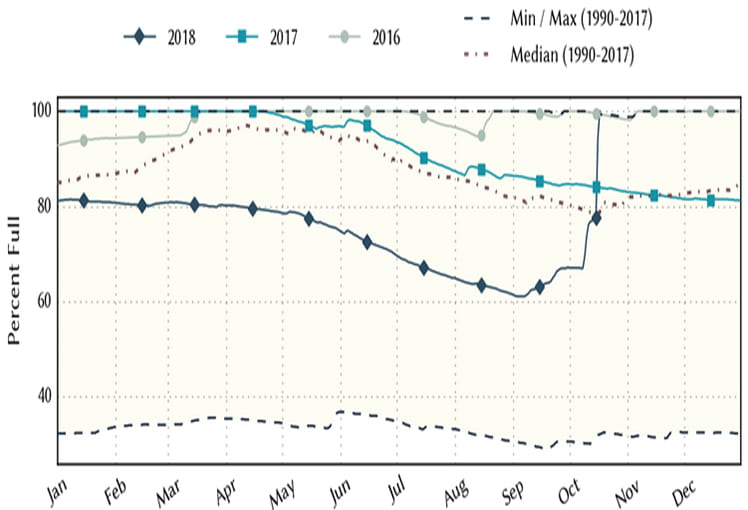
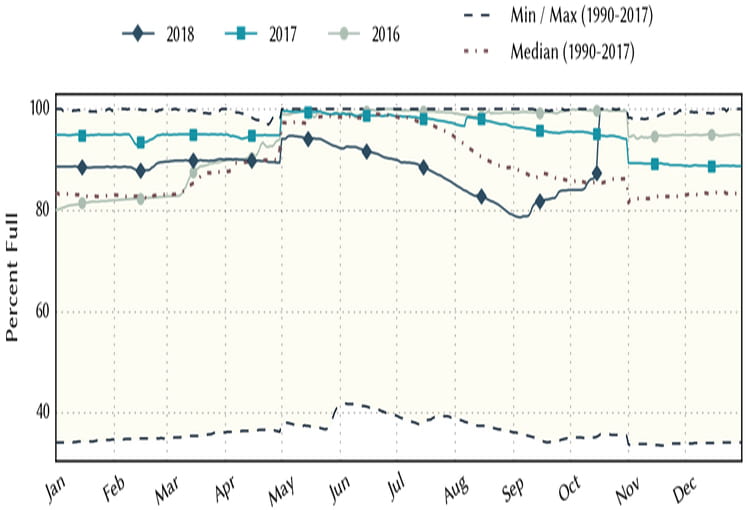
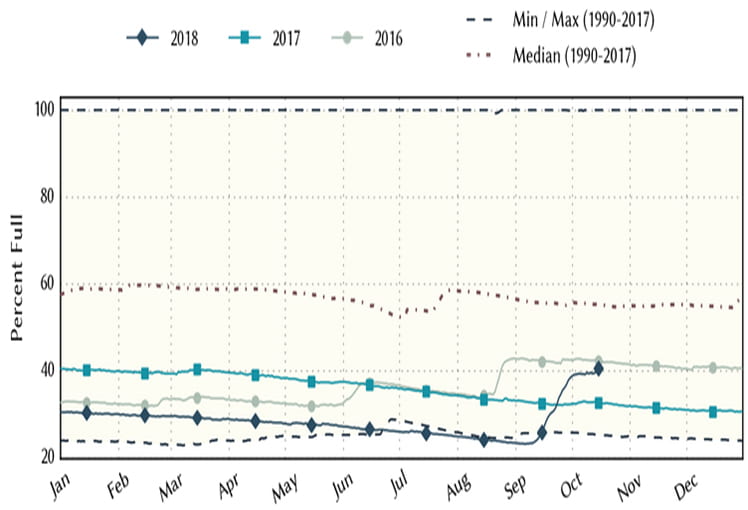
As I write this, massive rains in the upper Hill Country have washed out a bridge on the Llano and, almost overnight, filled up Lake Travis and Lake Buchanan (Figures 1b and 1c). Even Choke Canyon Reservoir on the Frio saw a bump in storage over the last month that pulled it out of record low territory (Figure 1d).
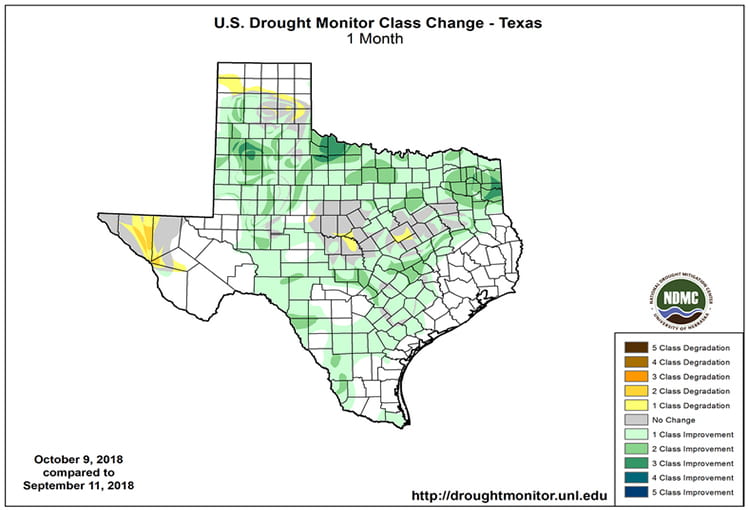
The statewide drought is slightly improved now (46 percent of the state in drought; Figure 2) than a month ago (47 percent); however, recent weather patterns rearranged drought across the state removing drought along the Gulf Coast, lessening severity in many parts of West Texas, and doubling down on the north-to-south center of the state (Figure 3).
The amount of Texas in drought over the past month has again more than halved from 29 percent to 12 percent; however, small parts of West Texas are still suffering from extreme and exceptional drought conditions and extreme drought has developed in Far West Texas, along the Culberson-Hudspeth county line (Figure 2a). We saw improvements in drought conditions across most of the state (Figure 2b). Rainfalls over the past week should result in further drought improvements in the eastern half of the state.
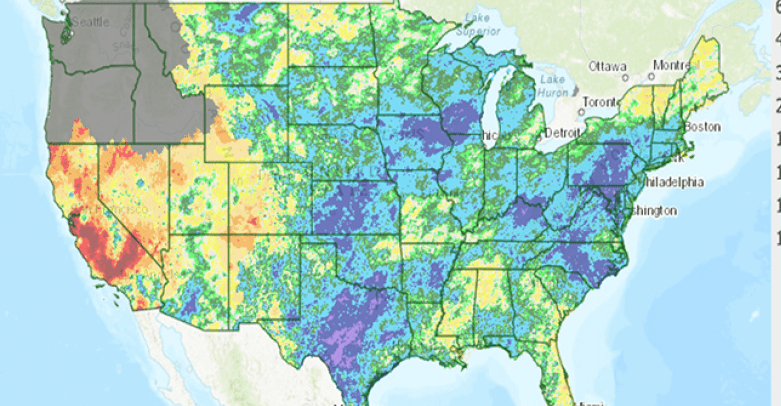
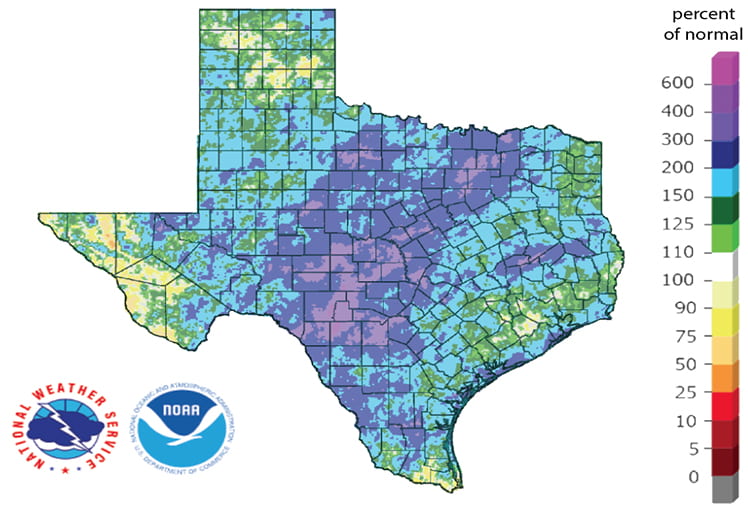
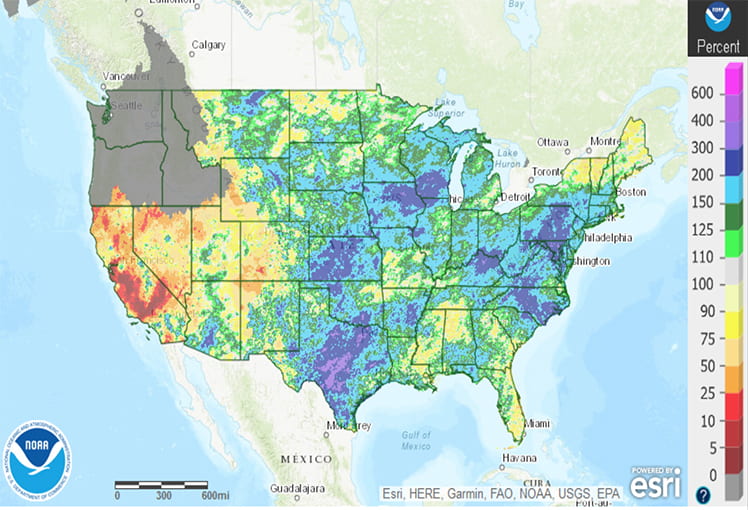
Ninety-day rainfall deficits continue to improve with sizable parts of the state with at least twice as much rainfall as normal (Figure 3). Even with all the recent rains, there are still widely distributed splotchy parts of East Texas, the Rio Grande Valley, the High Plains, and Far West Texas where rainfall is below normal.
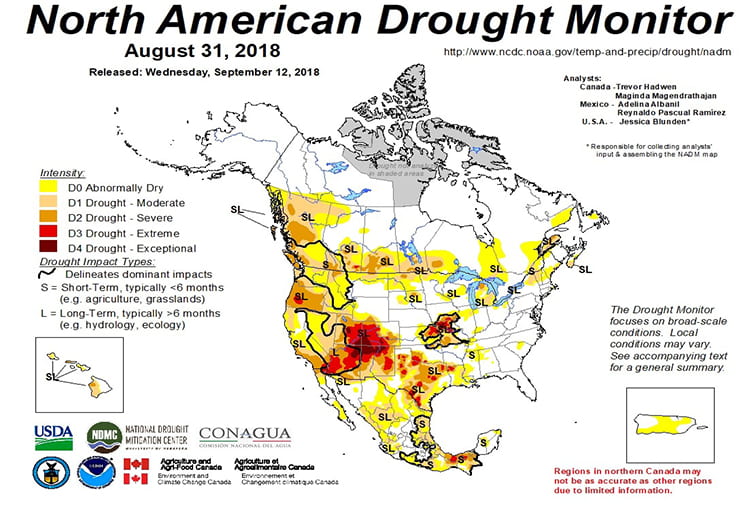
As I write this, the North American Drought Monitor for conditions at the end of September had not been published, so I’m showing conditions at the end of August again (Figure 4a). Rainfall deficits over the past 90 days for the United States shows continuing drought in the headwaters of the Rio Grande in southern Colorado (Figure 4b).
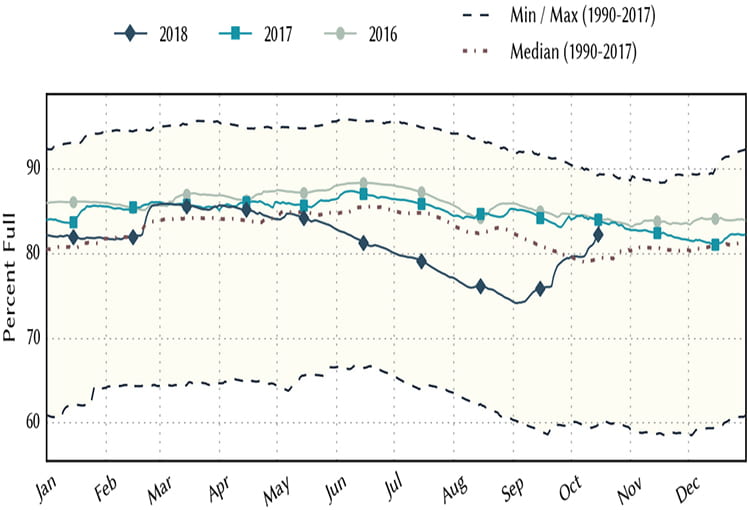
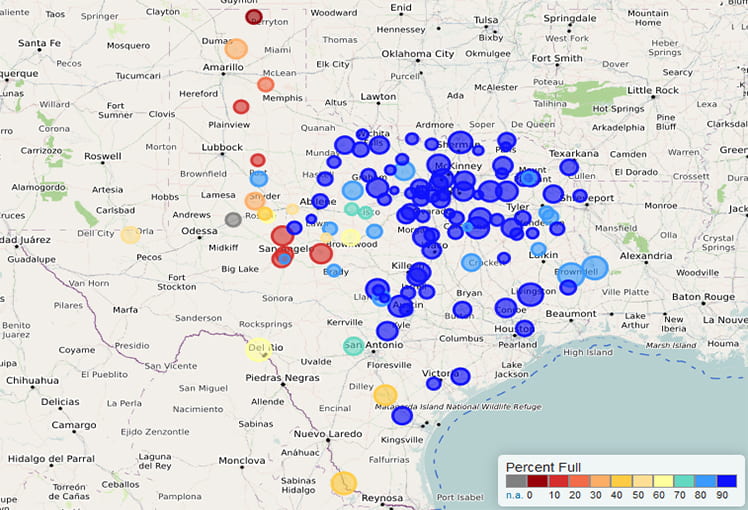
Persistent rains have continued the upswing in statewide reservoir storage, lifting storage from 78.1 percent on September 23rd to 84.3 percent on October 17th (Figure 5a). Reservoirs in the eastern part of the state are generally showing increases in storage (compare Figure 5b, this month, to Figure 6b, last month).
We remain under an El Niño Watch for the fall and winter with increased certainty of 70 to 75 percent. The consensus projection shows El Niño conditions arriving this fall (Figure 6). El Niños generally result in wetter-than-normal and cooler-than-normal conditions for Texas and act as a tropical storm suppressor.

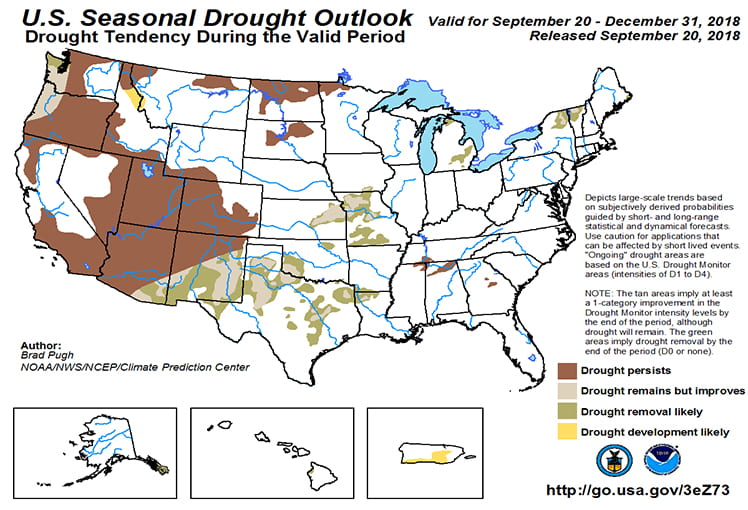
The U.S. Seasonal Drought Outlook through December is the same as last month’s with drought improvements projected for across the state (Figure 7).
Author

Dr. Robert Mace,
Deputy Executive Director & Chief Water Policy Officer at The Meadows Center for Water and the Environment
Robert Mace is a Professor of Practice in the Department of Geography at Texas State University. Robert has over 30 years of experience in hydrology, hydrogeology, stakeholder processes, and water policy, mostly in Texas.