SUMMARY:
-
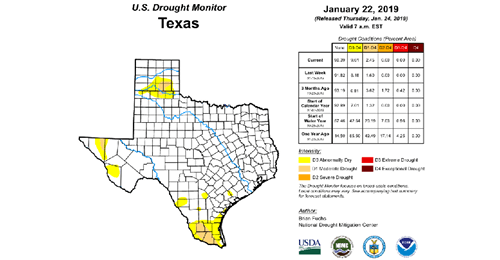
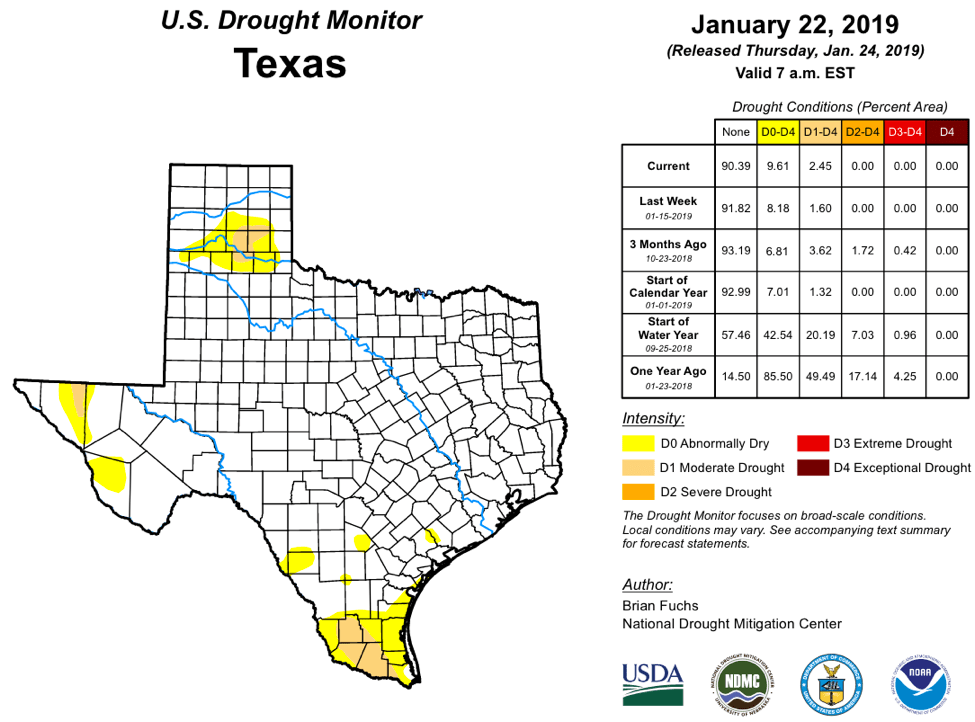
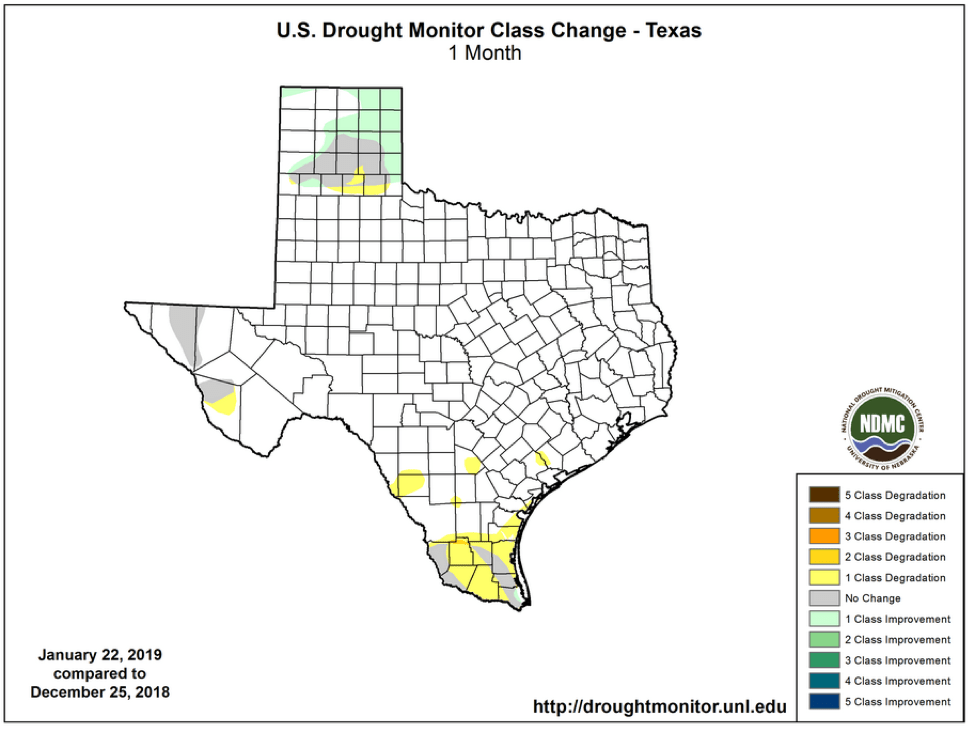
Drought conditions increased to affect 2.5 percent of the state.
-
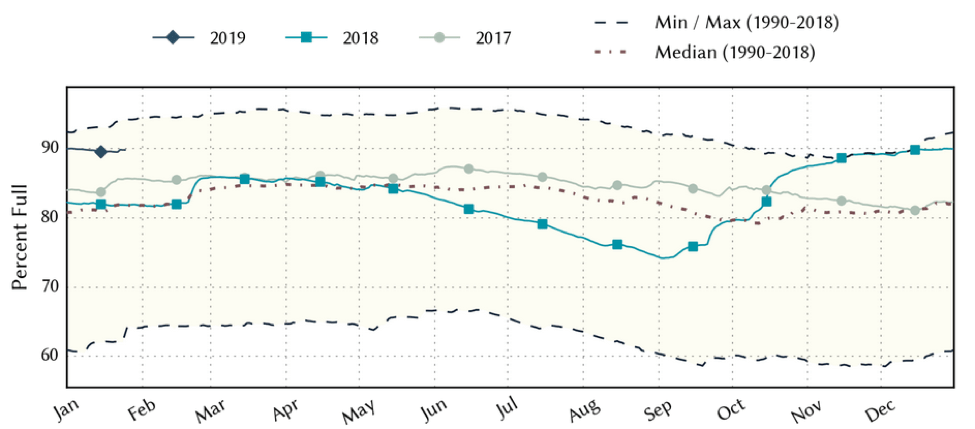
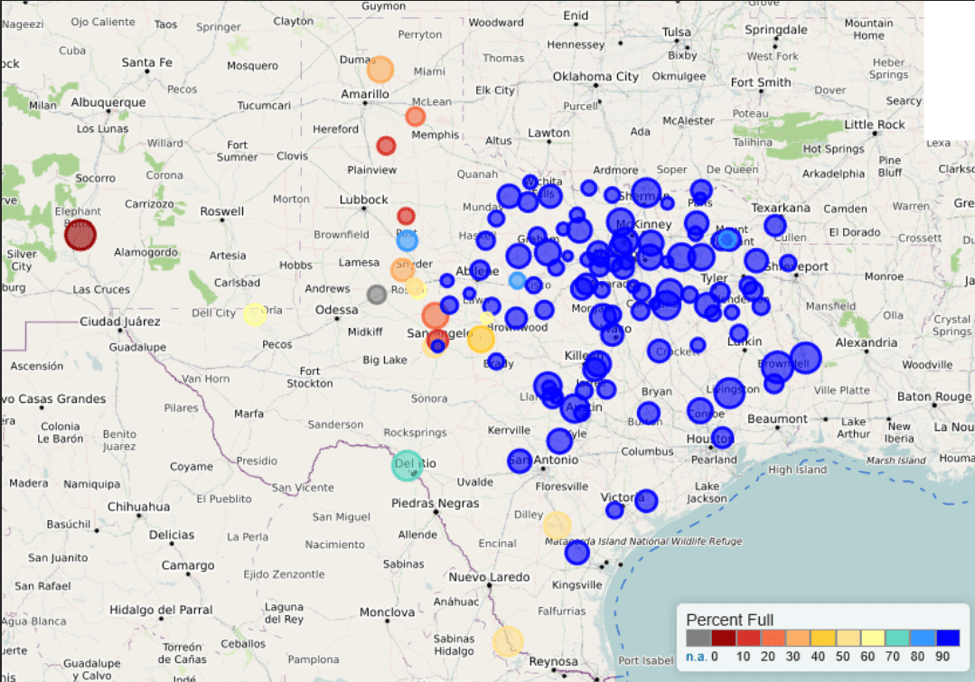
Statewide reservoir storage is at 90 percent.
-
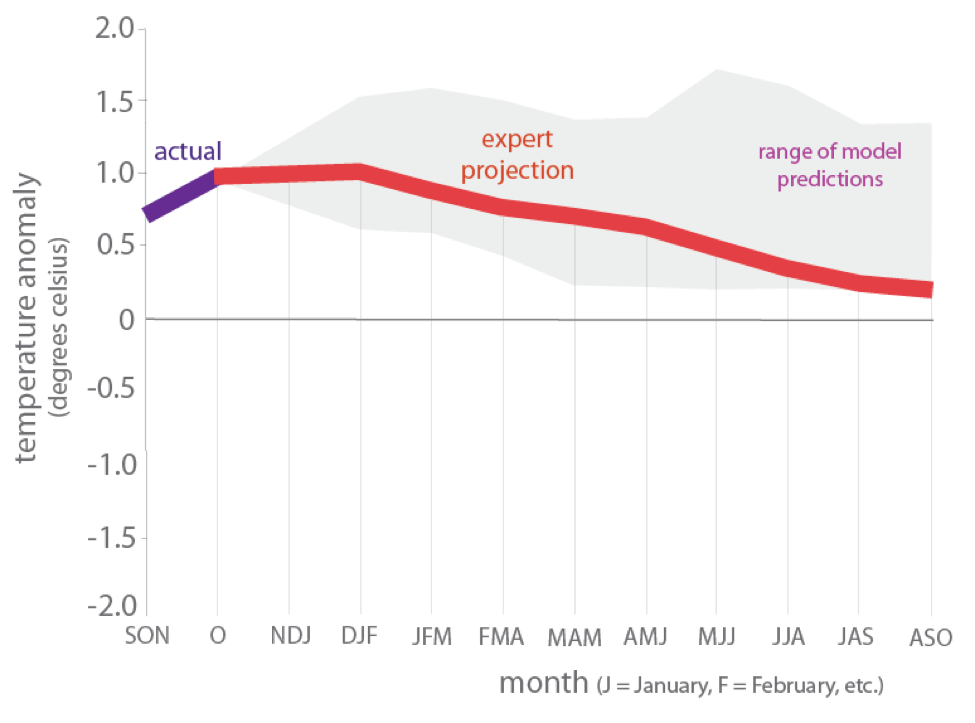
The Pacific remains warm enough for El Niño, but has not yet linked with the atmosphere; the chance of El Niño conditions has decreased to ~65 percent.
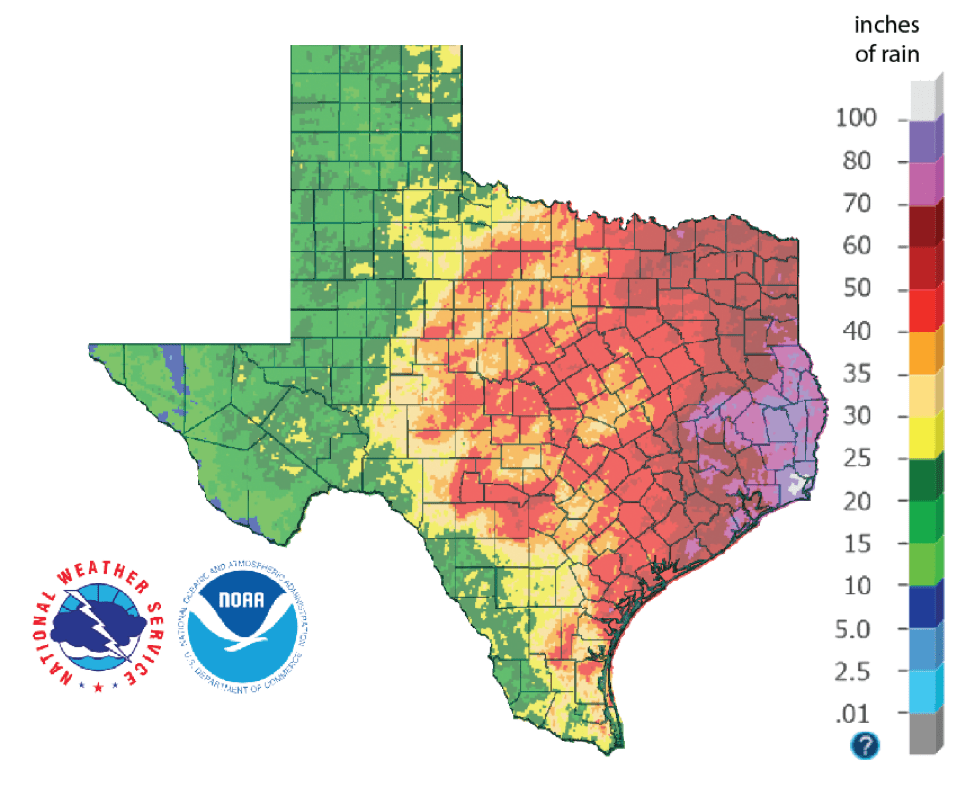
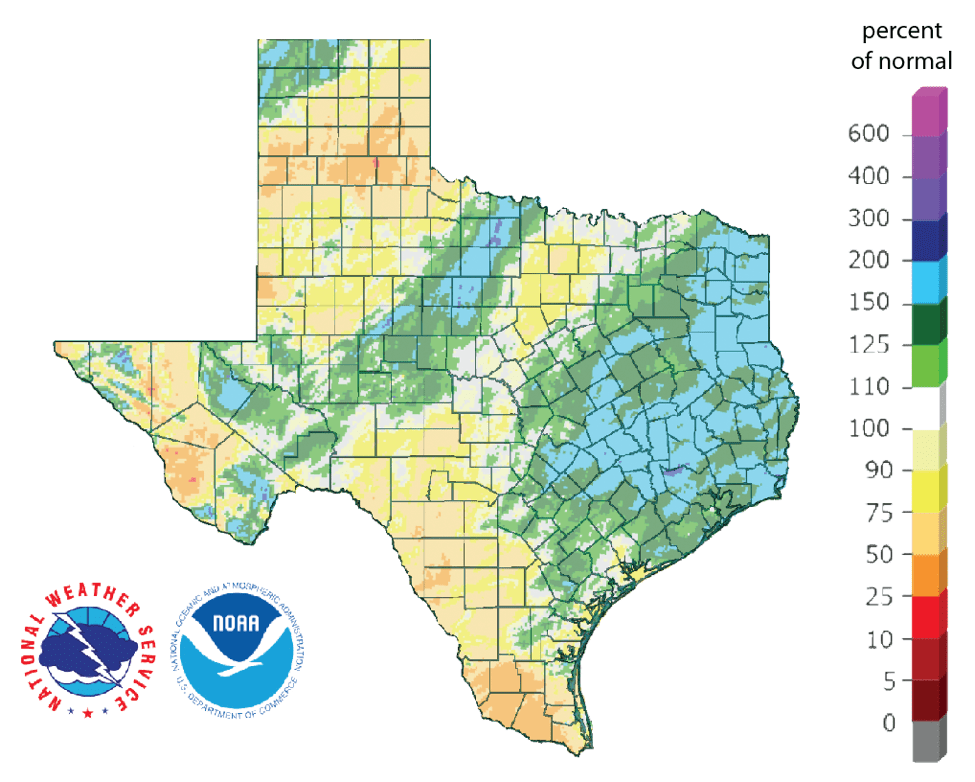
It was a heck of a water year in Texas with rainfalls reaching more than 100 inches in the south-east to a healthy 10 inches in Trans-Texas with blotches of less than 10 inches in the Salt Basin and patches of Big Bend (Figure 1a). Most of the state at least met normal rainfall levels with a sizable part getting 150 to 200 percent of normal (Figure 1b). But with Texas being Texas, we still had parts of the Panhandle and the Trans-Pecos receiving less than normal rainfall (Figure 1b).
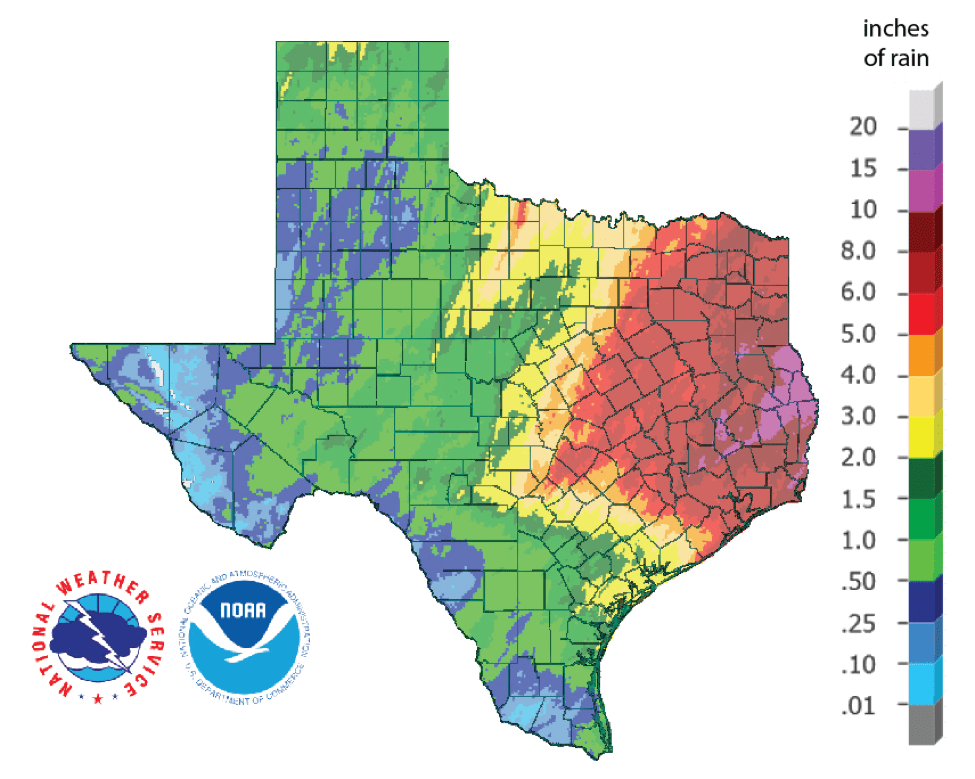
Statewide reservoir storage ended up well over normal at the end of year but many western reservoirs remain less than half full. Over the past 30 days, parts of East Texas received more than 10 inches of rain while large parts of the Trans-Pecos and the Lower Rio Grande Valley received less than half an inch of precipitation (Figure 1c).

The amount of drought in Texas (D1-D4) over the past month increased from 0.8 to 2.5 percent with patches of severe drought appearing in the Panhandle, the Trans-Pecos, and the Lower Rio Grande Valley (Figure 2a). Abnormally dry conditions expanded in Presidio County with freckles of these conditions appearing in South Texas (Figure 2b).
The 90-day rainfall as a percent of normal is starting to show deficits in large parts of the state in the High Plains, the Trans Pecos, and much of the Rio Grande Valley (Figure 3). Figure 3 shows the possible path for the expansion of drought if rains don’t come back soon (compare with Figure 2a).
The North American Drought Monitor for the end of November was not available due to the government shutdown (Figure 4a). Precipitation in the Rio Grande watershed in Colorado, the primary source of water for Elephant Butte Reservoir, has been less than 50 percent, and in many areas less than 25 percent, of normal precipitation over the past 90 days (Figure 4b).
![Figure 4a: The North American Drought Monitor for [sorry: not available at this time] (source).](https://texaspluswater.wp.txstate.edu/files/2019/01/figure4a.png)

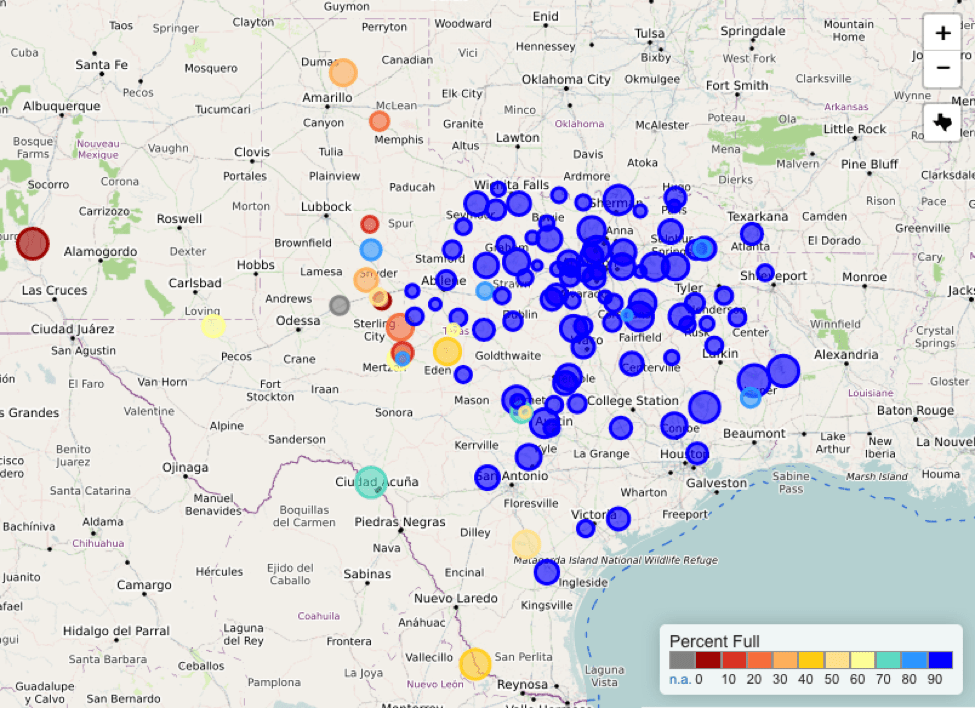
Statewide reservoir storage has been about 90 percent full since mid-November and is about 8 percentage points above normal for this time of year (Figure 5a). Percent full status for individual reservoirs this month (Figure 5b) is about the same as last month (Figure 5c).
Despite sea surface temperatures achieving El Niño levels (Figure 6; anything above 0.5 degrees meets the temperature requirement), we remain under an El Niño Watch. The reason is that in addition to achieving temperatures above 0.5 degrees Celsius in that special patch of the Pacific, the El Niño designation also requires a clear coupling with the atmosphere. In other words, those warm waters need to start affecting the atmosphere, and we aren’t there yet. Since sea-surface temperatures are expected to fall in the coming months and the connection to atmosphere becomes less likely, the chance of El Niño has decreased from 90 percent last month to ~65 percent this month. El Niños generally result in wetter-than-normal and cooler-than-normal conditions for Texas and act as a tropical storm suppressor.
The U.S. Seasonal Drought Outlook through April 30, 2019, suggests drought improvements in southern Colorado, something that would be welcome for Elephant Butte Reservoir, and drought removal for Texas (Figure 7).

Author

Robert Mace,
Deputy Executive Director & Chief Water Policy Officer at The Meadows Center for Water and the Environment
Robert Mace is a Professor of Practice in the Department of Geography at Texas State University. Robert has over 30 years of experience in hydrology, hydrogeology, stakeholder processes, and water policy, mostly in Texas.