SUMMARY:
-
Much of the state saw less than normal rainfall over the past month.
-
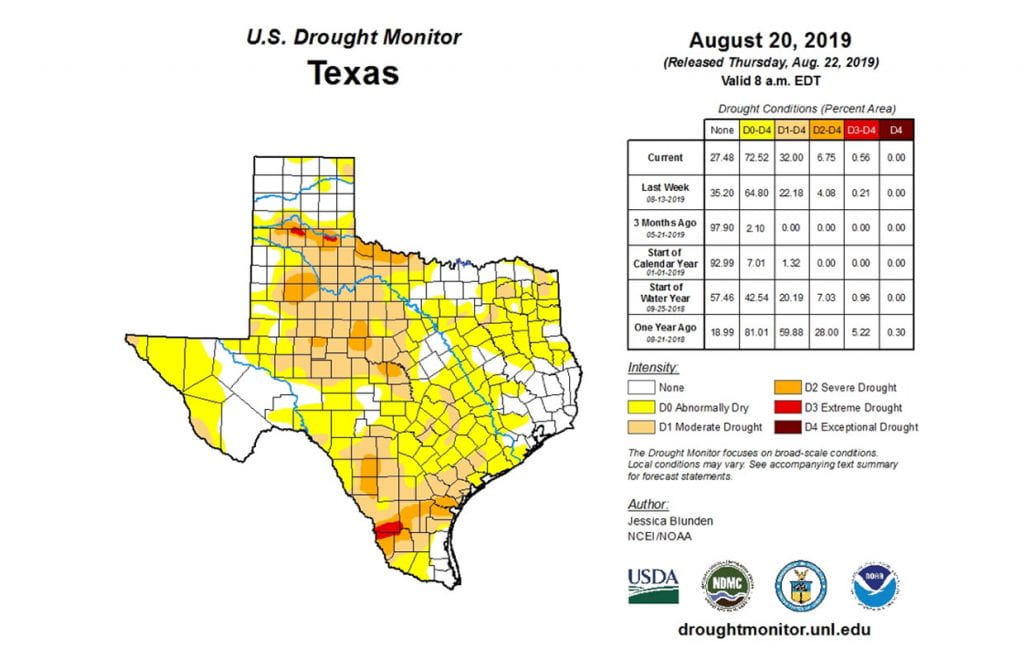
The state went from less than 7% either abnormally dry or in drought on July 16 to more than 72% on August 20.
-
Statewide reservoir storage remains above normal.
-
El Niño has fizzled with La Nada conditions projected through the winter.
-
The drought is expected to persist across the state and expand in South Texas.
At the end of July, I attended the Second National Drought Forum in Washington, D.C. held by the National Integrated Drought Information System. Ironically, Texas—and the country—only had a splotch of drought at the time. Also, ironically, there was quite a bit of discussion on not being able to predict drought very well with one scientist noting that seasonal drought forecasters only have a 6.6% success rate in predicting drought development (for example, our current flash drought was not foreseen at all). As was noted multiple times, it’s difficult to predict precipitation out more than two weeks. Sadly, there’s little investment in making predictions on seasonal and sub-seasonal time scales. As one presenter noted:
“Floods kill people; droughts kill civilizations. Why don’t we dedicate more resources to drought?”
Good question.
Speaking of drought, Texas suddenly finds itself in the middle of one with temperatures 6 to 10°F higher than average and minimal rainfall. Galveston had never seen a minimum temperature above 85°F since record keeping started in 1874, but that record fell three times in August. The Governor issued a disaster declaration in Duval, Hall, Jim Hogg, Randall, Swisher, Webb, and Zapata counties due to drought conditions and associated wildfire risks.
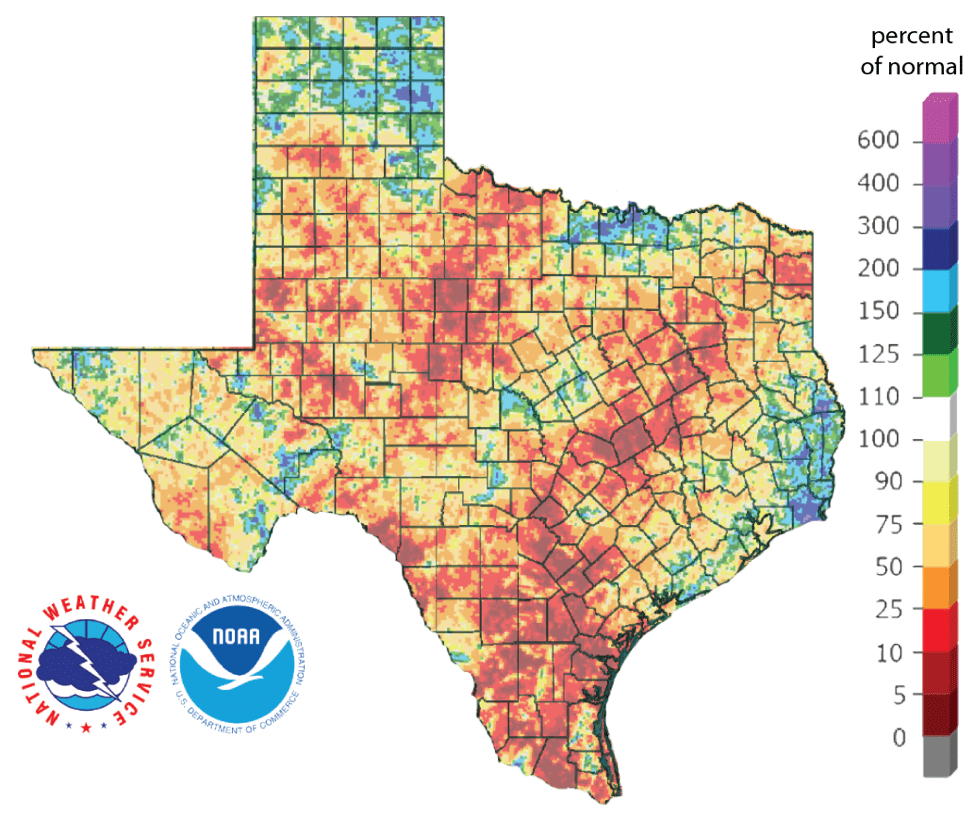
Much of the Panhandle received more than 2 inches of rain over the past 30 days while the southeast corner of the state received 5 to more than 10 inches of rain; however, much of the rest of state received less than 2 inches with South Texas and much of Central Texas, West Texas, and the Rio Grande Valley receiving less than a quarter inch (Figure 1a). Sizable parts of the state received less than 10% of normal rainfall over the past four weeks (Figure 1b). Looking over the past 90 days, parts of South and West Texas have received less than 50% of normal rainfall with an area centered on southern Webb County receiving less than 25% of normal rainfall (Figure 1c). In general, percent-of-normal precipitation for the past 90 days correlates well with the Drought Monitor and can be used to discern areas going into (or out of) drought.


Drought-wise, the state really went to hell over the past month, going from less than 7% of the state either abnormally dry or in drought on July 16 to more than 72% on August 20 (Figure 2a). In addition to drought conditions worsening in South Texas, drought appeared across the state from El Paso to Big Bend to much of West Texas, parts of Central Texas, and even parts of Northeast Texas (Figure 2b). Extreme drought conditions are now impacting southern Webb County and a couple areas near Amarillo along the Prairie Dog Town Fork of the Red River (Figure 2b).


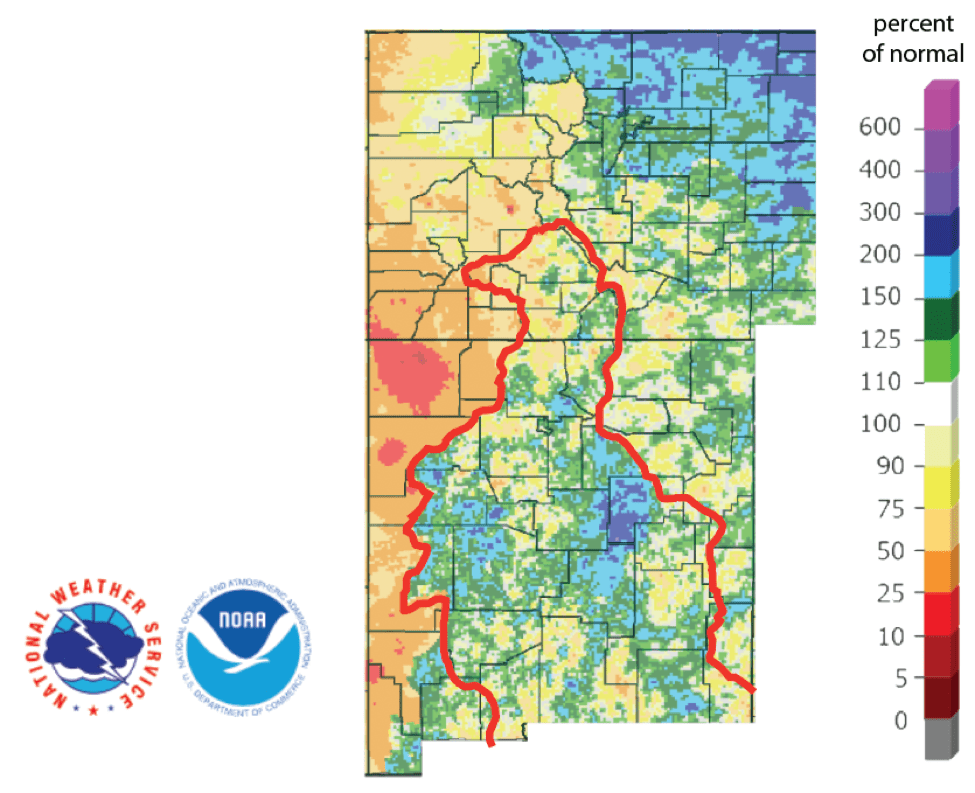
The North American Drought Monitor for the end of July continues to show short-term drought in Texas with long-term drought in northwestern New Mexico near the headwaters of the Rio Grande (Figure 3a); however, this map misses the development of the flash drought over the past four weeks. Percent of normal precipitation in the Rio Grande watershed in Colorado, the primary source of water for Elephant Butte Reservoir, over the last 90 days shows less than normal rainfall; however, much of the basin in New Mexico has benefited from greater-than-normal rainfall (Figure 3b).


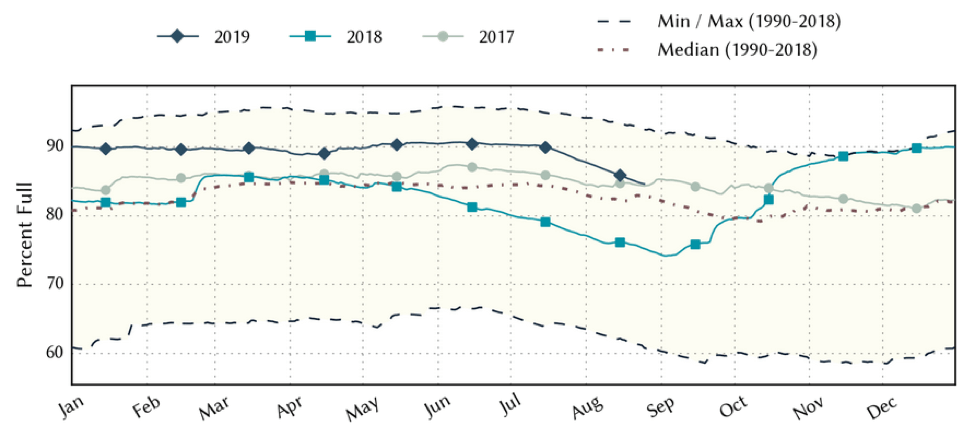
Statewide reservoir storage sharply decreased about 5 percentage points over the past month but remains about 2 percentage points above normal for this time of year (Figure 4a). Percent full status for individual reservoirs this month (Figure 4b) shows a number of reservoirs across the state declining in storage, although most of the reservoirs in the eastern half of the state remain at least 80 percent full. B. A. Steinhagen Lake in East Texas was drained for dam repairs, which is why it appears as less than 10% full on the map (Figure 4b). Similarly, lake operators dropped lake levels in Toledo Bend to work on the spillway (Figure 4c).


We are still under an El Niño Advisory; however, the Climate Prediction Center notes that El Niño has transitioned to neutral (La Nada) conditions and is likely (50 to 55 percent chance) to remain neutral through the winter (Figure 5).

The U.S. Seasonal Drought Outlook through November 30, 2019, projects that current drought conditions will persist with drought conditions expanding in South Texas (Figure 6).

Author
 Robert Mace,
Interim Executive Director & Chief Water Policy Officer at The Meadows Center for Water and the Environment
Robert Mace is a Professor of Practice in the Department of Geography at Texas State University. Robert has over 30 years of experience in hydrology, hydrogeology, stakeholder processes, and water policy, mostly in Texas.

