SUMMARY:
- Rains continued to dampen drought across much of the state.
- Statewide reservoir storage is back up to normal (since 1990) conditions.
- Three-month projections suggest warmer-than-normal conditions in the western half of the state and wetter-than-normal conditions in the eastern half of the state.
I wrote this article on June 27, 2021.
A couple-few months ago, I wrote about NOAA recalculating “normal” for hurricanes. NOAA has also recalculated normal for temperature and precipitation for the country. Compared to the overall average, temperature has been getting warmer (Figure 1a) and precipitation has been growing except for in the Southwest (Figure 1b). For Texas, temperatures are rising across the state but rising the fastest in West and Far West Texas and along the Gulf Coast (Figure 1c). Average rainfall in Texas is increasing as much as an inch per decade in the eastern part of the state (Figure 1d). Compared to the previous 30-year period (1981 to 2010), the new normals (1991 to 2020) are as much as one degree warmer (Figure 1e) and precipitation as much as 10 percent less in Far West Texas (Figure 1f).
The Austin-San Antonio National Weather Service noted that for Central Texas, the number of days with measurable precipitation stayed the same or decreased but that totals increased, suggesting increased drought risk and increased risk for flash floods. The local National Weather Service folks found that the annual number of 100-degree days increased by six days at Austin-Bergstrom International Airport and San Antonio, 11 days at Austin Camp Mabry, and 13 days at Del Rio.

Figure 1a: Annual U.S. temperature compared to the 20th-century average for each U.S. Climate Normals period from 1901-1930 to 1991-2020 (source).
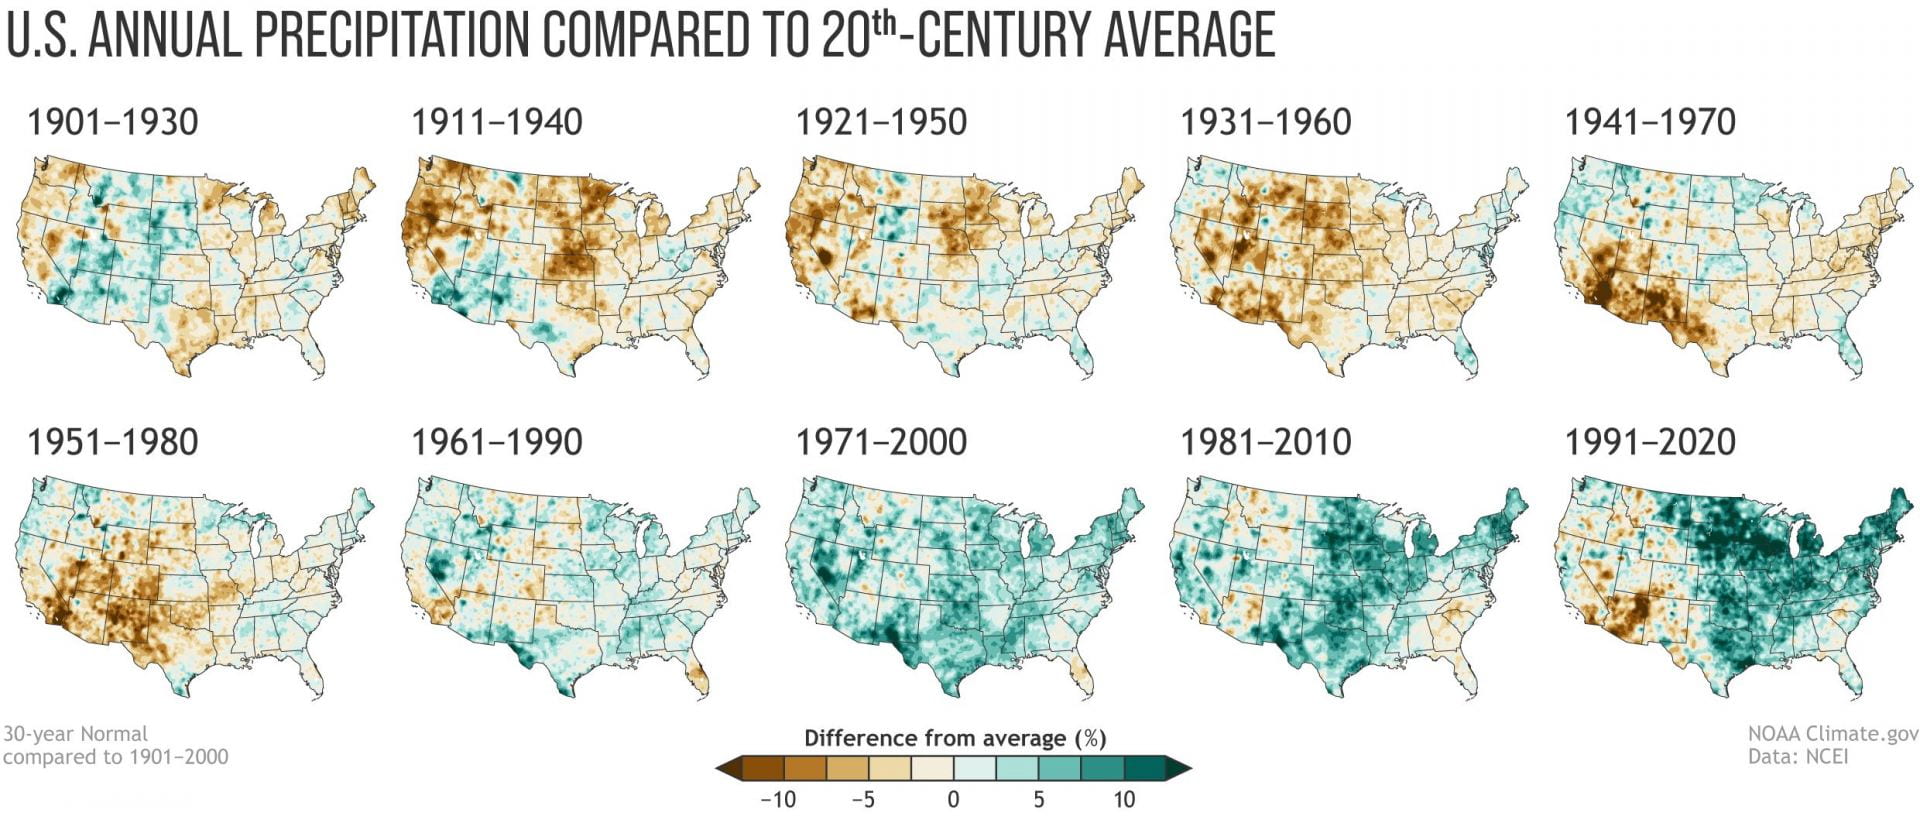
Figure 1b: Normal annual U.S. precipitation as a percent of the 20th-century average for each U.S. Climate Normals period from 1901-1930 to 1991-2020 (source).

Figure 1c: Average annual mean temperature trends between 1895 and 2020 (source).
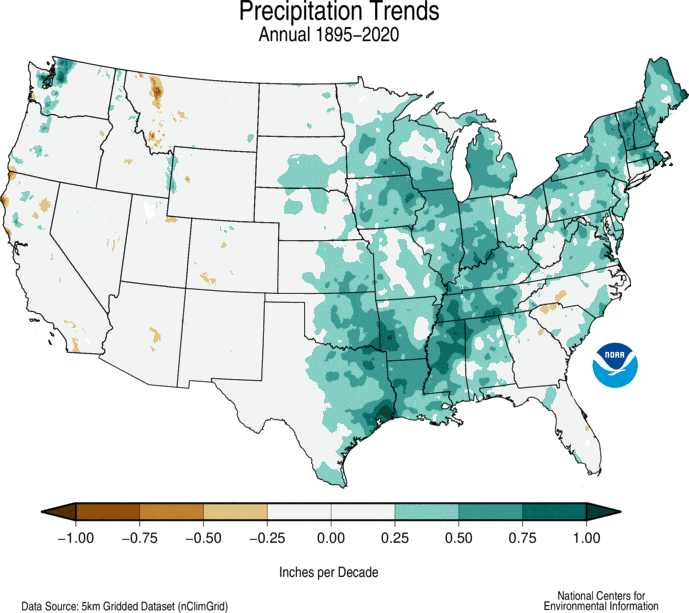
Figure 1d: Average annual precipitation trends per decade between 1895 and 2020 (source).
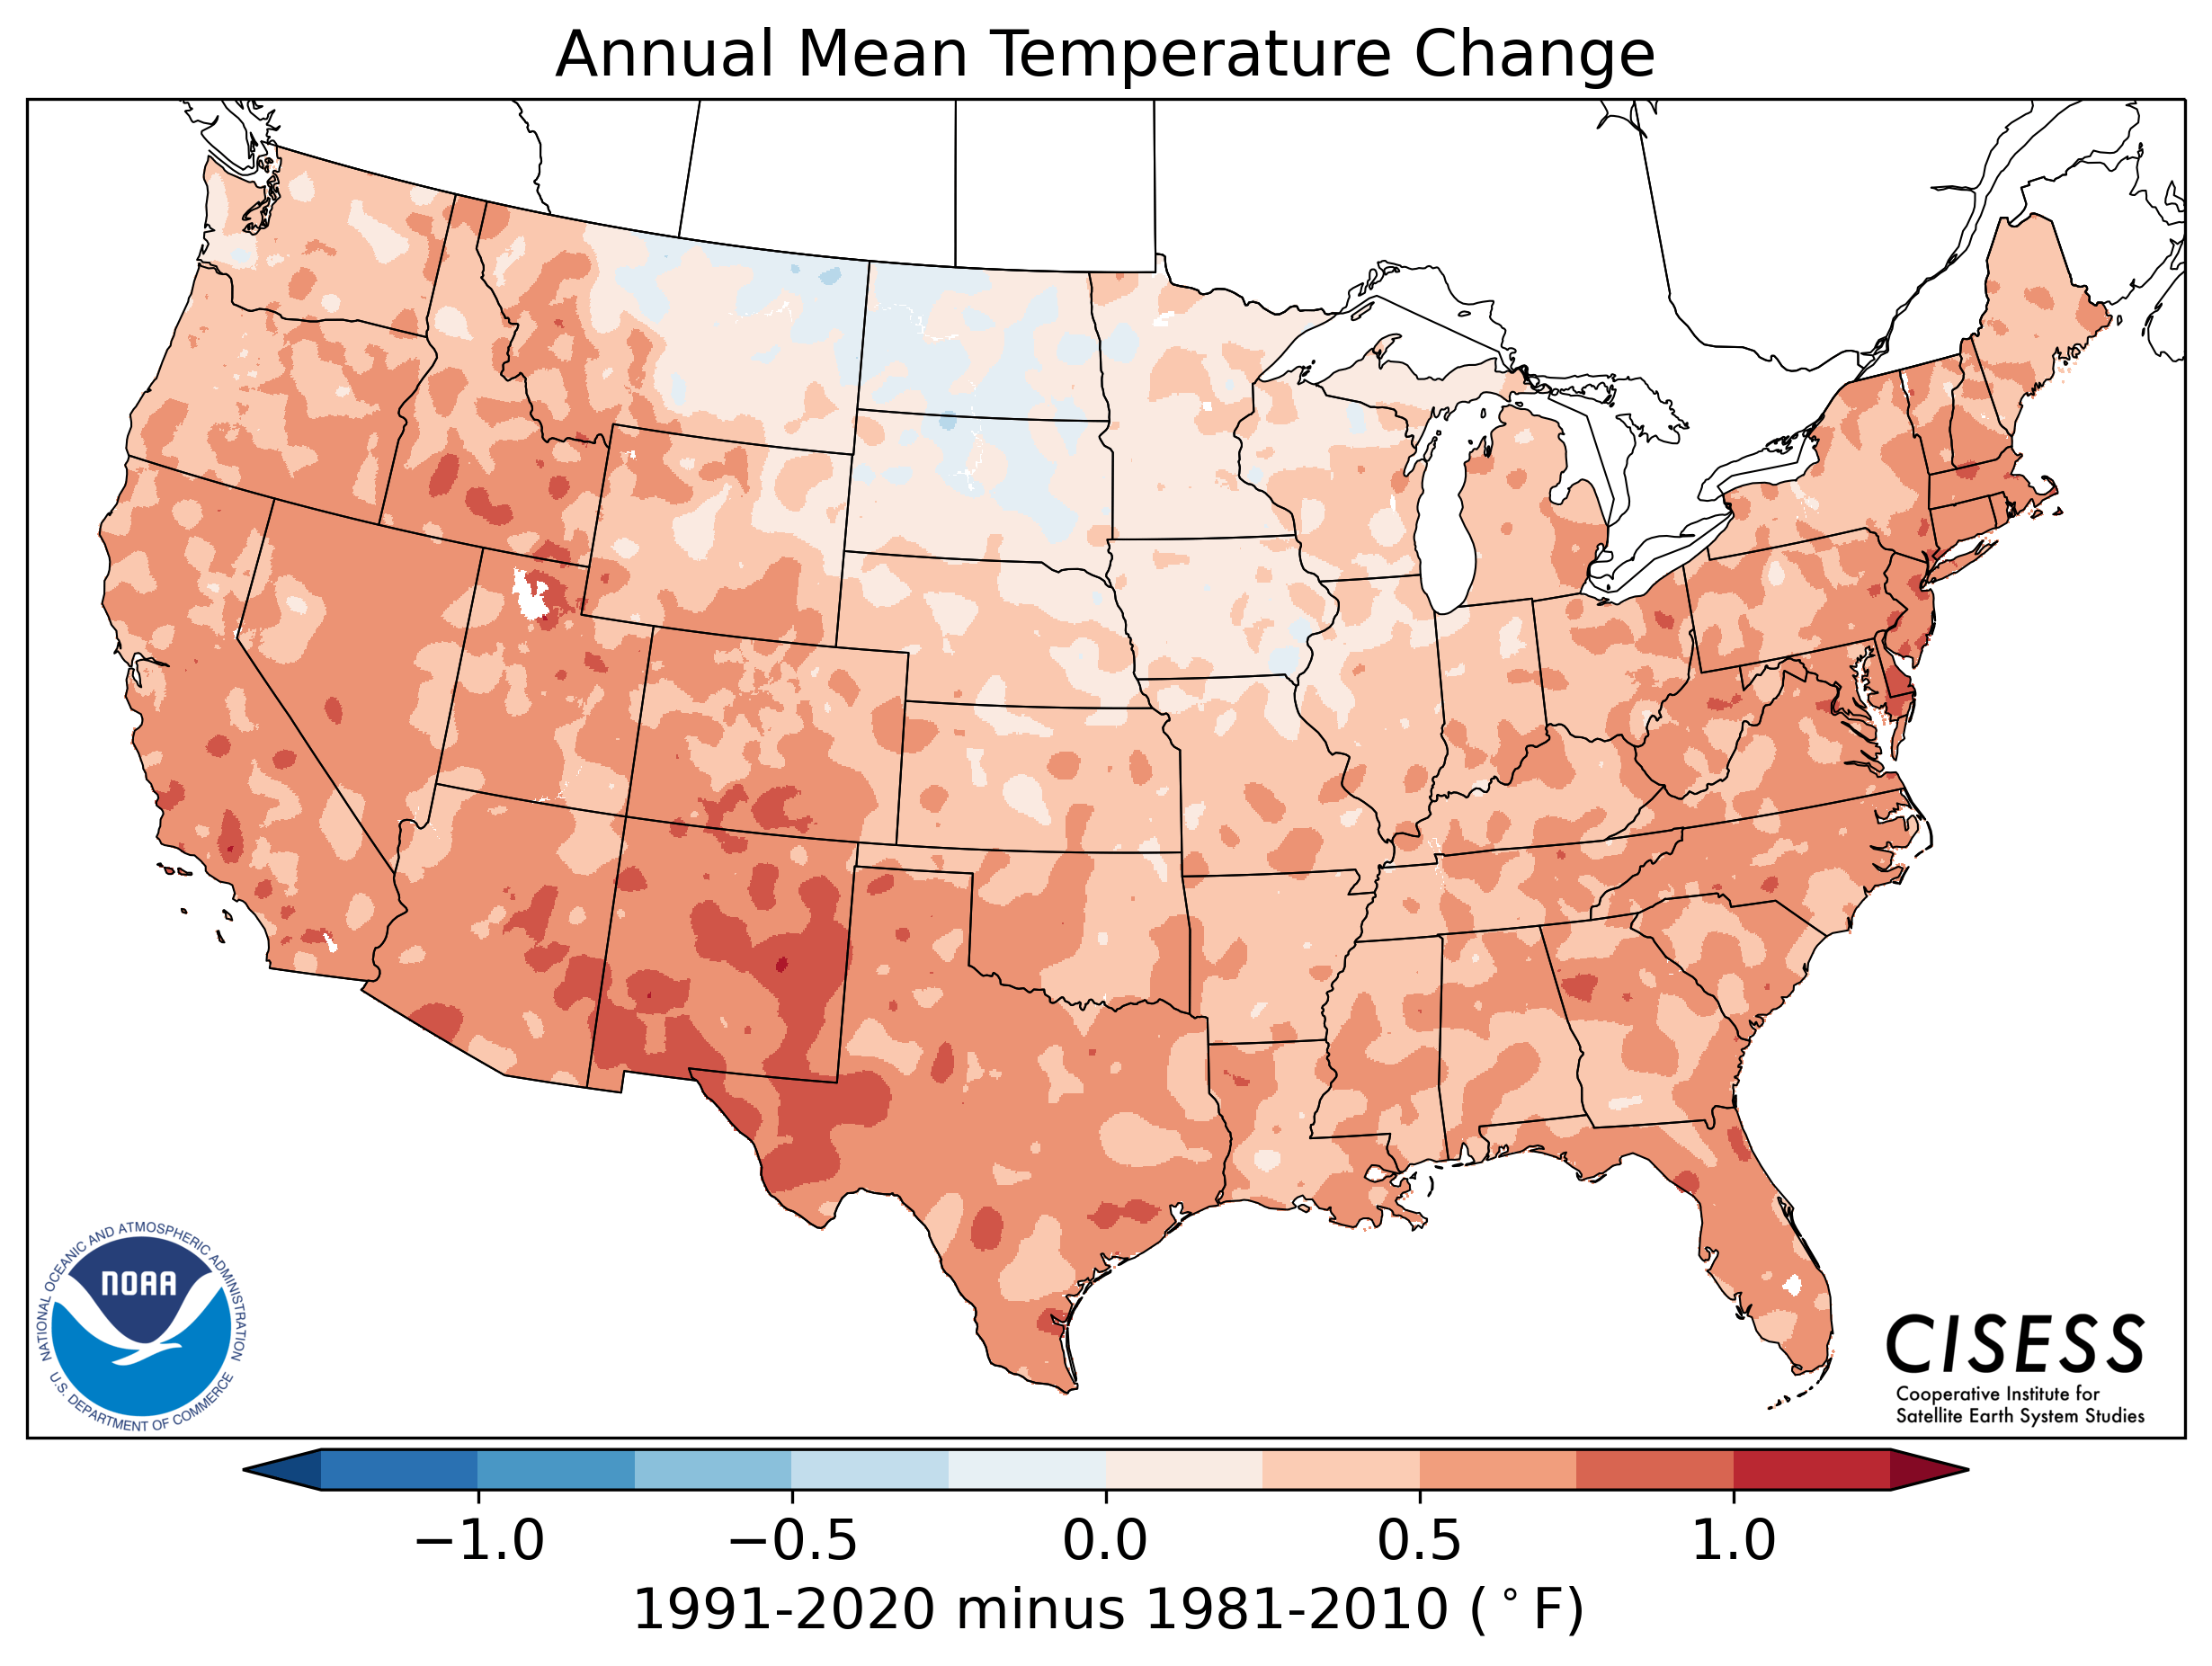
Figure 1e: Change in mean annual precipitation from 1981-2010 to 1991-2020 (source).
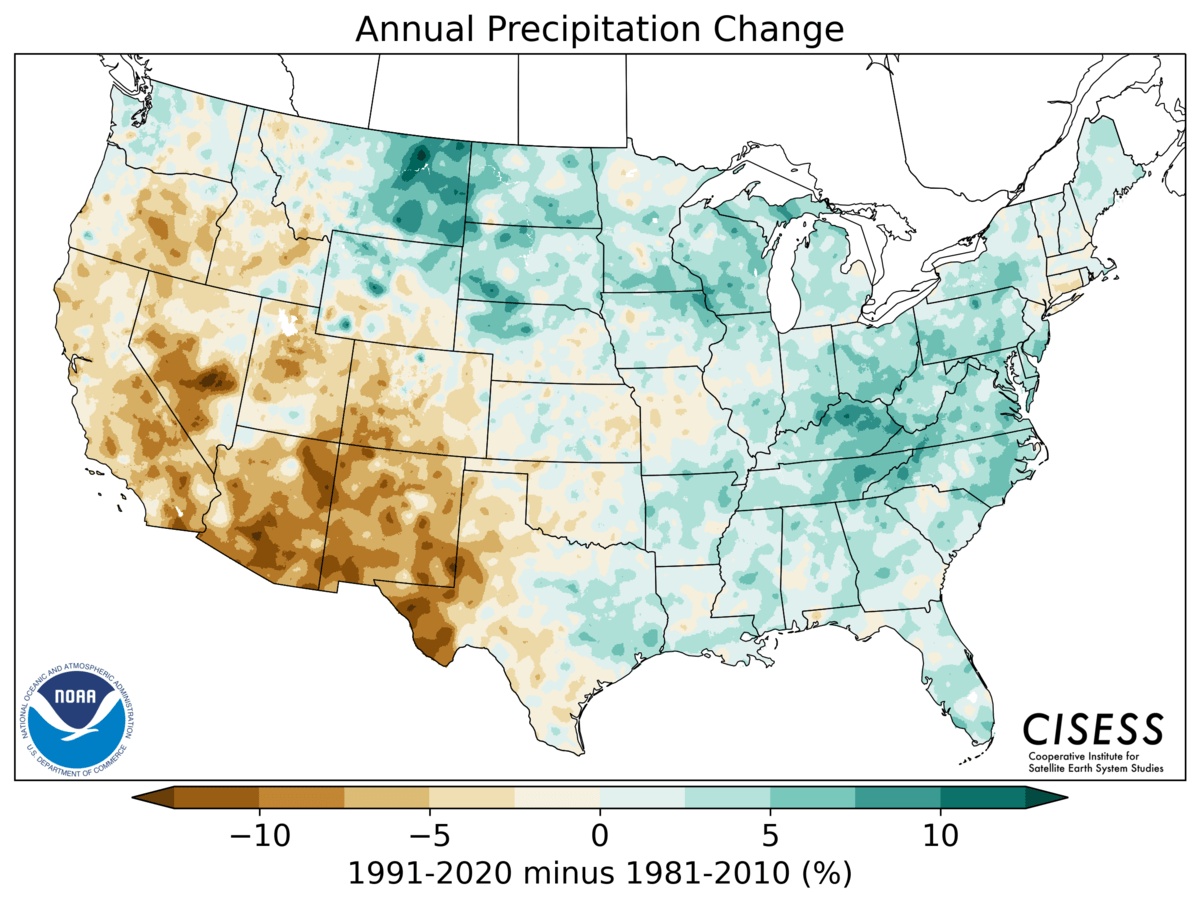
Figure 1f: Change in mean annual precipitation from 1981-2010 to 1991-2020 (source).
Although not as much as last month, the eastern half of the state and parts of the High Plains received six or more inches of rain over the past 28 days (Figure 2a). Only Far West Texas received less than half an inch of rain (Figure 2a). About two-fifths of the state got more than its average amount of rain over the past 28 days with some areas getting two to three times more, with much of Far West Texas receiving less than 25 percent less than normal (Figure 2b). Rain over the past 90 days is much less than normal in Far West Texas (Figure 2c).
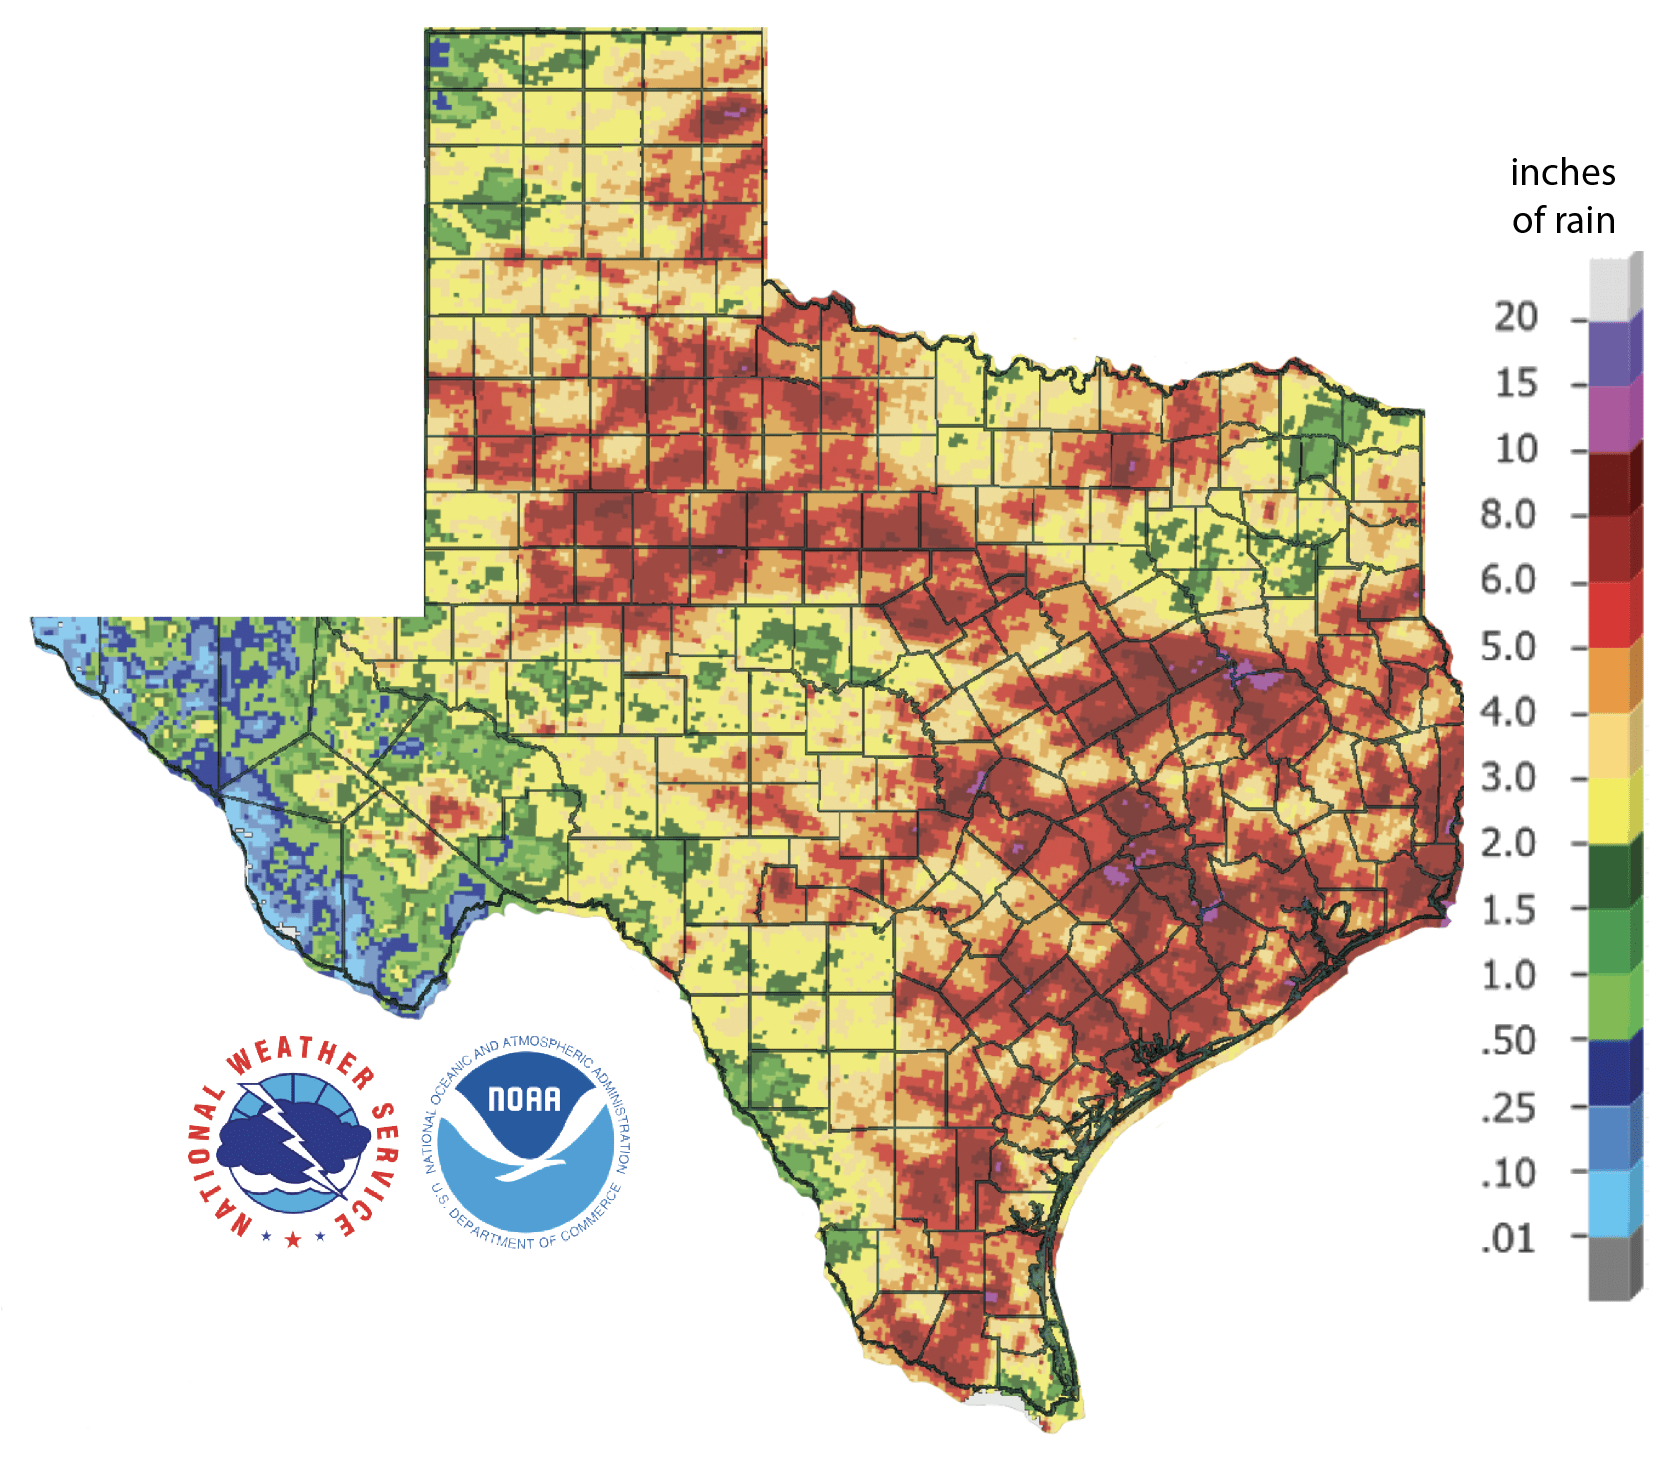
Figure 2a: Inches of precipitation that fell in Texas in the 30 days before June 27, 2021 (source). Note that cooler colors indicate lower values and warmer indicate higher values.

Figure 2b: Rainfall as a percent of normal for the 30 days before June 27, 2021 (source).

Figure 2c: Rainfall as a percent of normal for the 90 days before June 27, 2021 (source).
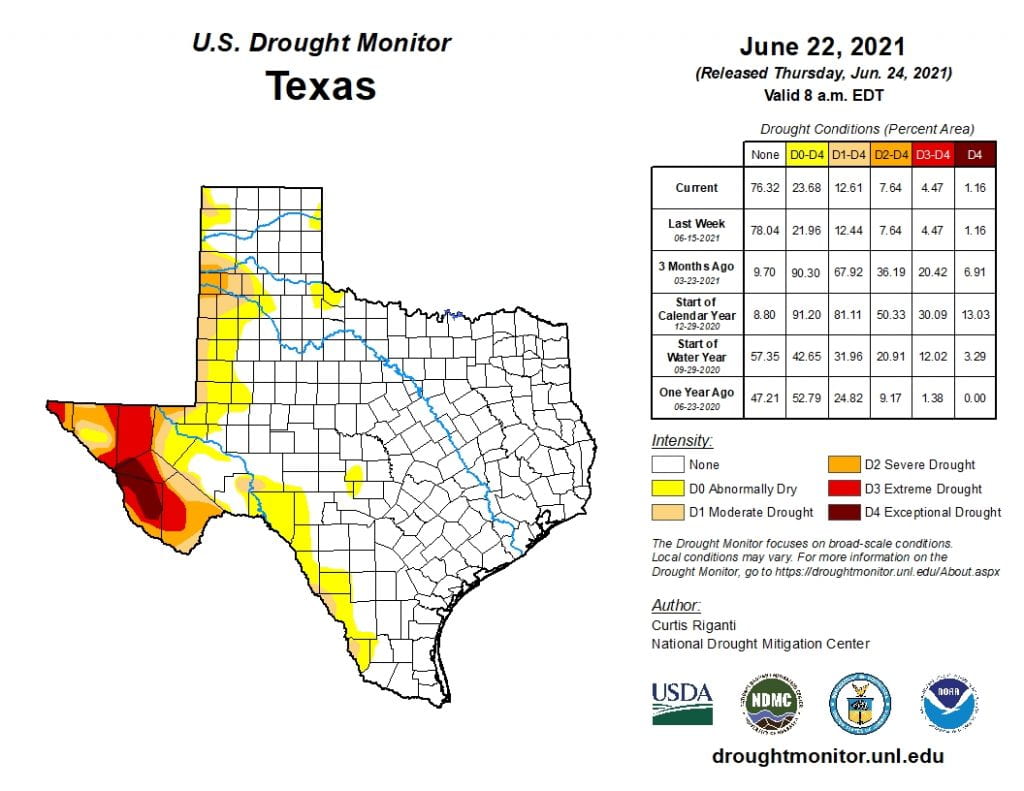
The amount of the state under drought conditions (D1–D4) decreased from 33.0 percent four weeks ago to 12.6 percent at present (Figure 3a), with drought and dry conditions fading away over much of the eastern two-thirds of the state (Figure 3b). Exceptional drought, the most intense drought category, remained focused on Far West Texas, decreasing from 5.9 percent of the state four weeks ago to 1.2 percent at present (Figure 3a). The rains knocked extreme drought in the Lower Rio Grande Valley down to moderate drought (Figure 3a). In all, 23.7 percent of the state remains abnormally dry or worse (D0–D4; Figure 3a), down considerably from 47.8 percent four weeks ago.

Figure 3a: Drought conditions in Texas according to the U.S. Drought Monitor (as of June 22, 2021; source).
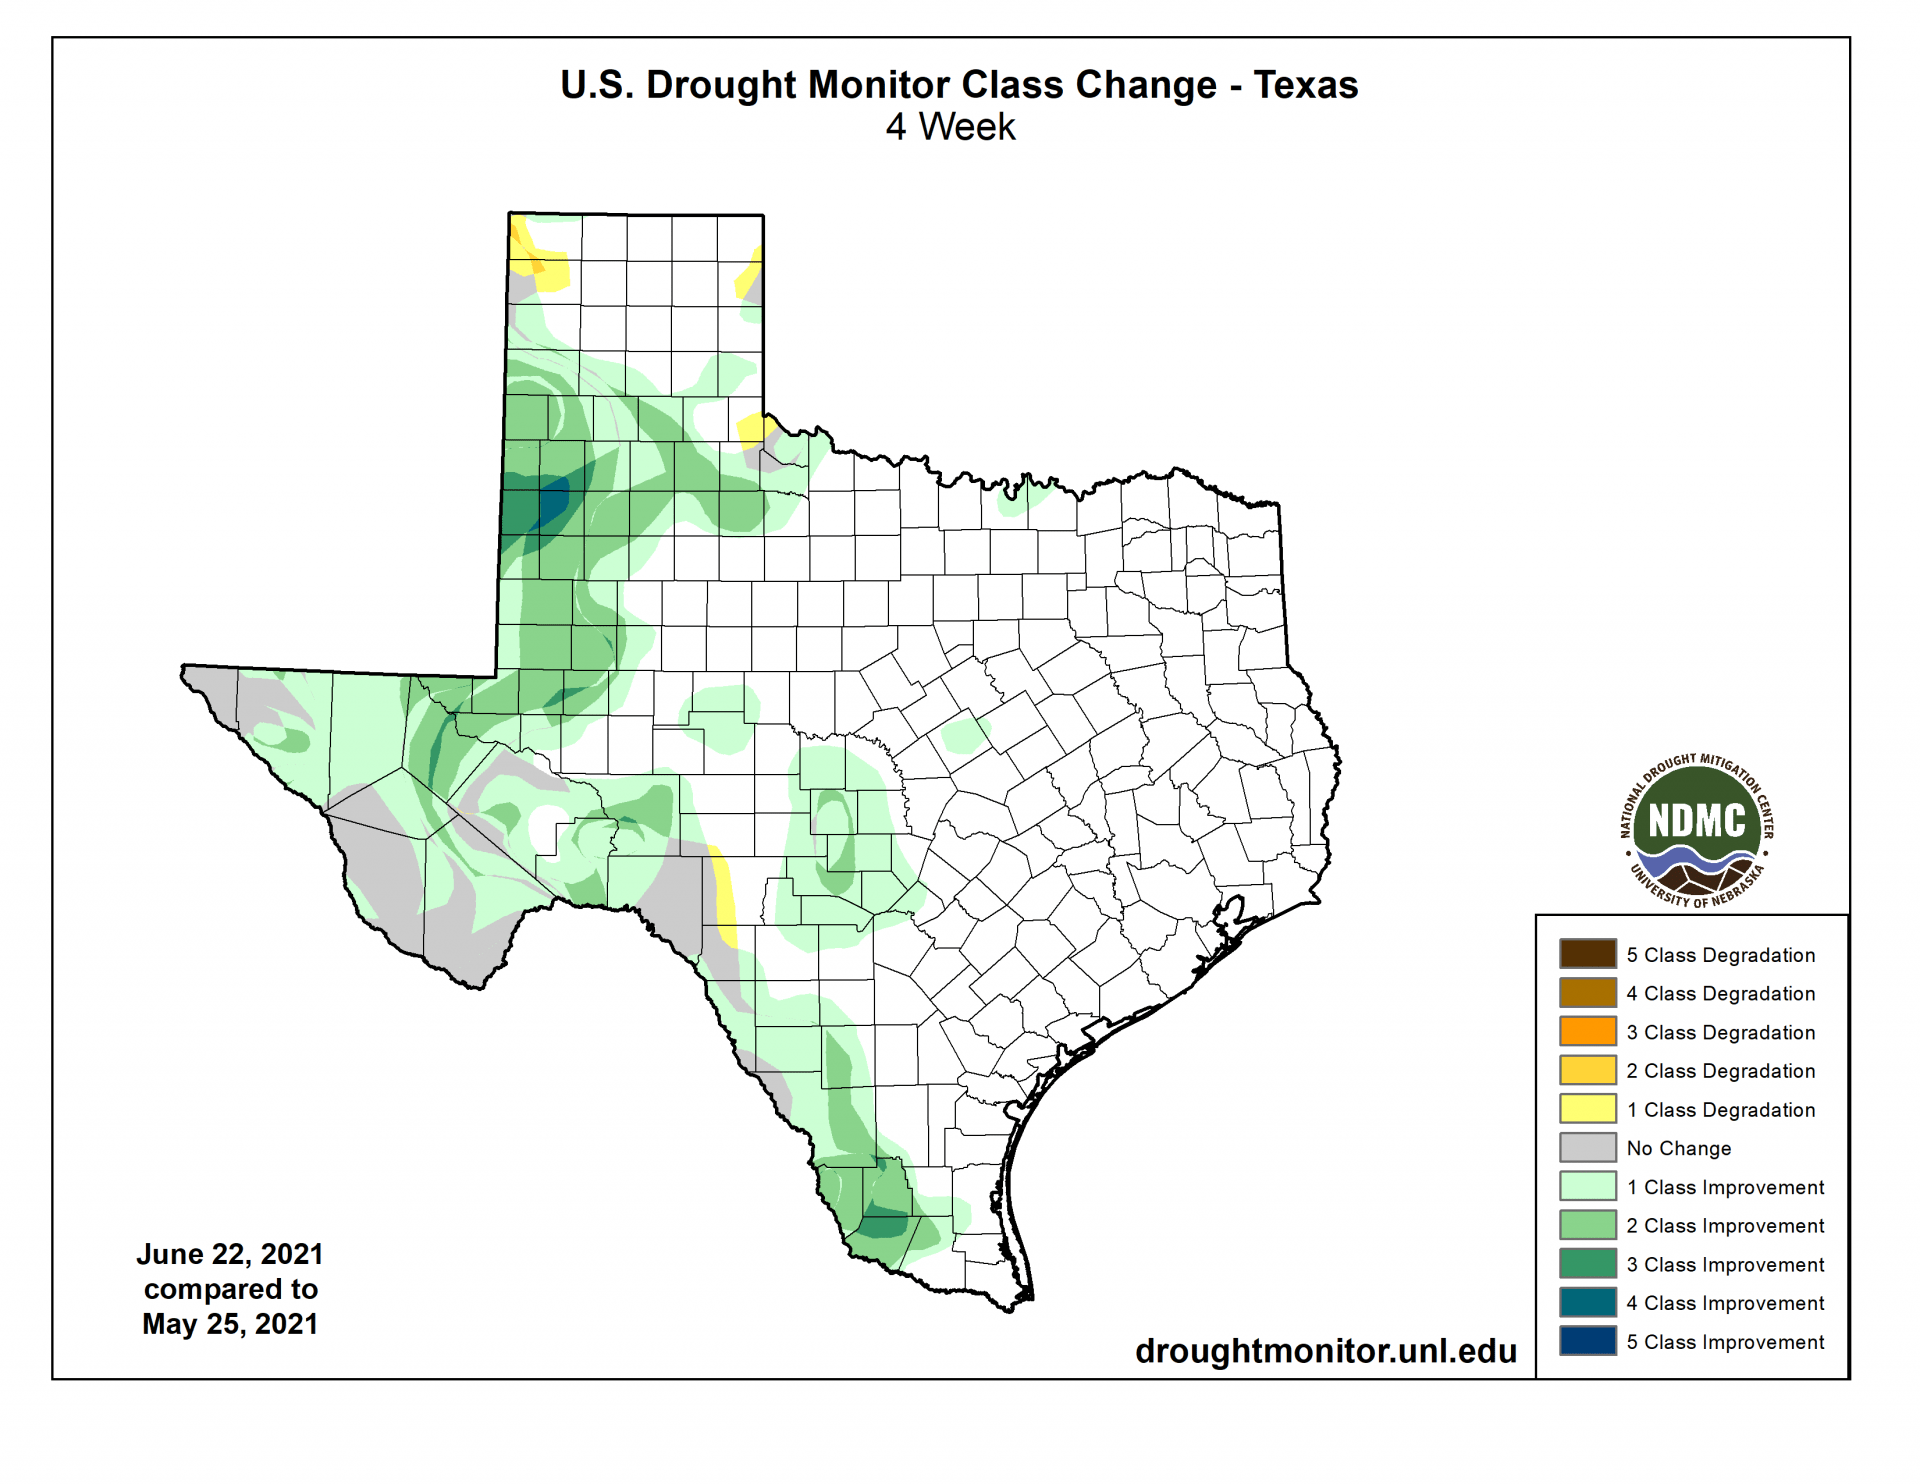
Figure 3b: Changes in the U.S. Drought Monitor for Texas between May 25, 2021, and June 22, 2021 (source).
The North American Drought Monitor, which runs a month behind reality, continues to show a raging drought in much of the western United States, with exceptional drought entrenched in the American Southwest (Figure 4a). Precipitation in most of the Rio Grande watershed in Colorado and New Mexico over the last 90 days continues to be predominantly less than normal, although parts of the headwaters in Colorado received more than normal (Figure 4b). Conservation storage in Elephant Butte Reservoir decreased from 12.5 percent full last month to 7.6 percent (Figure 4c), just above historic (since 1990) lows.
The Rio Conchos basin in Mexico, which confluences into the Rio Grande just above Presidio and is an important source of water to the lower part of the Rio Grande in Texas, is in moderate to severe drought conditions (Figure 4a). Combined conservation storage in Amistad and Falcon reservoirs remained the same as last month at 39.5 percent today, about 18 percentage points below normal for this time of year (Figure 4d).

Figure 4a: The North American Drought Monitor for May 31, 2021 (source).
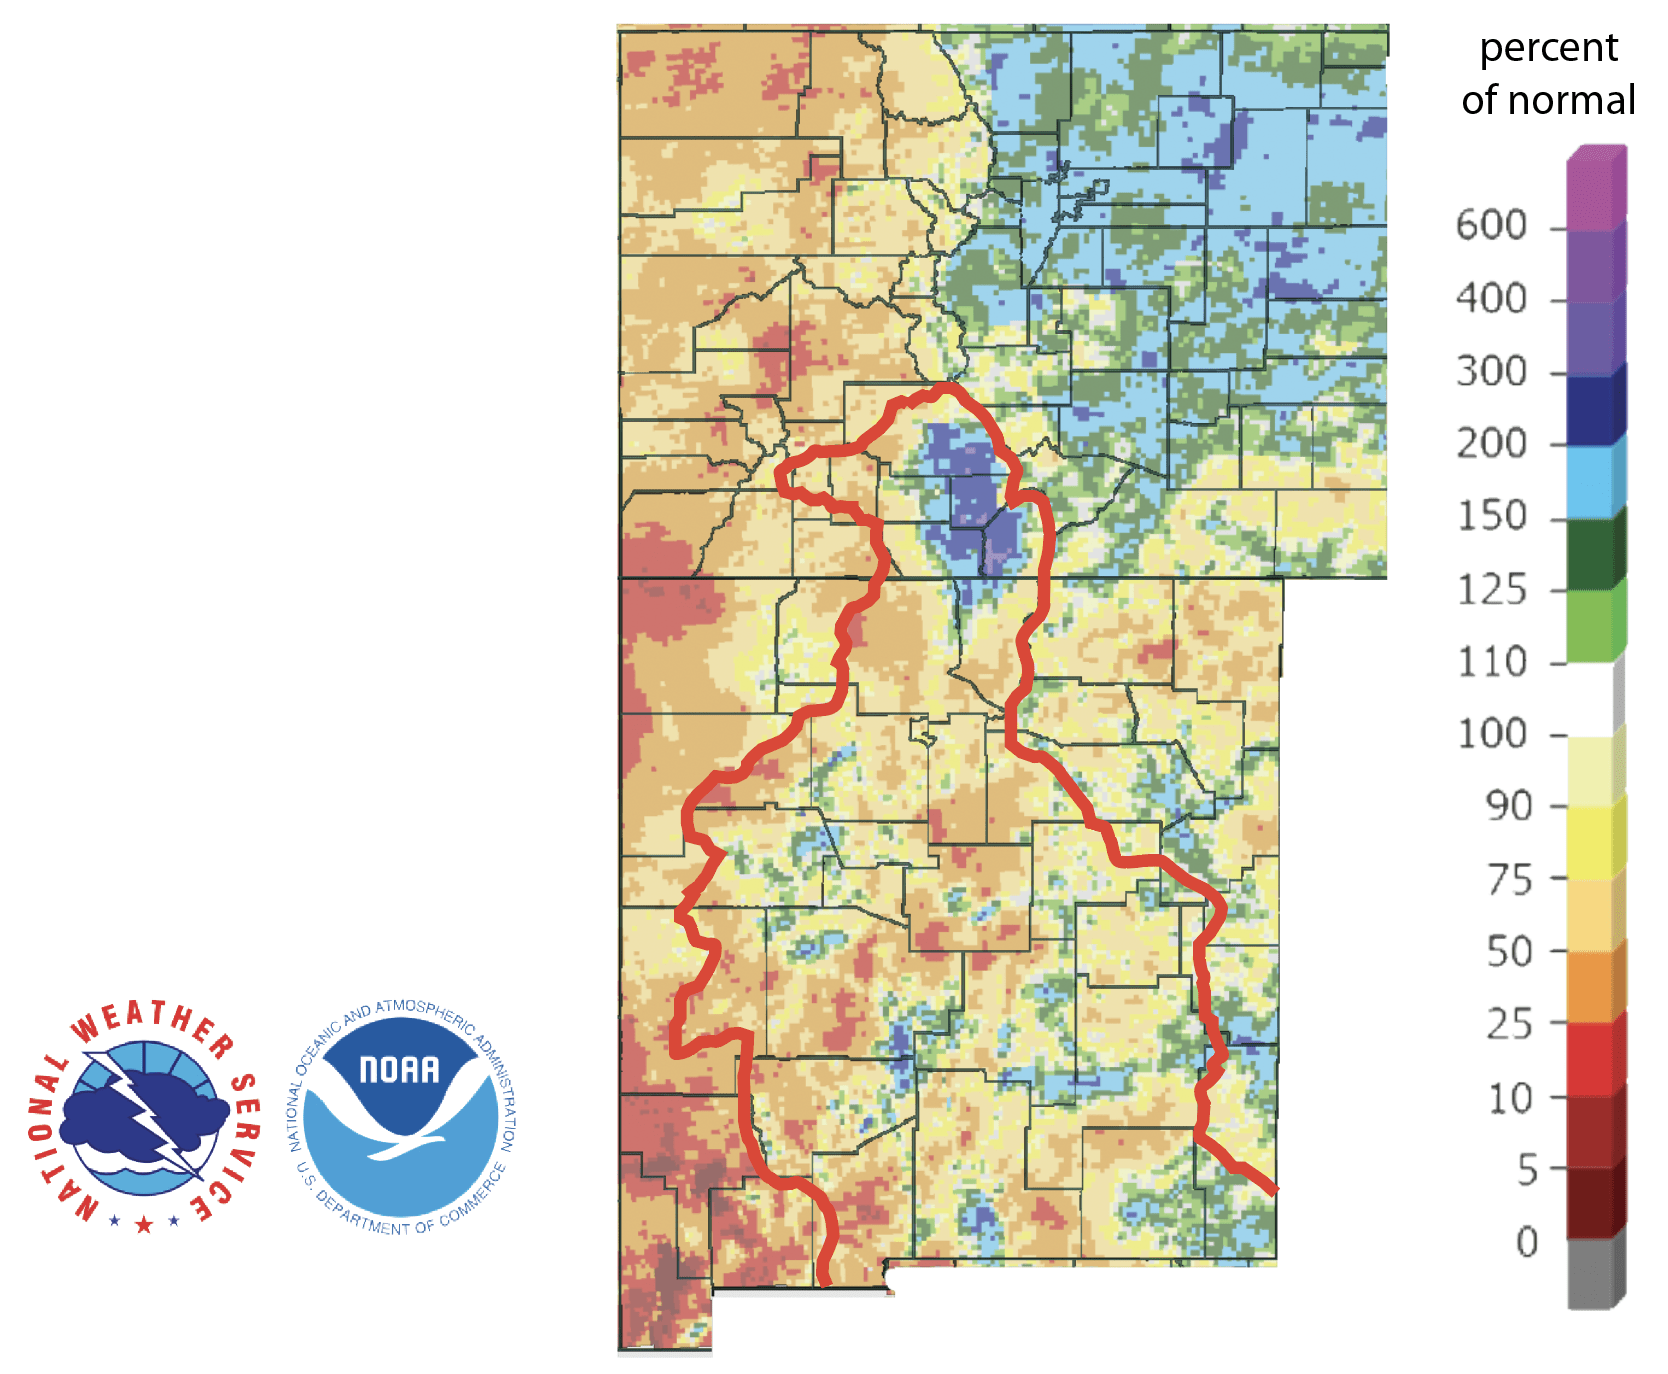
Figure 4b: Percent of normal precipitation for Colorado and New Mexico for the 90 days before June 27, 2021 (source). The red line is the Rio Grande Basin. I use this map to see check precipitation trends in the headwaters of the Rio Grande in southern Colorado, the main source of water to Elephant Butte Reservoir downstream.
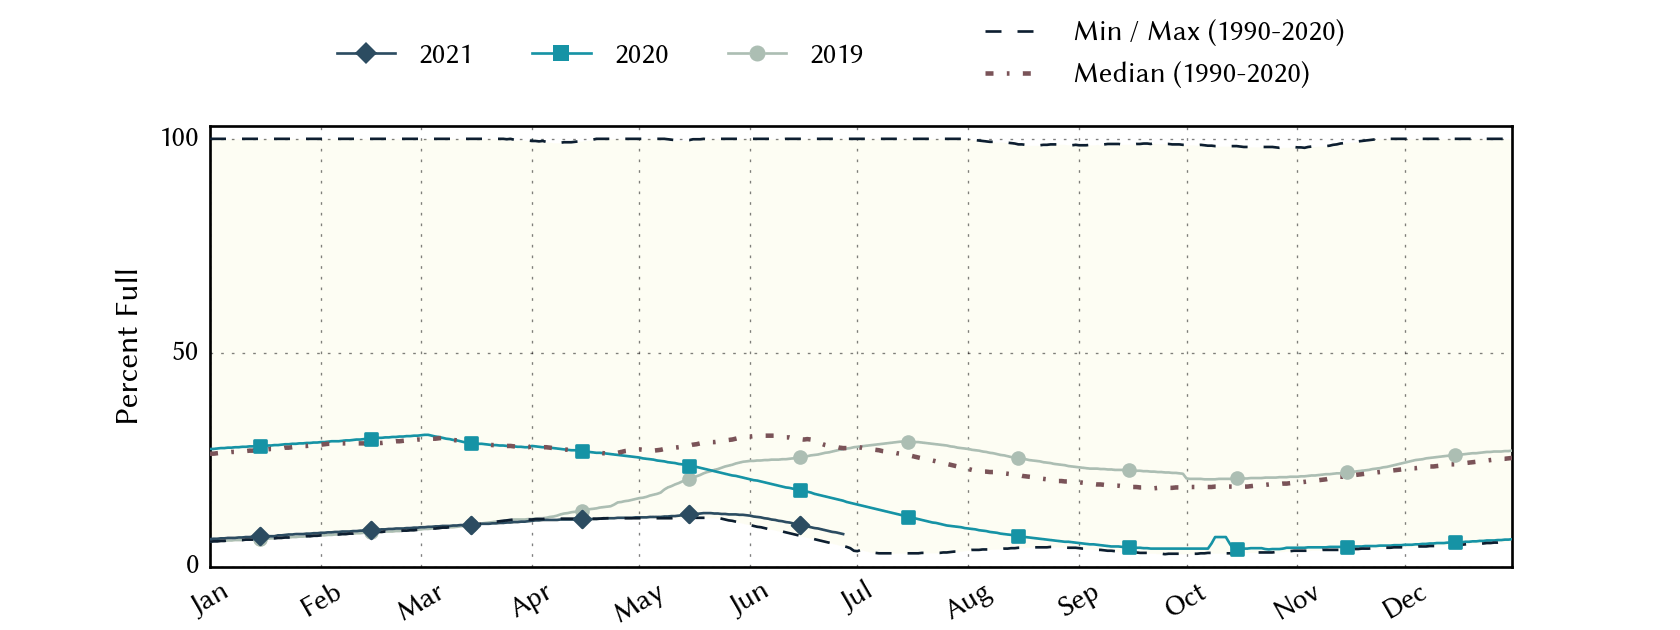
Figure 4c: Reservoir storage in Elephant Butte Reservoir since 2019 with the median, min, and max for measurements from 1990 through 2020 (source).
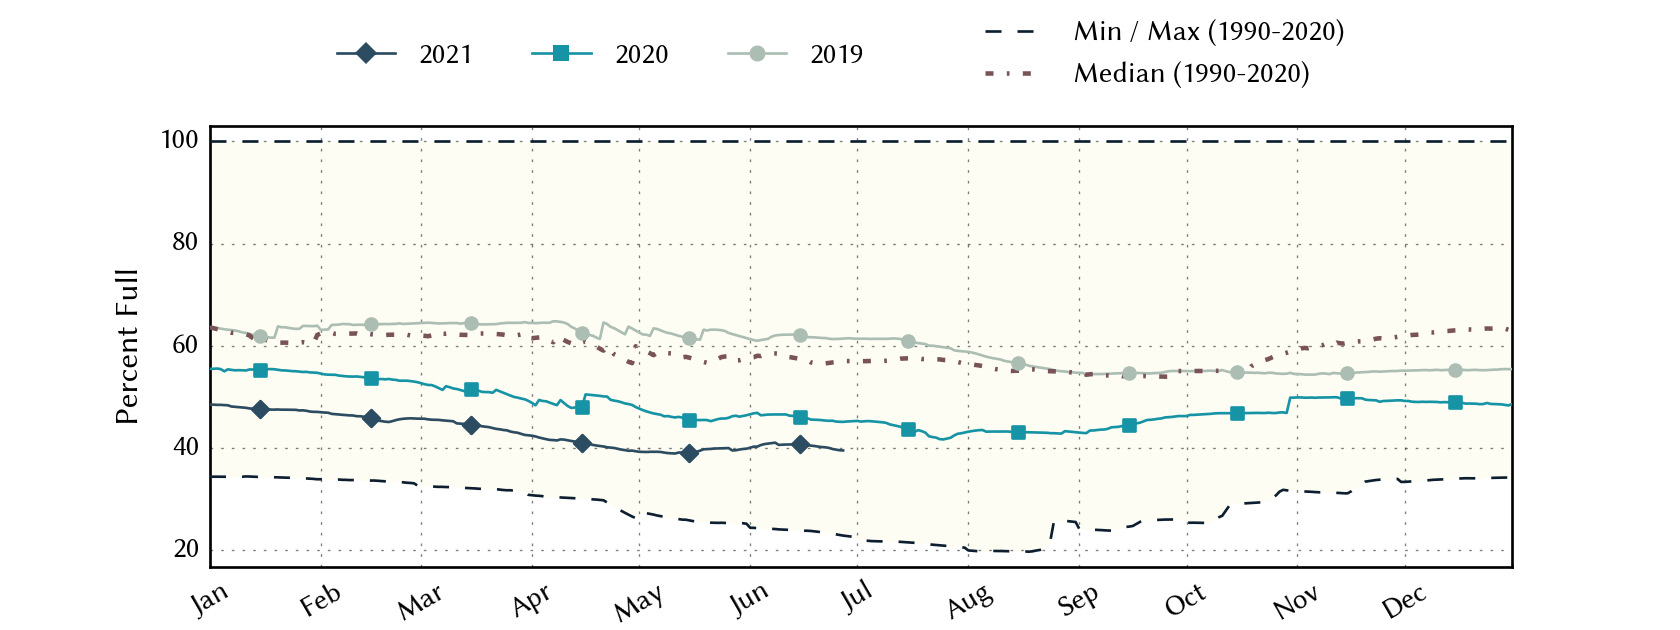
Figure 4d: Reservoir storage in Amistad and Falcon reservoirs since 2019 with the median, min, and max for measurements from 1990 through 2020 (source).
Recent rains alleviated low flows in many Texas basins, but there are still a half-dozen or so basins below the historical 25th percentiles (Figure 5a). Statewide reservoir storage is at 85.3 percent full as of today, up from 84.2 percent a month ago and at normal for this time of year (Figure 5b). Most reservoirs in the eastern part of the state are now above 90 percent full (Figure 5c).

Figure 5a: Parts of the state with below-normal seven-day average streamflow as of June 27, 2021 (source).

Figure 5b: Statewide reservoir storage since 2019 compared to statistics (median, min, and max) for statewide storage from 1990 through 2020 (source).
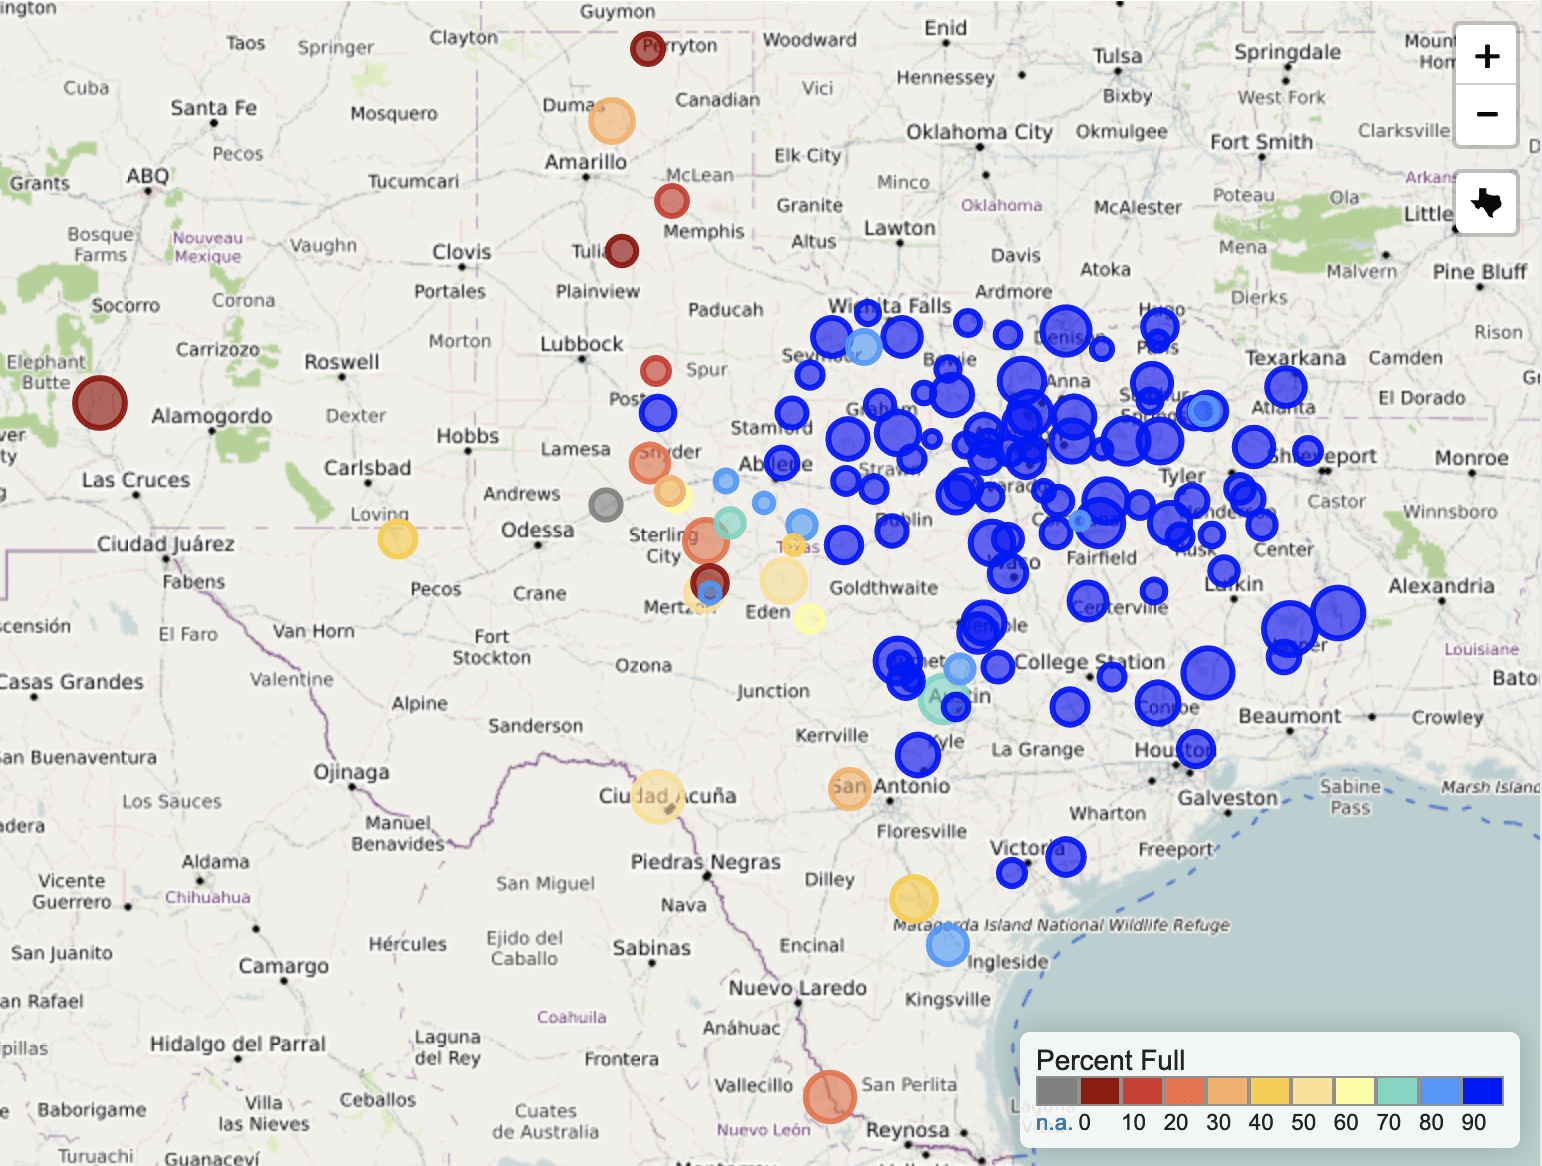
Figure 5c: Reservoir storage as June 27, 2021 in the major reservoirs of the state (source).
Sea-surface temperatures in the Central Pacific that, in part, define the status of the El Niño Southern Oscillation have continued their warming trend such that we remain in neutral (La Nada) conditions (Figure 6a). Projections of sea-surface temperatures remain above La Niña conditions through the summer with the possible return to La Niña conditions in early fall (Figure 6a). The jump in temperature projections in late fall and early winter appears to be an artifact reflecting uncertainty in projecting that far in the future. The Climate Prediction Center projects a 78 percent chance of neutral conditions holding through June–August and a 50 percent chance through September–November (Figure 6b).
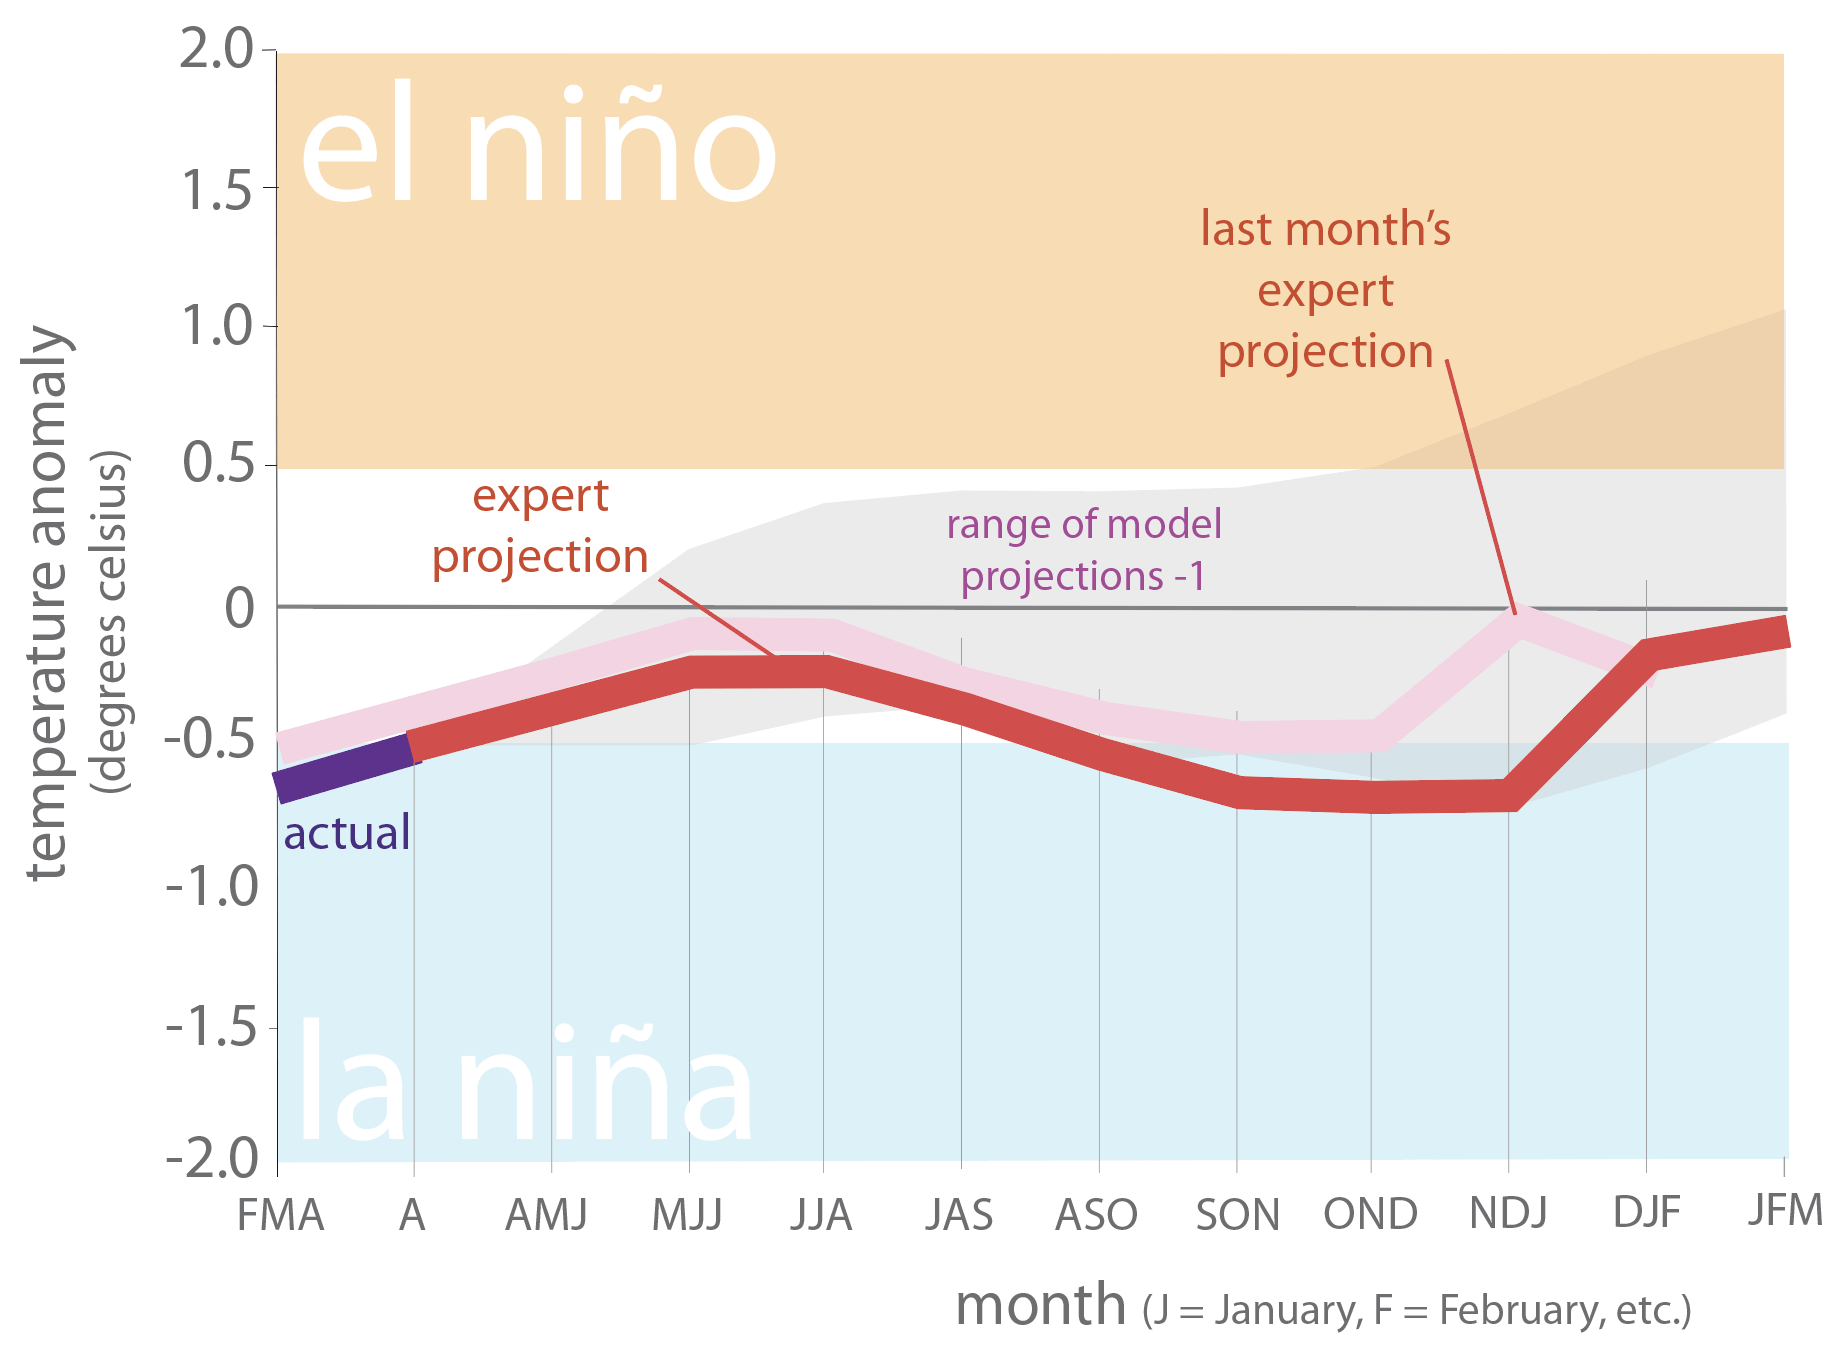
Figure 6a. Forecasts of sea-surface temperature anomalies for the Niño 3.4 Region as of May 19, 2021 (modified from source). “Range of model predictions -1” is the range of the various statistical and dynamical models’ projections minus the most outlying upper and lower projections.
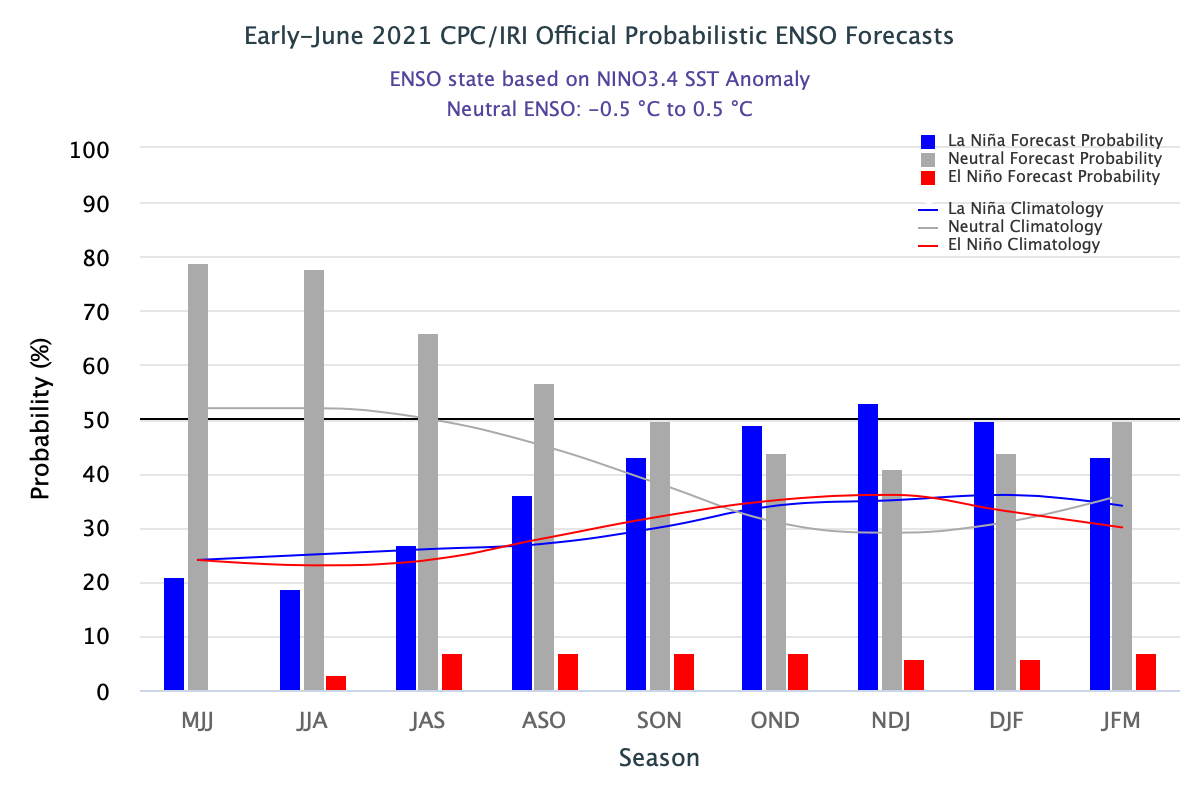
Figure 6b. Probabilistic forecasts of El Niño, La Niña, and La Nada conditions (source).
The U.S. Seasonal Drought Outlook through September 30, 2021, projects drought persistence but improvement for the westernmost parts of Texas (Figure 7a). The three-month temperature outlook projects warmer-than-normal conditions for the western part of the state (Figure 7b), while the three-month precipitation favors wetter-than-normal conditions for the easternmost parts of the state (Figure 7c).
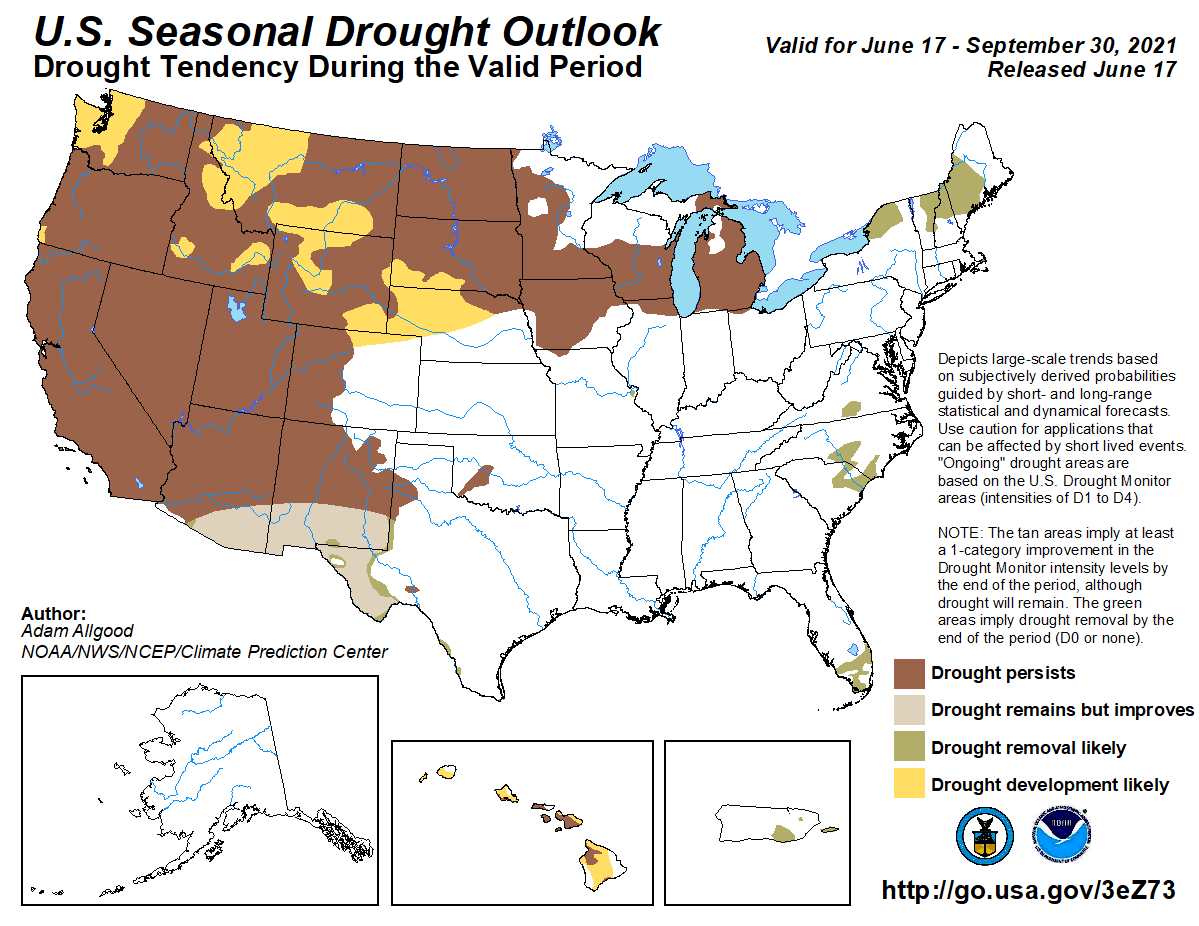
Figure 7a: The U.S. Seasonal Drought Outlook for June 17, 2021, through September 30, 2021 (source).
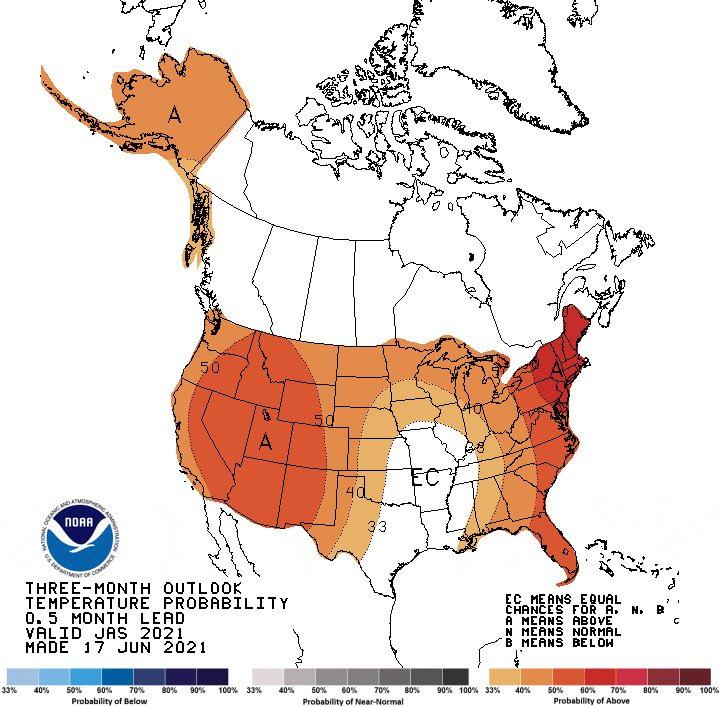
Figure 7b: Three-month temperature outlook from June 17, 2021 (source).

Figure 7c: Three-month precipitation outlook from June 17, 2021 (source).

