SUMMARY:
- Most of the state received less than 25% of normal rainfall
- After a near expulsion last month, drought is back with expectations for drought over most of the state by the end of the year
- La Niña conditions have a 70-80% chance of starting in the next month or so and continuing through the winter
I wrote this article on September 24, 2021.
Back when I was active with the Western States Water Council several years ago, I developed a great respect for the National Oceanic and Atmospheric Administration (NOAA) as a federal agency that not only sought feedback from users but actually responded to that feedback. Through the Council, I gave them lots of thoughts. However, one item that they hadn’t responded to before I left the state was improving the dude-on-the-street readability — I’m using the all-inclusion version of dude here — of some of their graphics. Until now.
I am a major Tuftehead. Dr. Edward Tufte of Yale University is an expert on the visual display of quantitative information, which is also the title of a book he wrote. His thoughts about how to best use graphics to convey information is “a visual Strunk and White” according to the Boston Globe and have impacted my career since I read his book in 1999 (sadly too late to employ his methods into my dissertation). I gave the good folks at NOAA a figurative tutorial on how Tufte’s approach would improve their products, one of which was the one-month and three-month seasonal outlooks, which used terciles. Terciles! Who the hell knows what terciles are?
This month, NOAA revealed the redesigned seasonal outlooks, and they are — in a word — gorgeous! Below, I’ve shown what they had last month on the left and the redesign on the right:


Figure 1a: The current way (left) and my way (right) for the El Niño Southern Oscillation projections.
The new version is better than a plate of Aaron Franklin’s finest with a healthy side of Aaron Franklin’s finest! Whoever redesigned this graphic clearly read Tufte’s work. I don’t know if I had anything to do with the changes, but holy moly, I like what they are doing.
There is still work to do. For example, the El Niño Southern Oscillation projections are something of a mess to non-specialists. Below is their version on the left and my version on the right:


Figure 1b: The current way (left) and my way (right) for the El Niño Southern Oscillation projections.
While their current version provides needed detail to the experts, it’s hard for non-specialists to pull the right noodle out of the spaghetti. While my version isn’t perfect, I dare say it’s a heck of a lot easier to pull the right noodle. Here’s to hoping that NOAA continues to improve its graphics. So far, they are on the right noodle!
True to Texas, after several months of relentless rains, the rain suddenly stopped for most of the state in August. Except for a few rain bombs in Hudspeth County and a glancing blow from Hurricane Nicholas along the upper coast, most of the state saw less than one inch of rain (Figure 2a). A sizable hunk of the state saw less than 25% of normal over the past month (Figure 2b). Rain over the past 90 days is much less than normal in the Big Bend area with the rest of state near normal or above (Figure 2c).

Figure 2a: Inches of precipitation that fell in Texas in the 30 days before September 24, 2021 (source). Note that cooler colors indicate lower values and warmer indicate higher values.

Figure 2b: Rainfall as a percent of normal for the 30 days before September 24, 2021 (source).

Figure 2c: Rainfall as a percent of normal for the 90 days before September 24, 2021 (source).
The amount of the state under drought conditions (D1–D4) increased from 1.2% four weeks ago to 5.1% today (Figure 3a) with drought developing in parts of the High Plains and some improvement of drought conditions in the Big Bend Area (Figure 3b). The Big Bend Area shows moderate drought with small patches of moderate and severe drought appearing in the High Plains (Figure 3a). In all, 30.6% of the state remains abnormally dry or worse (D0–D4; Figure 3a), up slightly from 8.2% four weeks ago with abnormally dry conditions appearing in scattered areas across the state (Figure 3a).

Figure 3a: Drought conditions in Texas according to the U.S. Drought Monitor (as of September 24, 2021; source).

Figure 3b: Changes in the U.S. Drought Monitor for Texas between August 24, 2021, and September 21, 2021 (source).
The North American Drought Monitor, which runs a month behind reality, continues to show a raging drought in much of the western United States with drought entrenched in the American Southwest, although improved from last month (Figure 4a). Precipitation in much of the Rio Grande watershed in southern New Mexico over the last 90 days was greater than normal (Figure 4b). Conservation storage in Elephant Butte Reservoir increased slightly from 5.1% full last month to 5.6% (Figure 4c), just above historic (since 1990) lows.
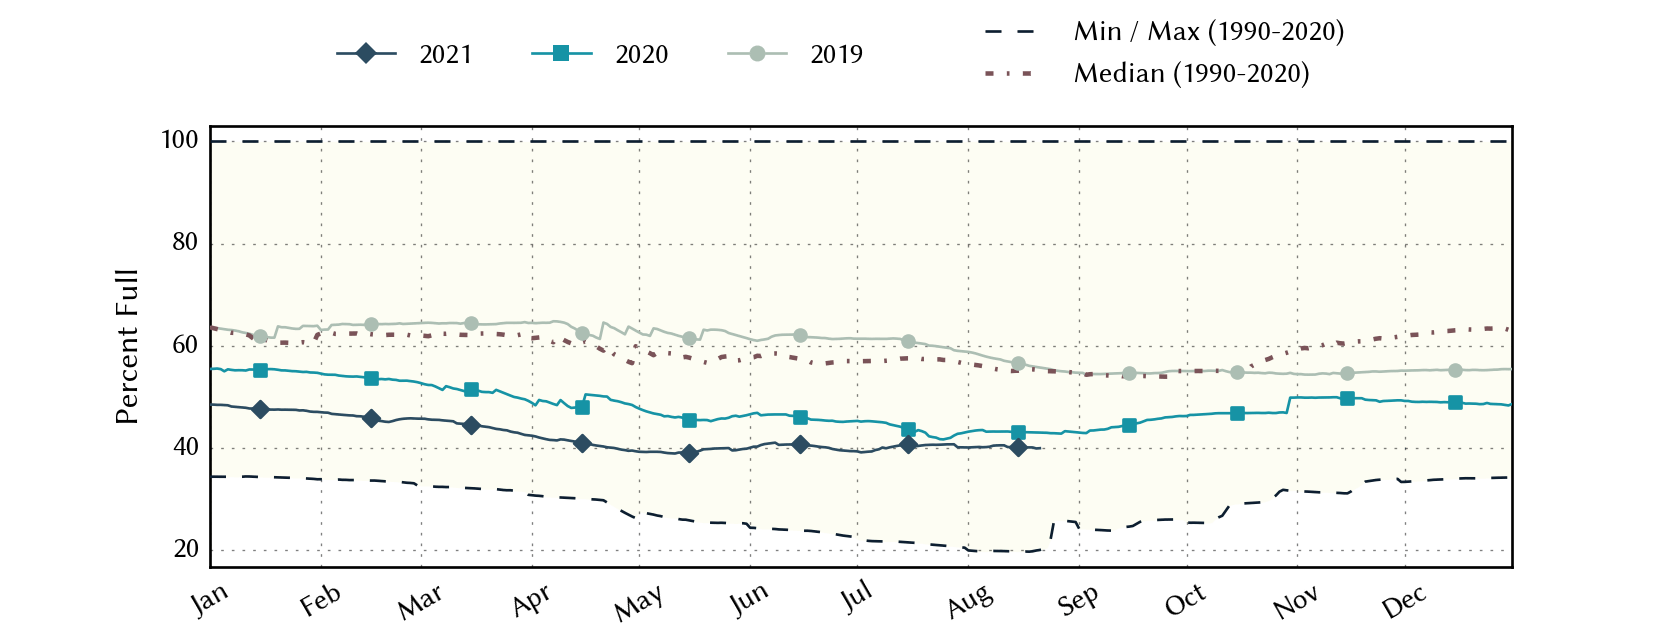
The Rio Conchos basin in Mexico, which confluences into the Rio Grande just above Presidio and is an important source of water to the lower part of the Rio Grande in Texas, remains out of drought conditions (Figure 4a). Combined conservation storage in Amistad and Falcon reservoirs decreased from 39.9% last month to 37.9% full today, about 18 percentage points below normal for this time of year (Figure 4d).

Figure 4a: The North American Drought Monitor for August 31, 2021 (source).

Figure 4b: Percent of normal precipitation for Colorado and New Mexico for the 90 days before September 24, 2021 (source). The red line is the Rio Grande Basin. I use this map to see check precipitation trends in the headwaters of the Rio Grande in southern Colorado, the main source of water to Elephant Butte Reservoir downstream.

Figure 4c: Reservoir storage in Elephant Butte Reservoir since 2019 with the median, min, and max for measurements from 1990 through 2020 (source).

Figure 4d: Reservoir storage in Amistad and Falcon reservoirs since 2019 with the median, min, and max for measurements from 1990 through 2020 (source).
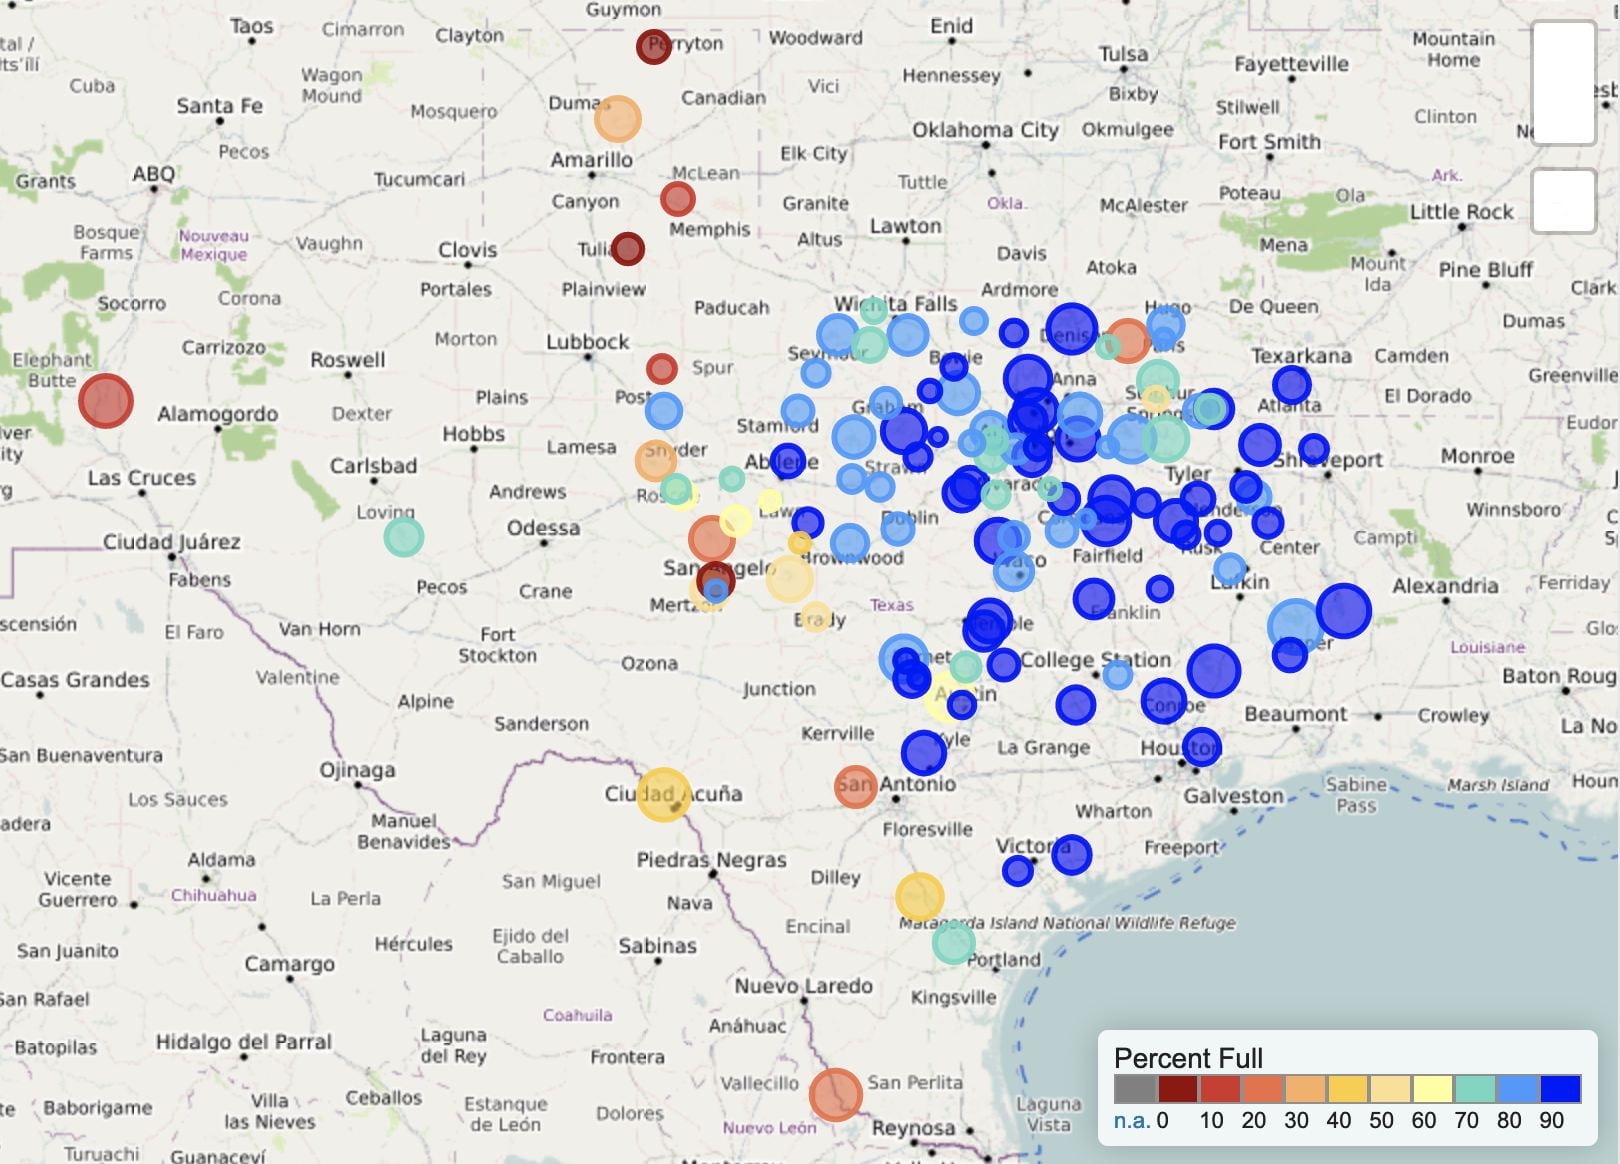
With the return of dry conditions, a number of basins have flows below historical 25th, 10th, and 5th flow percentiles (Figure 5a). Statewide reservoir storage is at 81.4% full as of today, down from 84.9% a month ago but a few percentage points above normal for this time of year (Figure 5b). Most reservoirs in the eastern part of the state are now above 90% full, although a few remain below 90% and 80% full (Figure 5c).

Figure 5a: Parts of the state with below-25th-percentile seven-day average streamflow as of September 24, 2021 (source).

Figure 5b: Statewide reservoir storage since 2019 compared to statistics (median, min, and max) for statewide storage from 1990 through 2020 (source).

Figure 5c: Reservoir storage as September 24, 2021 in the major reservoirs of the state (source).
Sea-surface temperatures in the Central Pacific, which partly define the status of the El Ni have continued their warming trend such that we remain in neutral (La Nada) conditions (Figure 6a). Projections of sea-surface temperatures remain in neutral conditions through mid-to-late summer with a projected return to La NiThe Climate Prediction Center gives the return of La Niña conditions in the next couple of months a 70-80% chance of occurring and expects La Niña conditions to continue through the winter (Figure 6b). As a result, we remain under a La Niña watch. Projections suggest a return to neutral conditions at the beginning of next year, but the prediction skill that far out is suspect, so don’t place your chips just yet.

Figure 6a. Forecasts of sea-surface temperature anomalies for the Niño 3.4 Region as of August 19, 2021 (modified from source). “Range of model predictions -1” is the range of the various statistical and dynamical models’ projections minus the most outlying upper and lower projections.

Figure 6b. Probabilistic forecasts of El Niño, La Niña, and La Nada (neutral) conditions (source).
The U.S. Seasonal Drought Outlook through December 30, 2021, now projects drought development over most of the state (Figure 7a), a big change from last month when they projected no drought. The three-month temperature outlook projects warmer-than-normal conditions for the entire state (Figure 7b), while the three-month precipitation favors drier-than-normal conditions for the entire state as well (Figure 7c).

Figure 7a: The U.S. Seasonal Drought Outlook for September 16, 2021, through December 31, 2021 (source).

Figure 7b: Three-month temperature outlook from September 16, 2021 (source).

Figure 7c: Three-month precipitation outlook from September 16, 2021 (source).

