SUMMARY:
- Drought holds steady in the state, with 24% under drought conditions (D1–D4).
- El Niño has a 75% chance of extending through the March-April-May season, with La Niña favored in June-July-August and at least October-November-December.
- Drought is expected to remain and expand in West and Far West Texas and improve in the Hill Country.
I wrote this article on April 2, 2024.
Many of us in the office (and many in Central Texas) are watching levels in Travis, Buchanan, Canyon, and Medina lakes with great interest. Levels in many of these lakes are at or near record low levels. With eyes on the skies, rain has fallen in the area, lifting flows in Barton, San Marcos, and Comal springs but not in the catchments for the reservoirs. Oddly, I-35 marks a line between where it has been raining (to the east) and where it has not (to the west), which has not been good for our lakes.
The Lower Colorado River Authority developed an excellent plot that compares the current drought with the 2008 to 2015 drought, which became the new drought of record, beating the 1950s drought (Figure 1a). Disturbingly, the current drought looks a heck of a lot like the 2008 to 2015 drought, and this is after the Authority revised its water management plan to build more resilience in its water supplies. Given that, it’s possible that we are already in a new drought of record only three years after the previous one ended.
Ultimately, we won’t know if we are in a new drought of record until the fat cloud sings with enough rainfall to top the reservoirs and the engineers make their calculations. In addition to drought, we are also seeing increased use of our water resources, something that also needs to be taken into consideration. Regardless of the cause, lake levels are low, and river authorities are contemplating reducing how much water users can take from the reservoirs to extend the supplies.
Unfortunately, although there is always hope, the future doesn’t look promising for big rains. El Niño has been a bust for the Hill Country and Edwards Plateau, and the clock is ticking for benefiting from those conditions. Soon, our traditional hot and dry summer will be upon us. Even worse, we are quickly heading into hot and dry La Niña conditions for the fall and winter, and that carries us into our hot and dry summer in 2025.
One bright spot is that with El Niño gone, we have a greater chance of seeing a tropical storm wash across the state. When talking to folks (and reporters) here and during my career at the Texas Water Development Board, I often said (and say) that we can always hope for “a mellow tropical system” to save the day. But how likely is that? When looking at hurricane strike frequency (Figure 1b), there is, on average, a less than 2% chance of hurricane remnants churning over the Hill Country. That would be a wee bit higher if tropical storm strikes were also included, but probably not by much. Hope is, indeed, hope.

Figure 1a: Comparison of the current drought to the 2008-2015 drought (lifted from LCRA).

Figure 1b: Hurricane strike frequency across Texas.
Over the past month, we have had the usual more rain in the east and less in the west (Figure 2a). Most of the state received less-than-average rainfalls, with parts of east Texas benefitting from greater-than-normal rainfall over the past 30 days (Figure 2b). The last 90 days are a story of haves and have-nots, with the Panhandle and the south-eastern central parts of the state seeing much greater-than-normal precipitation while the rest of the state has seen far less-than-normal amounts (Figure 2c).

Figure 2a: Inches of precipitation that fell in Texas in the 30 days before April 2, 2024 (modified from source). Note that cooler colors indicate lower values and warmer indicate higher values. Light grey is no detectable precipitation.

Figure 2b: Rainfall as a percent of normal for the 30 days before April 2, 2024 (modified from source).

Figure 2c: Rainfall as a percent of normal for the 90 days before April 2, 2024 (modified from source).
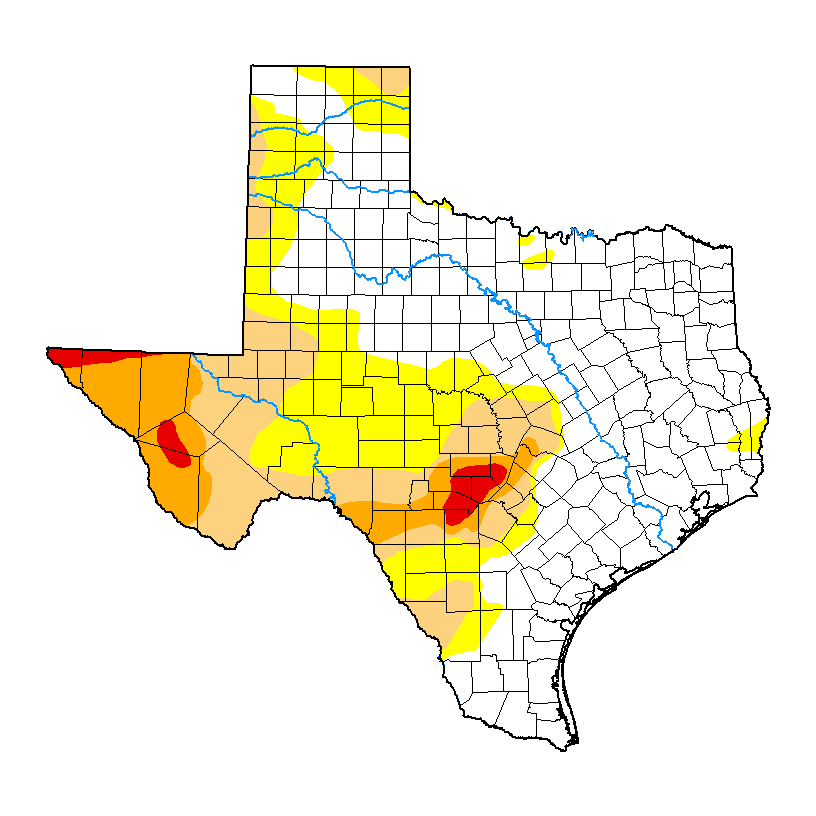
The amount of the state under drought conditions (D1–D4) increased from 23% four weeks ago to 24% today (Figure 3a), with a mixture of drought improvements and developments across the state (Figure 3b). Extreme drought or worse stayed the same as four weeks ago at 2% of the state, with exceptional drought remaining at 0% (Figure 3a). In all, 45% of the state is abnormally dry or worse (D0–D4; Figure 3a), up from 43% four weeks ago.

Figure 3a: Drought conditions in Texas according to the U.S. Drought Monitor (as of March 26, 2024; source).

Figure 3b: Changes in the U.S. Drought Monitor for Texas between February 27, 2024, and March 26, 2024 (source).
The North American Drought Monitor, which runs a month behind current conditions, shows drought in New Mexico, Mexico, and Louisiana (Figure 4a). Parts of the Rio Grande watershed in Colorado and New Mexico show higher-than-normal rainfall over the last 90 days (Figure 4b).
Conservation storage in Elephant Butte Reservoir—an important source of water for the El Paso area—declined from 25.1% five weeks ago to 21.9% more recently (Figure 4c), slightly below median storage since 1990.
The Rio Conchos basin in Mexico, which confluences with the Rio Grande just above Presidio and hosts the largest tributary to the Lower Rio Grande, remains in Extreme to Exceptional drought (Figure 4a). Combined conservation storage in the Amistad and Falcon reservoirs increased to 22.6% full from 21.9% five weeks ago, almost 40 percentage points below normal for this time of year (since 1990) and the lowest in at least the past 33 years (Figure 4d).

Figure 4a: The North American Drought Monitor for February 29, 2023 (source).

Figure 4b: Percent of normal precipitation for Colorado and New Mexico for the 90 days before April 2, 2024 (modified from source). The red line is the Rio Grande Basin. I use this map to see check precipitation trends in the headwaters of the Rio Grande in southern Colorado, the main source of water to Elephant Butte Reservoir downstream.

Figure 4c: Reservoir storage in Elephant Butte Reservoir since 2022 with the median, min, and max for measurements from 1990 through 2023 (graph from Texas Water Development Board).

Figure 4d: Reservoir storage in Amistad and Falcon reservoirs since 2022 with the median, min, and max for measurements from 1990 through 2023 (graph from Texas Water Development Board).
Basins across the state continue to host flows over the past week below historical 25th, 10th, and 5th percentiles (Figure 5a). Statewide reservoir storage is at 72.3% full, down about 350,000 acre-feet from 73.4% five weeks ago and about 12 percentage points below normal for this time of year since 1990 (Figure 5b). Recent rains have not topped up most of the reservoirs in the central part of the state (Figure 5c).
The reservoir marked in organce in the Dallas-Fort Worth area (the raspberry in a sea of blueberries) is New Terrell City Lake and has dropped from full in early March (Figure 5c). I could not discern the cause, but I suspect it’s for maintenance on the reservoir and/or dam.
My (drumroll please) Hydrograph of the Month is Canyon Lake due to its lowest levels since inundation in the late 1960s (Figure 5d).

Figure 5a: Parts of the state with below-25th-percentile seven-day average streamflow as of April 2, 2024 (map modified from U.S. Geological Survey).

Figure 5b: Statewide reservoir storage since 2022 compared to statistics (median, min, and max) for statewide storage from 1990 through 2023 (graph from Texas Water Development Board).

Figure 5c: Reservoir storage in the state’s major reservoirs as of April 2, 2024 (modified from Texas Water Development Board).

Figure 5d: Hydrograph Of The Month—Reservoir storage for Canyon Lake (graph from Texas Water Development Board).
Sea-surface temperatures in the Central Pacific that, in part, define the status of the weather phenomenon known as the El Niño Southern Oscillation strongly remain in El Niño conditions; however, temperatures are starting to drop (Figure 6a). Projections suggest El Niño conditions continue with a return to neutral conditions in March-April-May.
This month’s projection is about the same as last month’s, except for a cooler La Niña (Figure 6a). The official probabilities, a month newer than the projections in the graph, give El Niño conditions a 75% chance of extending through the March-April-May season, giving way to strongly favoring (>80%) neutral conditions in April-May-June and odds favoring La Niña conditions starting in June-July-August (Figure 6b). Accordingly, we remain under a La Niña Watch.

Figure 6a. Forecasts of sea-surface temperature anomalies for the Niño 3.4 Region as of February 19, 2024 (modified from Climate Prediction Center and others). “Range of model predictions -1” is the range of the various statistical and dynamical models’ projections minus the most outlying upper and lower projections. Sometimes, those predictive models get a little craycray.

Figure 6b. Probabilistic forecasts of El Niño, La Niña, and La Nada (neutral) conditions (graph from Climate Prediction Center and others).
The U.S. Seasonal Drought Outlook through March projects drought persistence and development in West and Far West Texas with drought improvement in the Hill Country (Figure 7a).
The three-month temperature outlook projects above-average temperatures for the state (Figure 7b), while the three-month precipitation outlook favors wetter-than-normal conditions for the most eastern sliver of the state and drier-than-normal conditions for West and Far West Texas (Figure 7c).

Figure 7a: The U.S. Seasonal Drought Outlook for April 1, 2024, through June 30, 2024 (source).

Figure 7b: Three-month temperature outlook for April-May-June 2024 (source).

Figure 7c: Three-month precipitation outlook for April-May-June 2024 (source).