By Robert Mace, Chief Water Policy Officer at The Meadows Center for Water and the Environment
SUMMARY:
-
Drought conditions have worsened over the past month with 59 percent of the state now suffering from drought.
-
Statewide reservoir storage continued to decline with Choke Canyon Reservoir hitting new historical lows over the past month.
-
Drought is expected to improve, but remain, over the next three months.
-
El Niño is still expected this this fall and winter.
My day trip down to Del Rio to yap about groundwater allowed me to stop in and check on Las Moras Springs in Brackettville and San Felipe Springs in Del Rio. I was particularly interested in Las Moras Springs since there was a rumor that they had gone dry. Fortunately, based on a stream gage the U.S. Geological Survey maintains on Las Moras Creek just downstream of the pool, this appeared to be inaccurate (the swimming pool had shut down for a time, which is probably the source of the rumor). Nonetheless, with the heart of the drought beating in South-Central Texas, Las Moras springs flows have certainly been low—as low as 3 cubic feet per second (Figure 1). San Felipe Springs still had an impressive, roiling flow belching out of it at about 70 cubic feet per second as compared to a long-term (since 1961) average of 117 cubic feet per second.
A mellow, nobody-gets-hurt tropical system (the kind you’d invite to Sunday dinner) would help alleviate the area’s drought woes, but the chances of that have decreased since NOAA released its initial Atlantic hurricane outlook in May. The August update shows a 60 percent chance of a below-normal season, a 30 percent chance of a near-normal season, and only a 10 percent chance of an above-normal season. There’s now a 70 percent chance of 9 to 13 named storms (which includes the 3 named storms we’ve seen so far this season), 4 to 7 hurricanes (which includes the 2 hurricanes to date), and 0 to 2 major hurricanes. This is a ‘quieter’ prediction, but there’s still the potential for a lot of storms to come.
![Figure 1A: Spring flow at Las Moras Springs between July 16 and August 16, 2018 [source].](https://texaspluswater.wp.txstate.edu/files/2018/08/figure-1.png)
![Figure 1B: Streamflow in San Felipe Creek between July 16 and August 16, 2018 [plot from the International Boundary Water Commission; source; note that this data doesn’t account for withdrawals by the City of Del Rio and therefore does not perfectly describe springflow].](https://texaspluswater.wp.txstate.edu/files/2018/08/figure-1b.png)
![Figure 1C: Postcard showing San Felipe Spring with production pipes [source].](https://texaspluswater.wp.txstate.edu/files/2018/08/figure-1c.jpg)
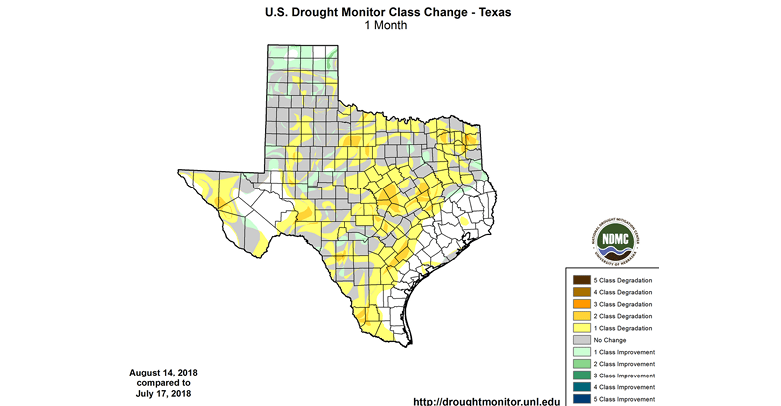
The drought in Kinney and Val Verde counties, homes for Las Moras and San Felipe springs, respectively, has gotten worse over the past month as it has for the state as a whole (Figure 2). As of mid-August, 59 percent of the state was in drought as compared to 46 percent a month ago. The northern Panhandle benefitted from some improvement, but most of the state continues to dry up and blow away.
![Figure 2: Drought conditions in Texas according to the U.S. Drought Monitor (as of August 14, 2018) [source].](https://texaspluswater.wp.txstate.edu/files/2018/08/figure-2.png)
![Figure 3: Changes in the U.S. Drought Monitor for Texas between July 17, 2018, and August 14, 2018 [source].](https://texaspluswater.wp.txstate.edu/files/2018/08/figure-3.png)
Ninety-day rainfall deficits look better this month than last, but much of Texas has still received less than 75 percent of normal for the past three months (Figure 4). Maverick County in South-Central Texas has the worst 90-day rainfall deficit with the northern part of the county receiving less than 25 percent of normal.
![Figure 4: Rainfall as a percent of normal for the past 90 days as of August 16, 2018 [source].](https://texaspluswater.wp.txstate.edu/files/2018/08/figure-4.png)
The North American Drought Monitor for June is slightly improved from last month, but still grim for northern New Mexico and southern Colorado (the primary source of water for Elephant Butte Reservoir; Figure 5). North-Central Mexico, the primary source of water for Lake Amistad and Lake Falcon, is still experiencing abnormally dry conditions (Figure 5).
![Figure 5: The North American Drought Monitor for July 31, 2018 [source].](https://texaspluswater.wp.txstate.edu/files/2018/08/figure-5.png)
For the state, reservoir storage continued to decline over the past month and is now about 6 percentage points below normal for this time of year (below the median as measured since 1990) at about 76.2 percent full, although the past week has enjoyed a small gain in storage (Figure 6a). Reservoirs are continuing to decline with Medina Lake now less than 50 percent full (Figure 6b), Choke Canyon at historic lows over the past month (not considering initial inundation; Figure 6c), and Lake Travis at 64 percent, 20 percentage points below normal for this time of year (Figure 6d).
![Figure 6A: State-wide reservoir storage since 2016 compared to statistics (median, min, and max) for state-wide storage since 1990 [source].](https://texaspluswater.wp.txstate.edu/files/2018/08/figure-6a.png)
![Figure 6B: Storage in Medina Lake [source].](https://texaspluswater.wp.txstate.edu/files/2018/08/figure-6b.png)
![Figure 6C: Storage in Choke Canyon Reservoir [source].](https://texaspluswater.wp.txstate.edu/files/2018/08/figure-6c.png)
![Figure 6D: Storage in Lake Travis [source].](https://texaspluswater.wp.txstate.edu/files/2018/08/figure-6c-2.png)
Reservoirs across the state, particularly in North-Central Texas just west of Dallas-Fort Worth, are showing declines in storage (compare Figure 7a, this month, to Figure 7b, last month).
![Figure 7A: Reservoir storage as of August 16, 2018, in major reservoirs of the state. Elephant Butte Reservoir in New Mexico is shown because it is an important source of water to the El Paso area [source].](https://texaspluswater.wp.txstate.edu/files/2018/08/figure-7a.png)
![Figure 7B: Reservoir storage as of July 20, 2018, in major reservoirs of the state [source].](https://texaspluswater.wp.txstate.edu/files/2018/08/figure-7b.png)
Projections of El Niño conditions continue to strengthen, so we remain under an El Niño Watch for the fall and winter (Figure 8). Nonetheless, the Climate Prediction Center lowered El Niño chances to 60 percent for the fall (down from 65 percent last month) but kept those chances at 70 percent for the winter. El Niño conditions generally result in wetter-than-normal and cooler-than-normal conditions for Texas and act as a tropical storm suppressor.
![Figure 8. Forecasts of sea surface temperatures anomalies for the Niño 3.4 Region as of August 9, 2018 [modified from source].](https://texaspluswater.wp.txstate.edu/files/2018/08/figure-8.png)
With El Niño conditions becoming more likely, the U.S. Seasonal Drought Outlook through November looks much more optimistic than last month with drought improvements projected for the Panhandle and Far West Texas and drought persisting—but not expanding—in the rest of the state (Figure 9).
![Figure 9: The U.S. Seasonal Drought Outlook for August 16 through November 30, 2018 [source].](https://texaspluswater.wp.txstate.edu/files/2018/08/figure-9.png)