By Robert Mace, Chief Water Policy Officer at The Meadows Center for Water and the Environment
SUMMARY:
-
Statewide drought conditions have improved considerably over the past month with the amount of the state suffering from drought declining from 59 percent to 29 percent.
-
Statewide reservoir storage reversed its downward trend and is now on pace to exceed average for this time of year.
-
Drought is expected to improve, but persist, particularly in the western half of the state, over the next three months.
-
The certainty of El Niño arriving this fall and winter have declined slightly, but El Niño is still expected.
What a difference a month makes! Rains over much—but not all—of Texas has cleaned South-Central Texas of drought and faded the reds of extreme and exceptional drought in Central Texas. For the 30 days before September 23rd, large parts of the state received over 10 inches of rain and parts of Bandera, Bexar, Fannin, Medina, Real, and Uvalde counties and the Gulf Cost area from Corpus Christi through Beaumont received more than 20 inches (Figure 1a).
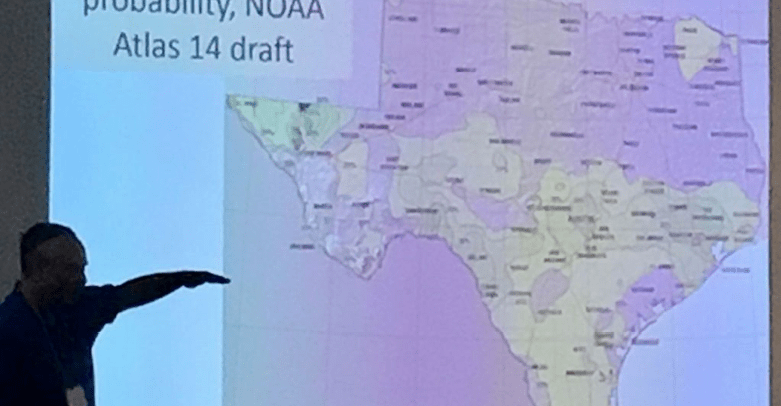
Speaking of increased rainfall amounts, NOAA has been working on updating the precipitation frequency estimates for Texas in something called Atlas 14. The last time Atlas 14 was updated was in 1961, so the addition of more than 50 years of new data will strengthen the estimates. Atlas 14 is important because, unless locals have supported local updates in the statistics, it is used to generate 100-year and 500-year floodplain maps for FEMA. The City of Austin has been preparing its citizens for major changes in the flood maps. The Atlas 14 update was a topic of discussion at a recent Texas Water Research Network meeting where the state climatologist, John Nielsen-Gammon, noted that for a large area from Houston through Austin the 100-year floodplain based on the updated atlas would look like today’s 500-year floodplain map (Figure 1b). Dr. Nielsen-Gammon also noted that rainfall intensities are increasing with time.
![Figure 1a: Inches of rain that fell in Texas in the 30 days before September 23, 2018 [source].](https://texaspluswater.wp.txstate.edu/files/2018/09/figure-1a.png)
![Figure 1b: John Nielsen-Gammon discusses changes in Atlas 14 in the 1 percent probability map for Texas. Areas in tan will see higher rainfall amounts for the 1-percent-chance 24-hour rainfall amount. [photo by the author].](https://texaspluswater.wp.txstate.edu/files/2018/09/figure-1b.jpg)
The amount of Texas in drought over the past month has halved from 59 percent to 29 percent; however, parts of West Texas are still suffering from extreme and exceptional drought conditions (Figure 2a). Rainfalls over the past week should result in further drought improvements in the eastern half of the state.
![Figure 2a: Drought conditions in Texas according to the U.S. Drought Monitor (as of September 18, 2018) [source].](https://texaspluswater.wp.txstate.edu/files/2018/09/figure-2a.png)
![Figure 2b: Changes in the U.S. Drought Monitor for Texas between August 14, 2018, and September 18, 2018 [source].](https://texaspluswater.wp.txstate.edu/files/2018/09/figure-2b.png)
Ninety-day rainfall deficits look much better this month than last, but much of the High Plains has still received less than 75 percent of normal for the past three months (Figure 3). Even with all the recent rains, there are still widely distributed splotchy parts of east Texas and the Rio Grande Valley where rainfall is still below normal.
![Figure 3: Rainfall as a percent of normal for the past 90 days (as of September 23, 2018)[source].](https://texaspluswater.wp.txstate.edu/files/2018/09/figure-2.png)
The North American Drought Monitor for September misses all the recent rains in Texas, but it shows the continuing drought in the southern Colorado (Figure 4a), which isn’t good news for the Rio Grande and Elephant Butte Reservoir, which is now at 3-percent full (Figure 4b), the lowest it’s been since August 31, 1972. North-Central Mexico, the primary source of water for Lake Amistad and Lake Falcon, is still experiencing abnormally dry conditions (Figure 4a).
![Figure 4a: The North American Drought Monitor for August 31, 2018 [source].](https://texaspluswater.wp.txstate.edu/files/2018/09/figure-4a.jpg)
![Figure 4b: Storage in Elephant Butte Reservoir for 2016, 1017, and 2018 with statistics for levels since 1990 [source].](https://texaspluswater.wp.txstate.edu/files/2018/09/figure-4b.png)
The rains have reversed the downward trend in statewide reservoir storage, lifting storage from a low of 74.1 percent on September 5 to 78.1 percent on September 23 (and rising) (Figure 5).
![Figure 6a: Statewide reservoir storage since 2016 compared to statistics (median, min, and max) for state-wide storage since 1990 [source].](https://texaspluswater.wp.txstate.edu/files/2018/09/figure-6a.png)
Reservoirs in the eastern part of the state are generally showing increases in storage (compare Figure 6a, this month, to Figure 6b, last month).
![Figure 6a: Reservoir storage as of September 23, 2018, in major reservoirs of the state. Elephant Butte Reservoir in New Mexico is shown because it is an important source of water to the El Paso area [source].](https://texaspluswater.wp.txstate.edu/files/2018/09/figure-7a.png)
![Figure 6b: Reservoir storage as August 16, 2018, in major reservoirs of the state [source].](https://texaspluswater.wp.txstate.edu/files/2018/09/figure-7b.png)
We remain under an El Niño Watch for the fall and winter, but the certainty has decreased, moving from 60 percent last month to a 50 to 55 percent chance this fall and moving from a 70 percent chance last month to a 65 to 70 percent chance this month. The consensus projection still shows El Niño conditions arriving this fall (Figure 7). El Niños generally result in wetter-than-normal and cooler-than-normal conditions for Texas and act as a tropical storm suppressor.
![Figure 7. Forecasts of sea surface temperatures anomalies for the Niño 3.4 Region as of August 20, 2018 [modified from source].](https://texaspluswater.wp.txstate.edu/files/2018/09/figure-8.png)
With El Niño conditions becoming more likely and the recent rains, the U.S. Seasonal Drought Outlook through December looks much more optimistic than last month with drought improvements projected for across the state (Figure 8).
![Figure 9: The U.S. Seasonal Drought Outlook for August 16 through December 31, 2018 [source].](https://texaspluswater.wp.txstate.edu/files/2018/09/figure-9.png)
Author

Robert Mace,
Deputy Executive Director & Chief Water Policy Officer at The Meadows Center for Water and the Environment
Robert Mace is a Professor of Practice in the Department of Geography at Texas State University. Robert has over 30 years of experience in hydrology, hydrogeology, stakeholder processes, and water policy, mostly in Texas.