SUMMARY:
-
The High Plains and Lower Rio Grande Valley are out of drought, but drought conditions expanded in south-central, central, and north-central Texas.
-
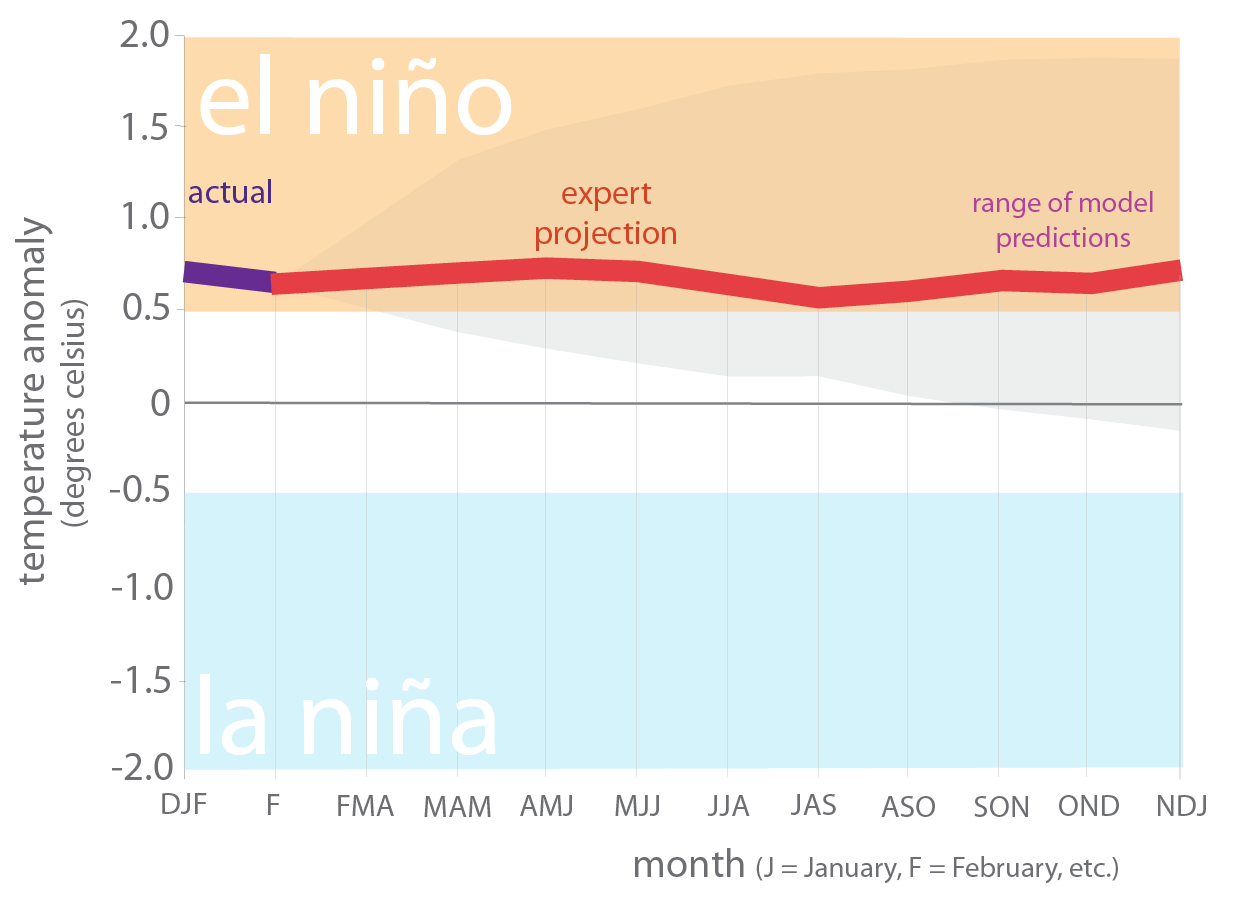
El Niño is still with us and may remain with us through the fall.
-
The Atlantic is expected to have a slightly-less-than-normal tropical season with 13 named storms and 5 hurricanes.
The past month has seen drought removal in the High Plains and drought expansion and intensification from south-central Texas up towards Dallas-Fort Worth and down towards Corpus Christi. Drought conditions in the headwaters of the Rio Grande in southern Colorado, where the river receives much of its water, have greatly improved over the past month. Statewide reservoir storage is declining but is still about 5 percentage points above normal for this time of year. El Niño is still with us with better-than-even odds that El Niño conditions continue through the summer and fall. Drought is likely to fade across the state by the end of June with pockets remaining in south-central Texas.
The Department of Atmospheric Science at Colorado State University released its first projections of the upcoming hurricane season, which runs from June 1 through November 30. They are projecting 13 named storms and 5 hurricanes, which would be a slightly below-normal season. Projected El Niño conditions, which tend to suppress tropical activity, and an Atlantic Multi-Decadal Oscillation below its long-term average, which correlates with less-active seasons, helped inform the projection. The Rams also predict a 28 percent chance of hurricane landfall along the Gulf Coast from the Florida Panhandle to Brownsville (the long-term average is 30 percent). The Department will issue revised updates on June 4, July 2, and August 6.
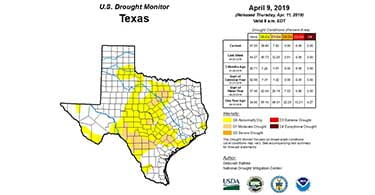
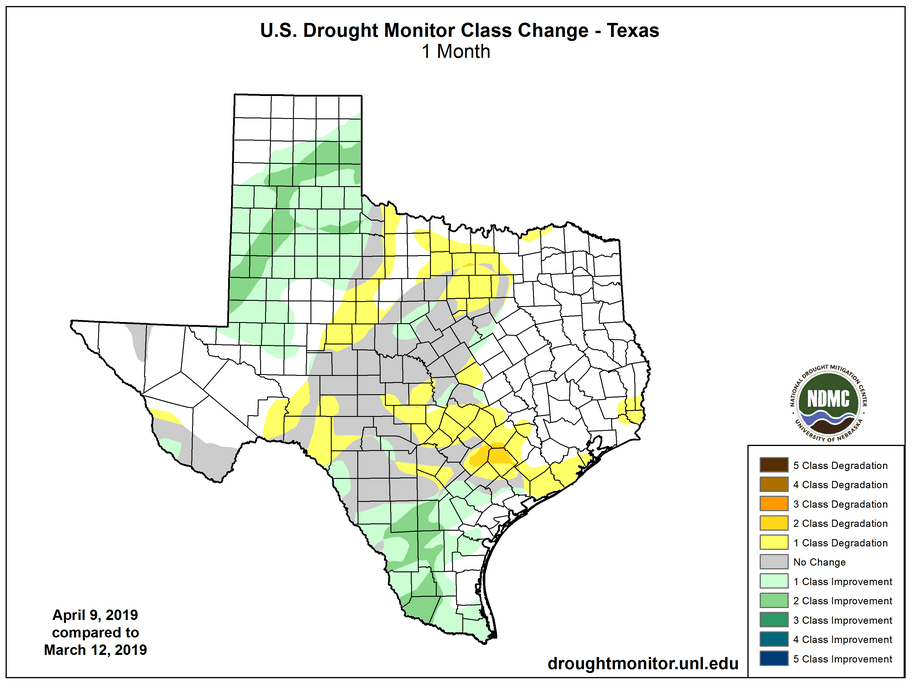
The amount of drought in Texas (D1-D4) over the past month decreased from 14.7 to 7.8 percent (note that yellow is abnormally dry and not drought) with patches of moderate drought appearing in north-central, central, and south-central Texas (Figure 2a). The High Plains and the Lower Rio Grande Valley came out of drought while drought conditions expanded in central and north-central Texas (Figure 2b).

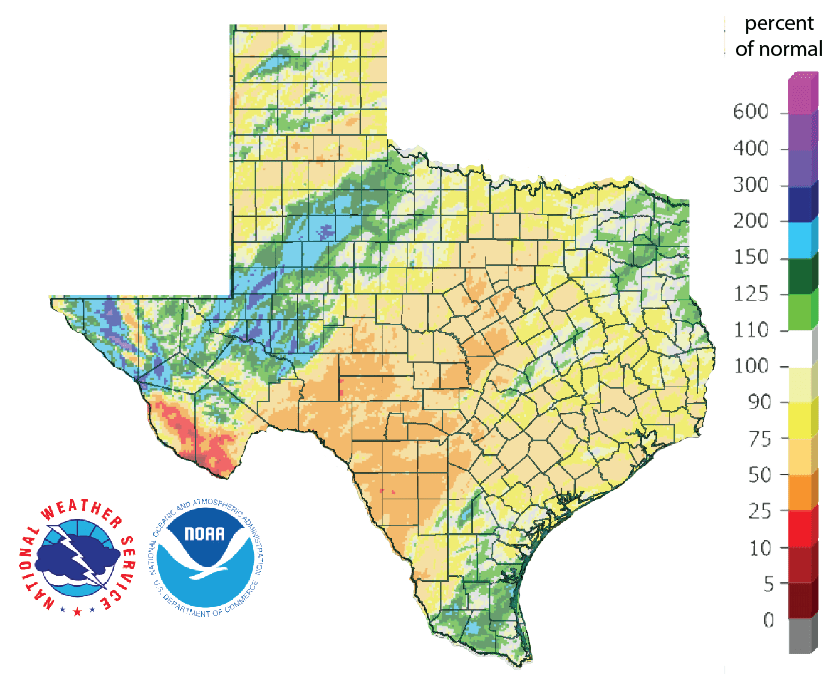
The 90-day precipitation as a percent of normal shows much of state in rainfall deficit with the Big Bend Area receiving less than 5 to 10 percent of normal rainfall and much of south-central and central Texas receiving less than 50 percent of normal rainfall (Figure 3).
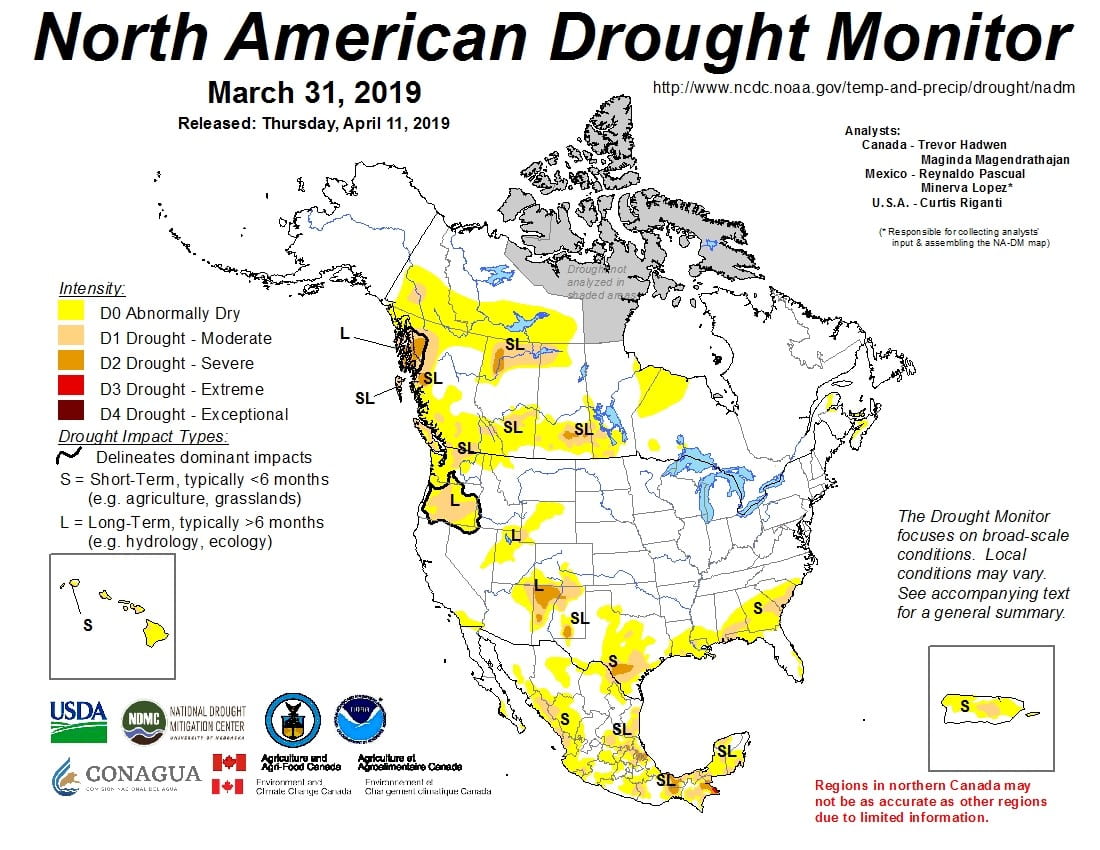
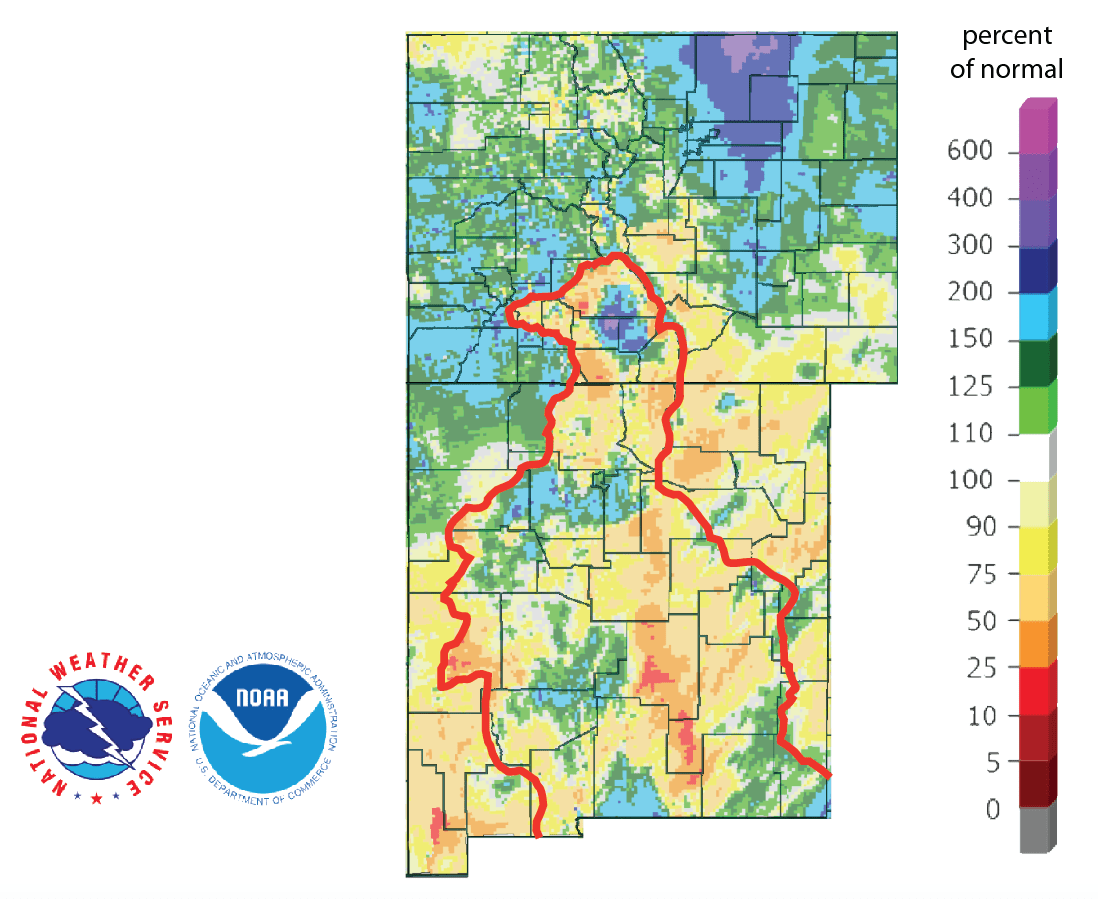
The North American Drought Monitor for the end of March shows major improvements in the headwaters of the Rio Grande (Figure 4a). Percent of normal precipitation in the Rio Grande watershed in Colorado, the primary source of water for Elephant Butte Reservoir, over the last 90 days shows the results of major rainfalls in the center of the area (Figure 4b).
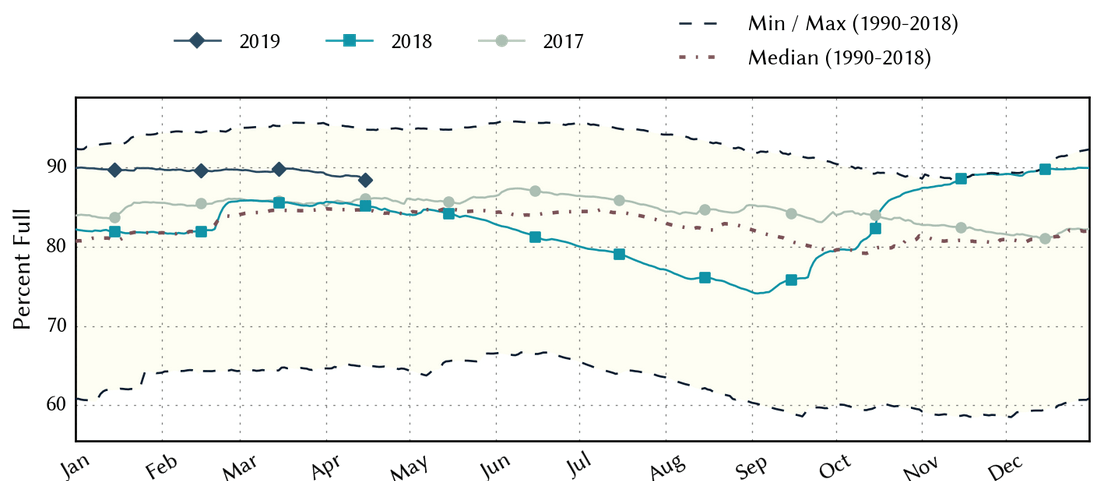
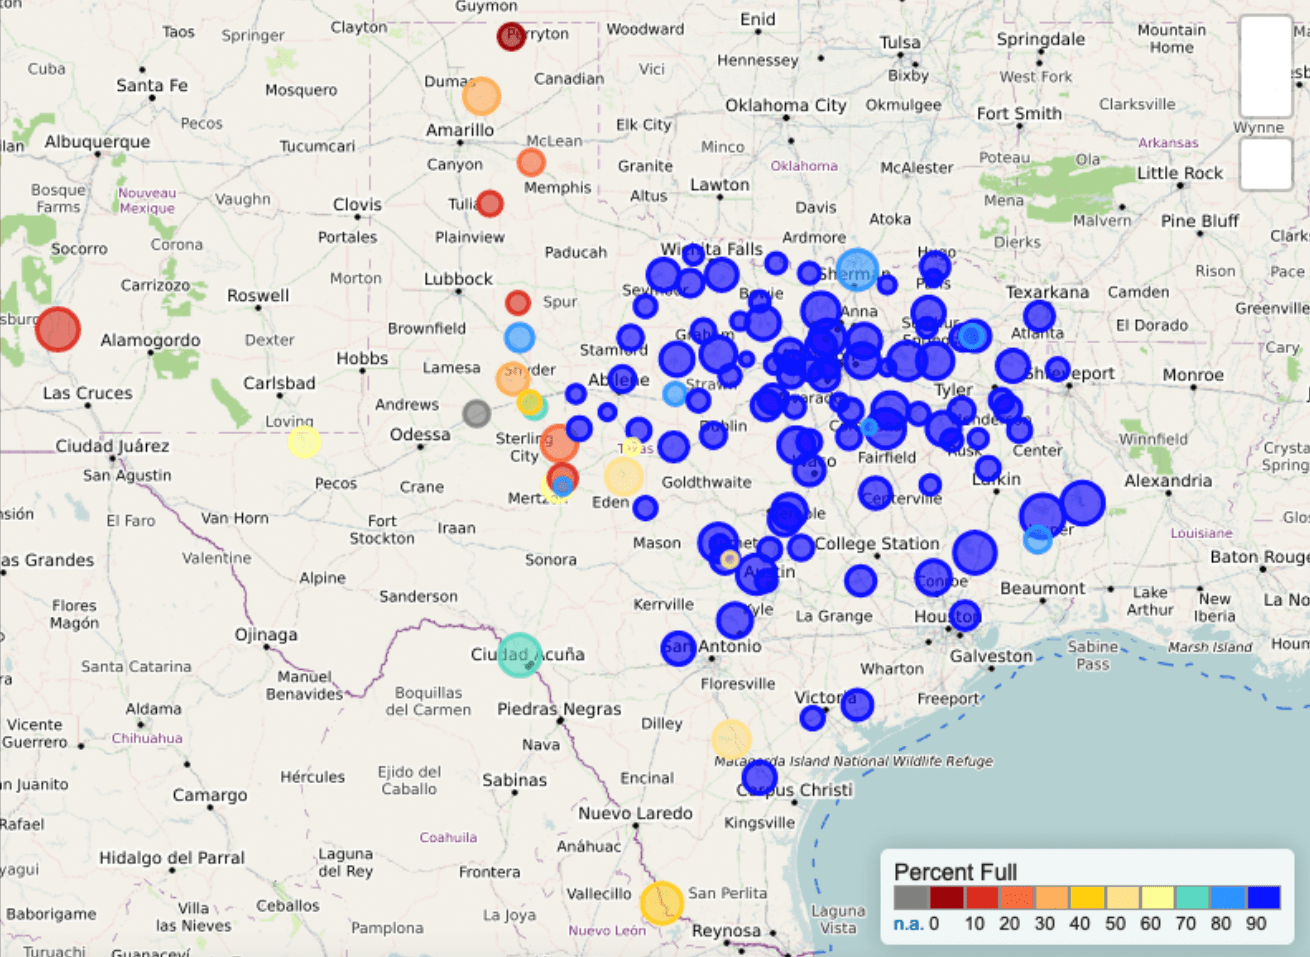
Statewide reservoir storage declined slightly over the past month but remains about 5 percentage points above normal for this time of year (Figure 5a). Percent full status for individual reservoirs this month (Figure 5b) is about the same as last month with several reservoirs in the eastern have of the state filling to above 90-percent full (Figure 5c).

We are still under an El Niño Advisory with an 65 percent chance of weak El Niño conditions continuing through the summer and a 55 to 60 percent chance through the fall (Figure 6). El Niños generally result in wetter-than-normal and cooler-than-normal conditions for Texas and act as a tropical storm suppressor.
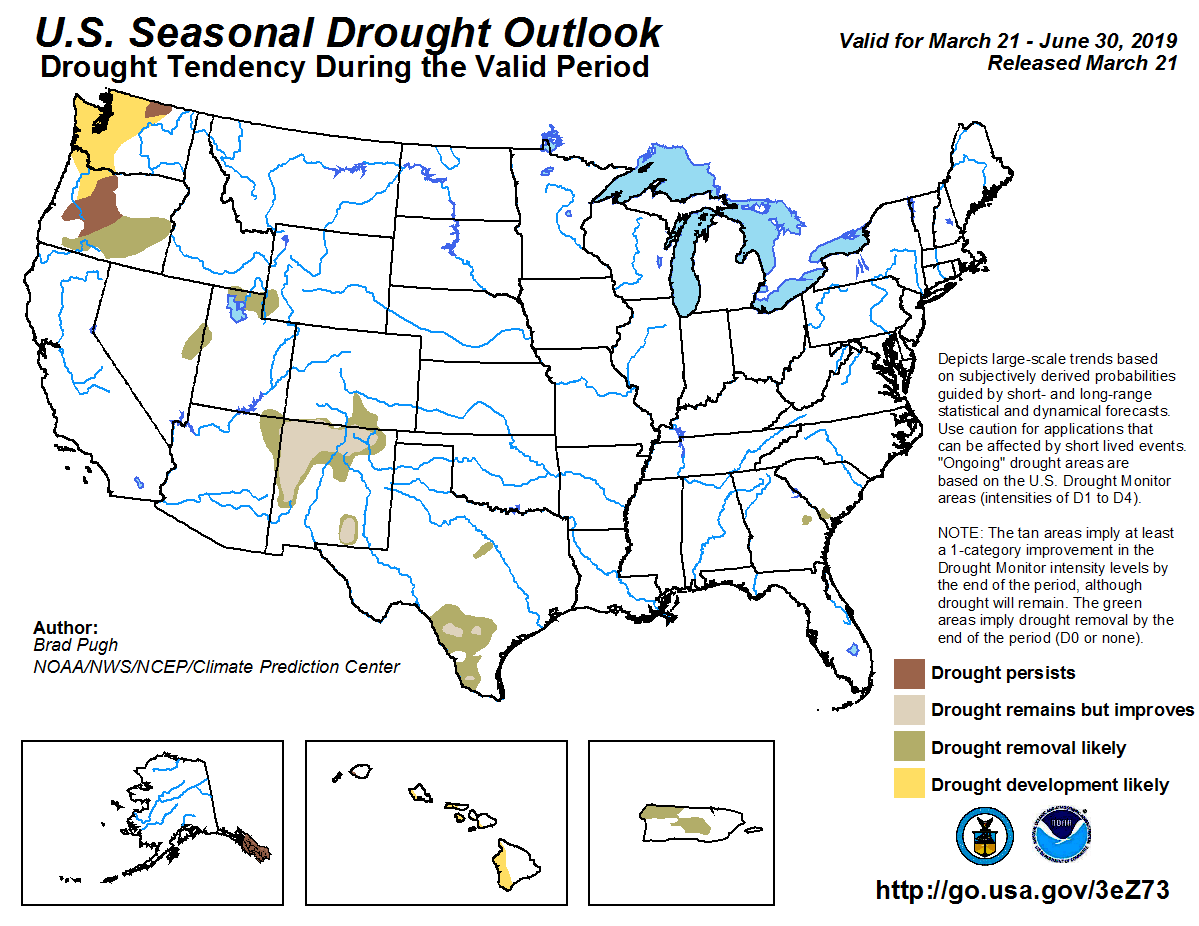
The U.S. Seasonal Drought Outlook through June 30, 2019, suggests drought improvements across the state with remaining drought in south-central Texas (Figure 7).
Author

Robert Mace,
Interim Executive Director & Chief Water Policy Officer at The Meadows Center for Water and the Environment
Robert Mace is a Professor of Practice in the Department of Geography at Texas State University. Robert has over 30 years of experience in hydrology, hydrogeology, stakeholder processes, and water policy, mostly in Texas.