SUMMARY:
-
Large parts of East and Central Texas received more than 10 inches of rain over the past month.
-
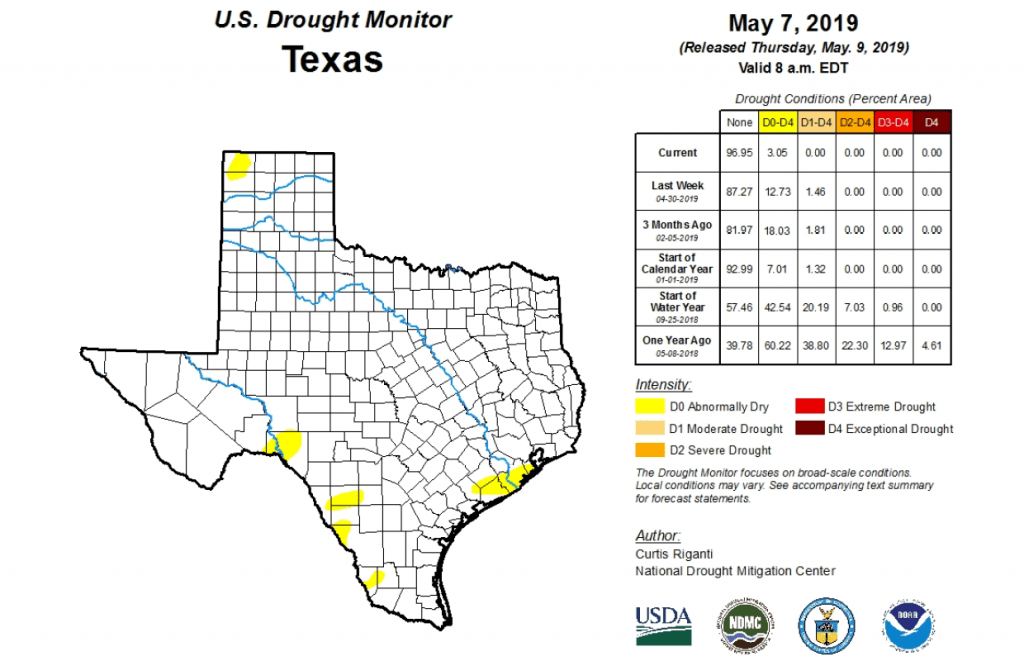
Recent rains have erased drought from the Texas landscape.
-
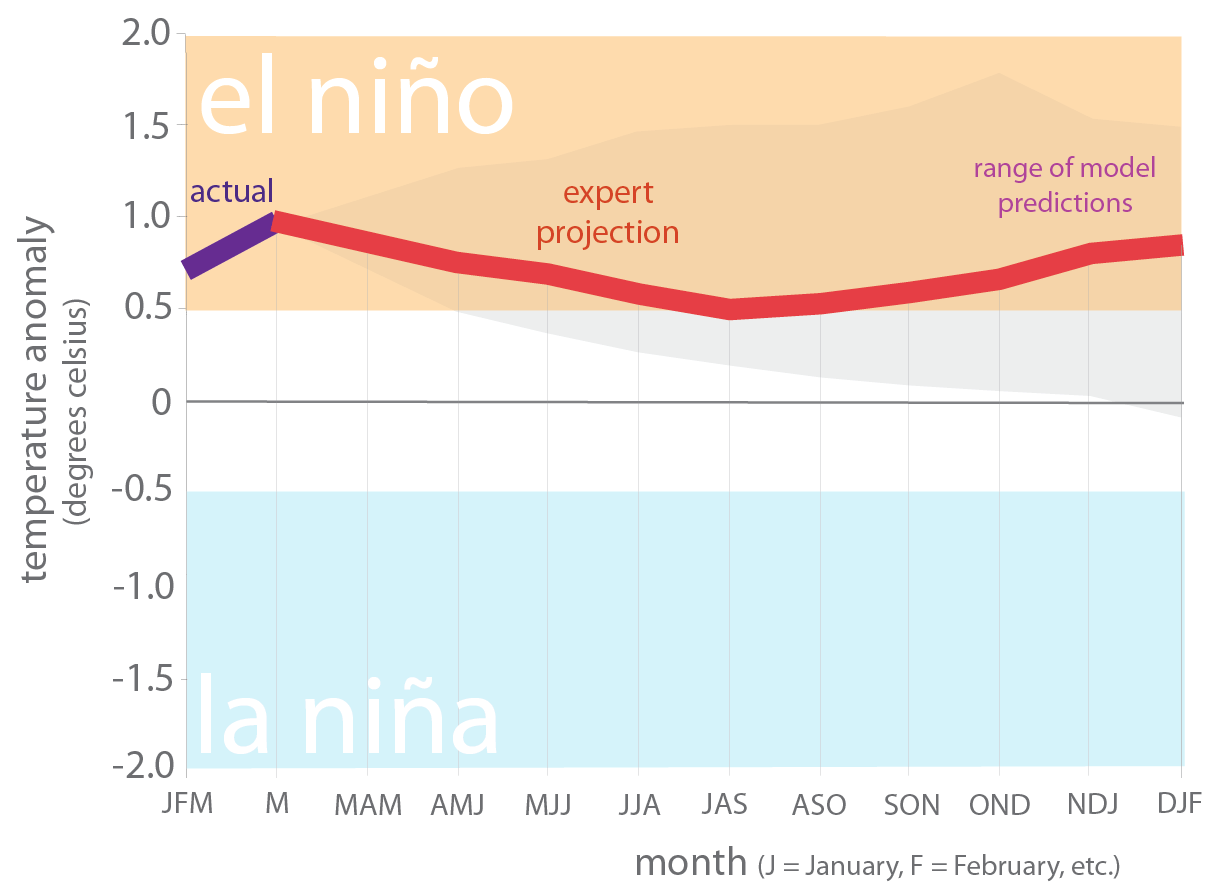
The odds of El Niño staying with us through the summer have increased to 70 percent.
After drought peeked in the window and knocked on the door for several months, in swooped weekly fronts across the state over the past four weeks, topping off reservoirs, flooding rivers, and eliminating drought conditions. Similar rains in New Mexico have swollen the Rio Grande and raised Elephant Butte Reservoir to over 20 percent full—good news for the El Paso area, but still a long way to go to fill the reservoir.
It has been a wet past four weeks! Large sections of the eastern part of the state received at least 10 inches of rain over the part 28 days with an even larger area receiving at least 6 inches. Most of the state has gotten at least 1 inch of rain.

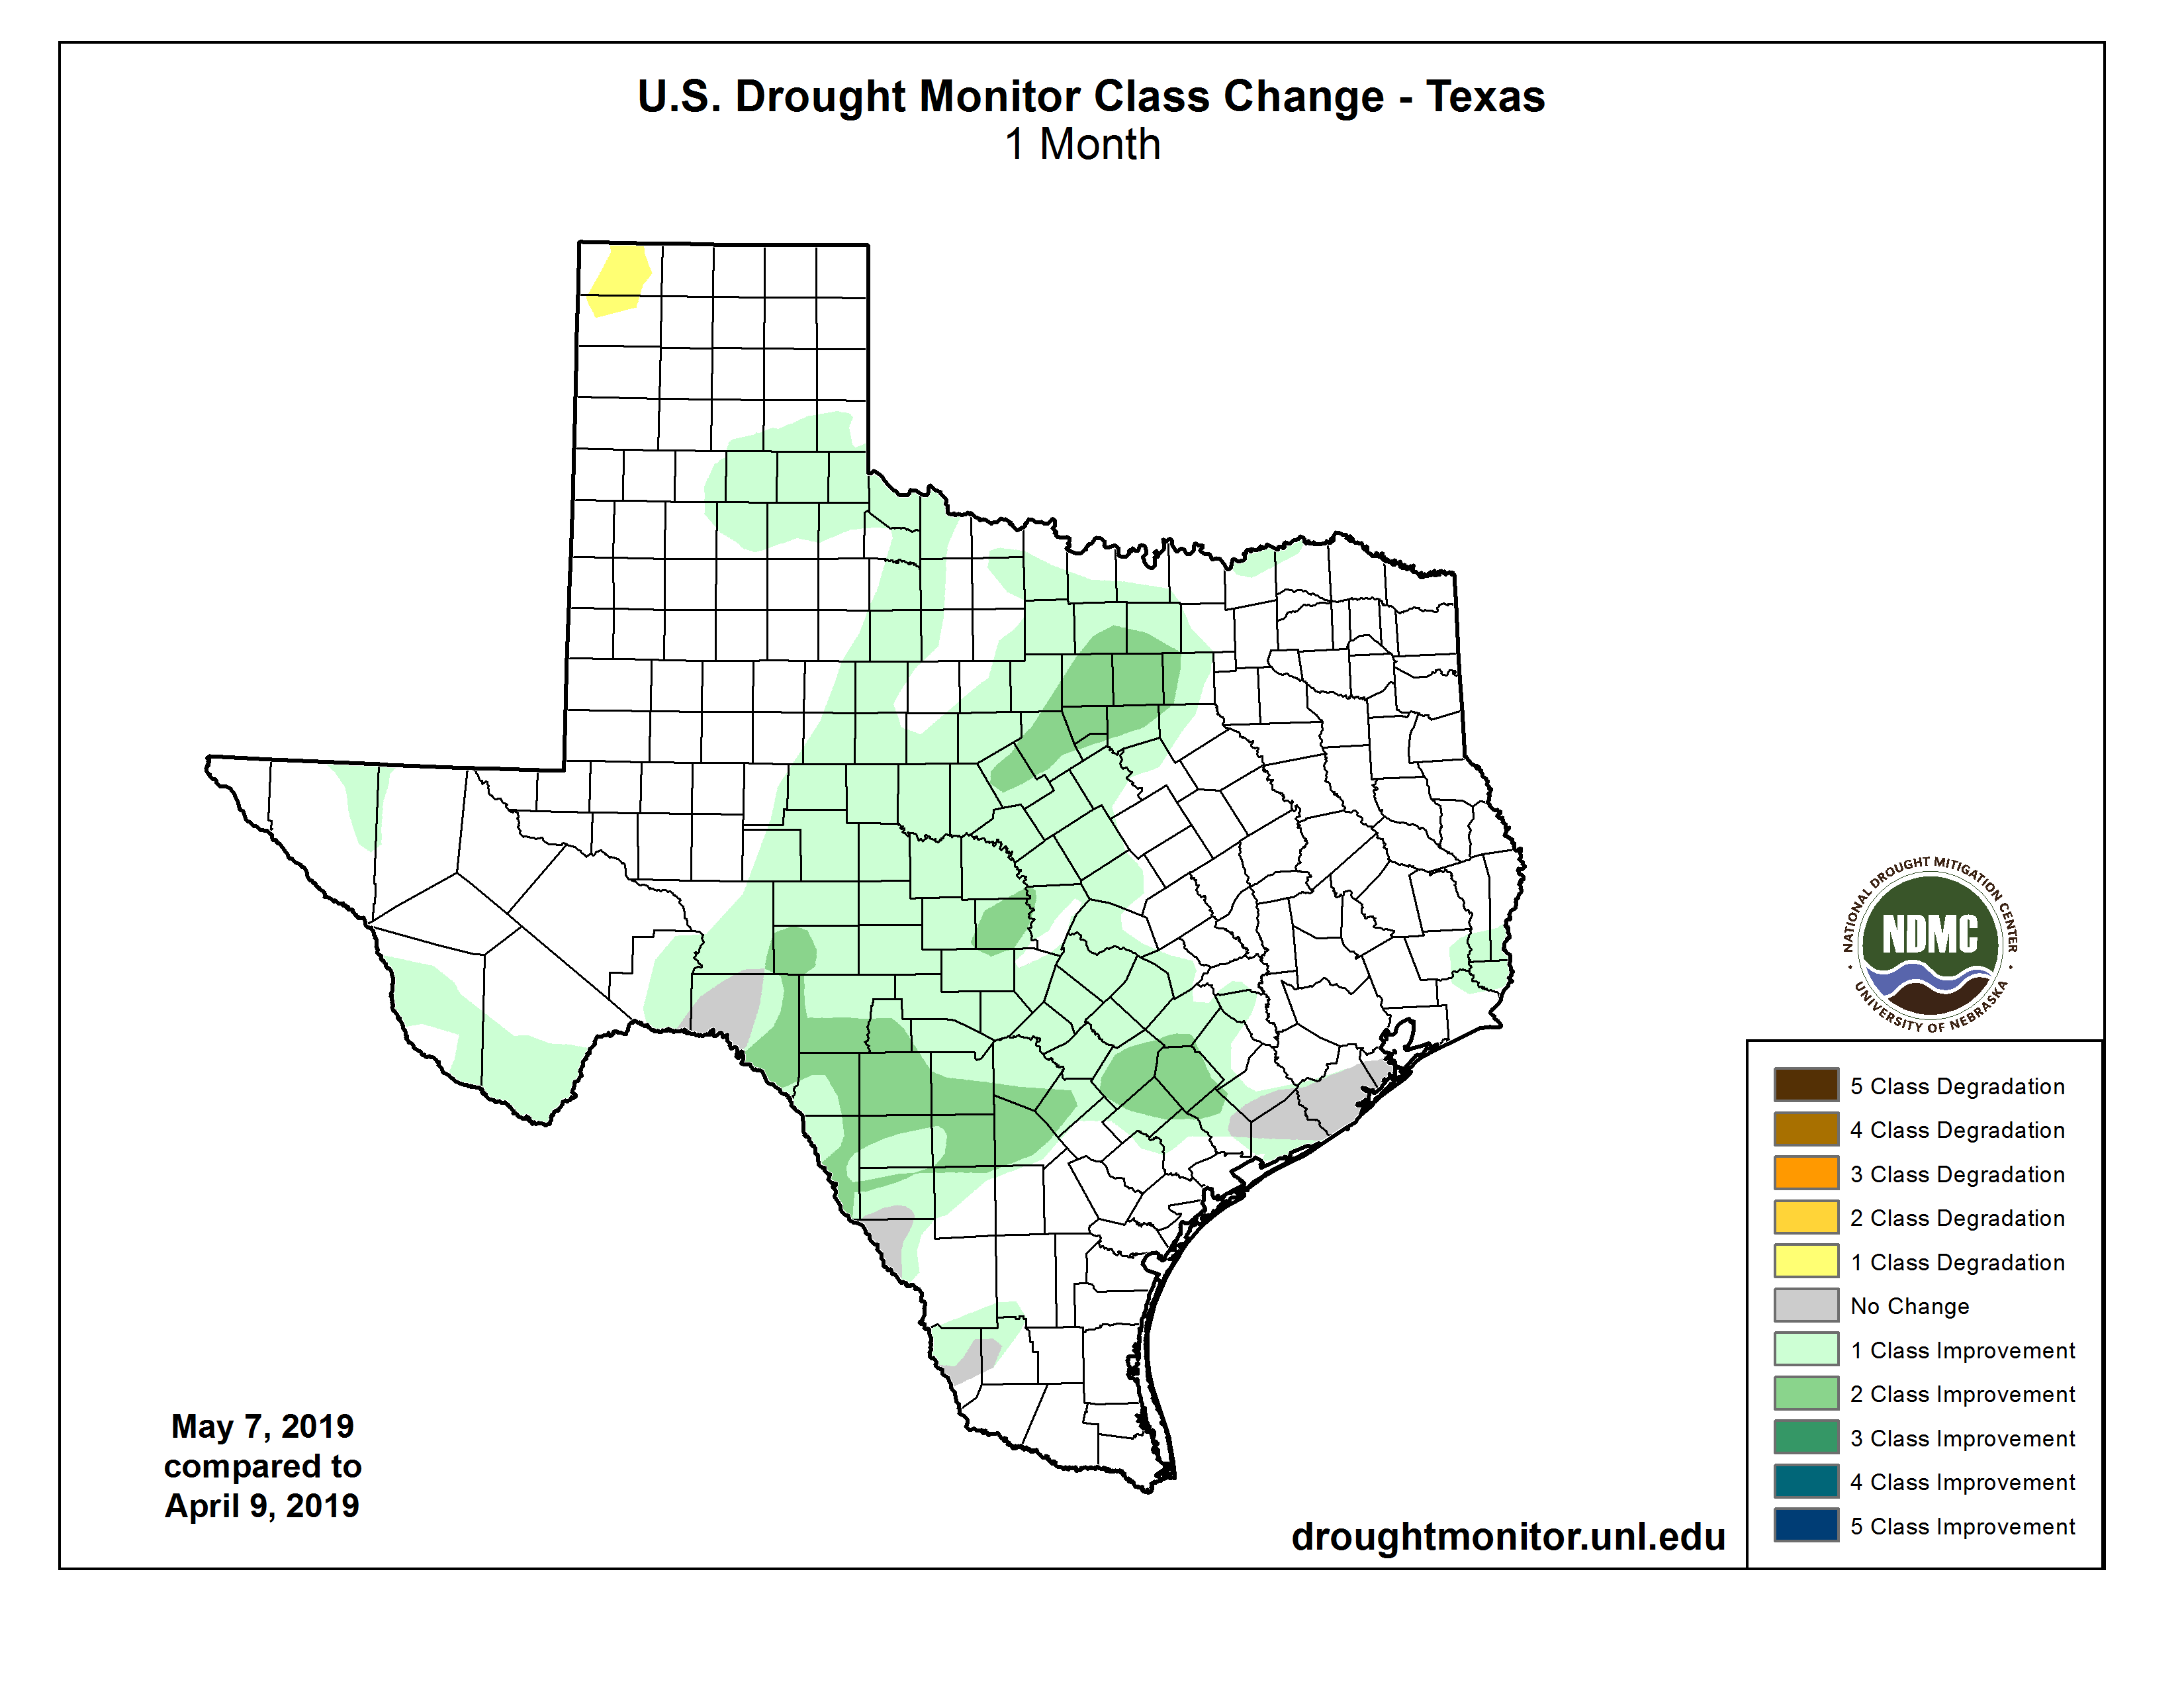
The recent rains have erased drought from the Texas landscape with remnants of abnormally dry areas persisting, as of May 7, south of Houston, near Del Rio, and along a few parts of the Lower Rio Grande Valley (Figure 2a). A new abnormally dry area has appeared up in Dallam and Hartley counties (Figure 2b).

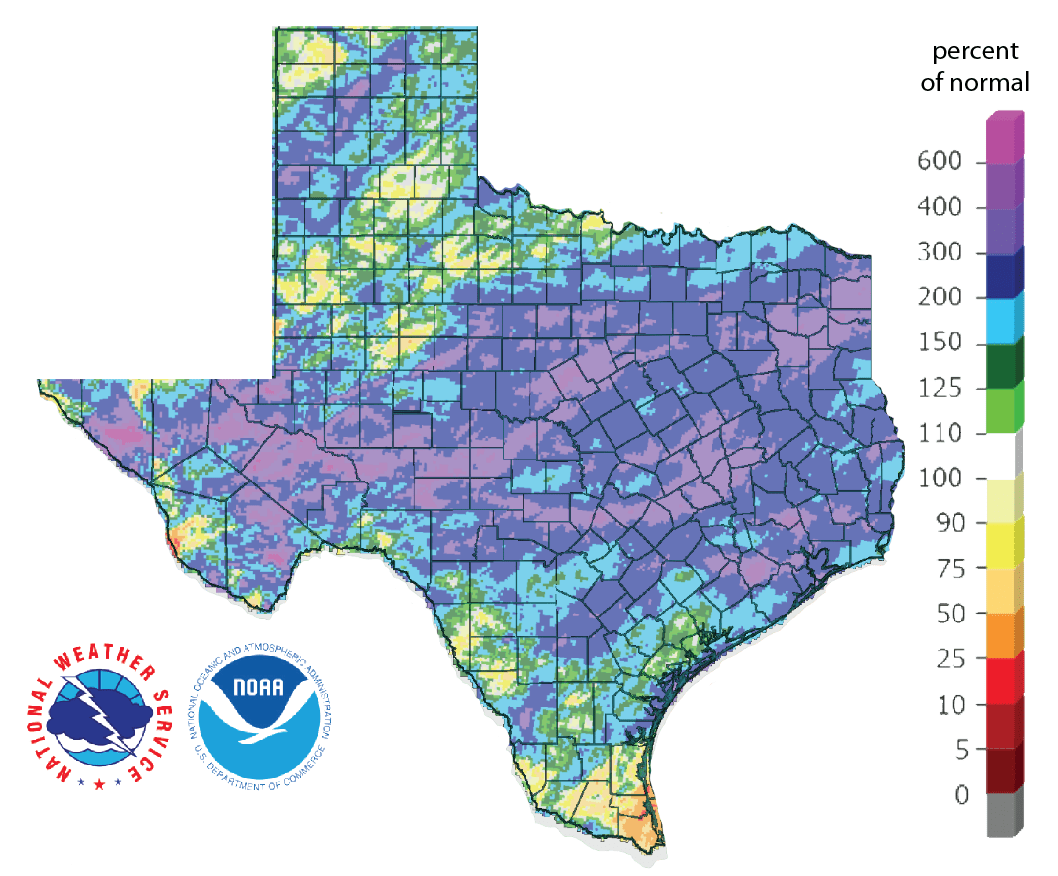
Almost all of the state has received greater than normal rainfall for the past four weeks (Figure 3). About half of the state has received twice as much as normal with a large area receiving three times the normal amount.
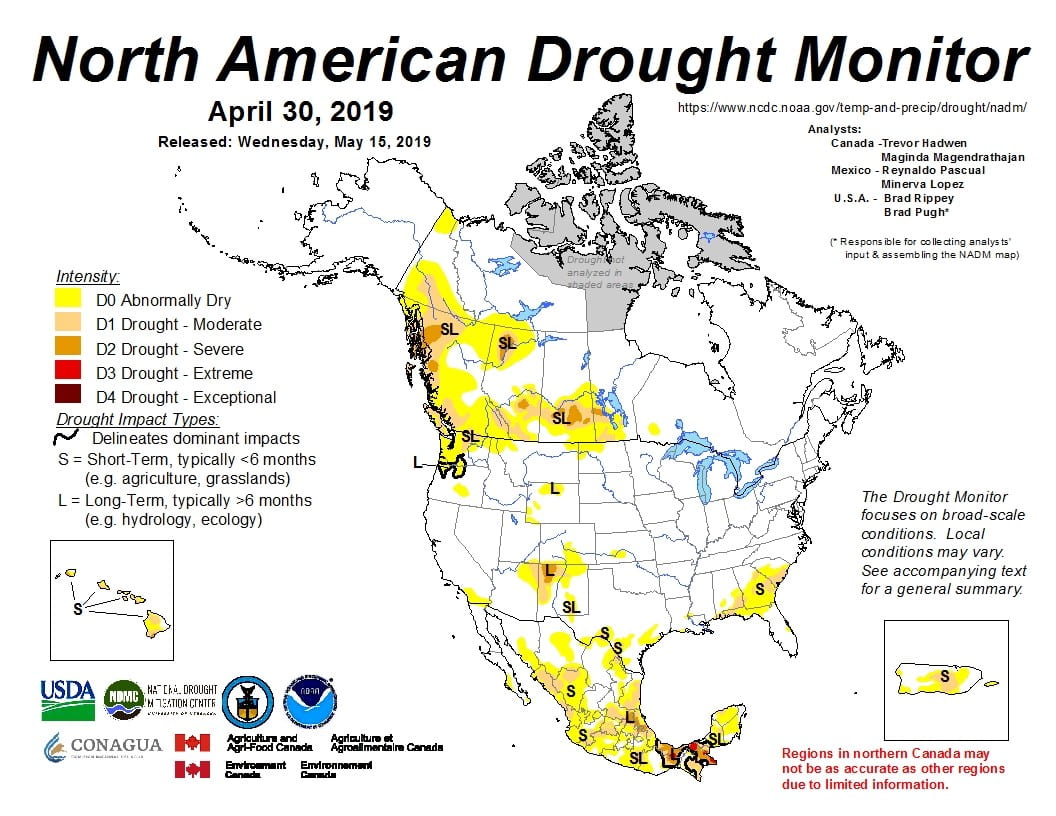
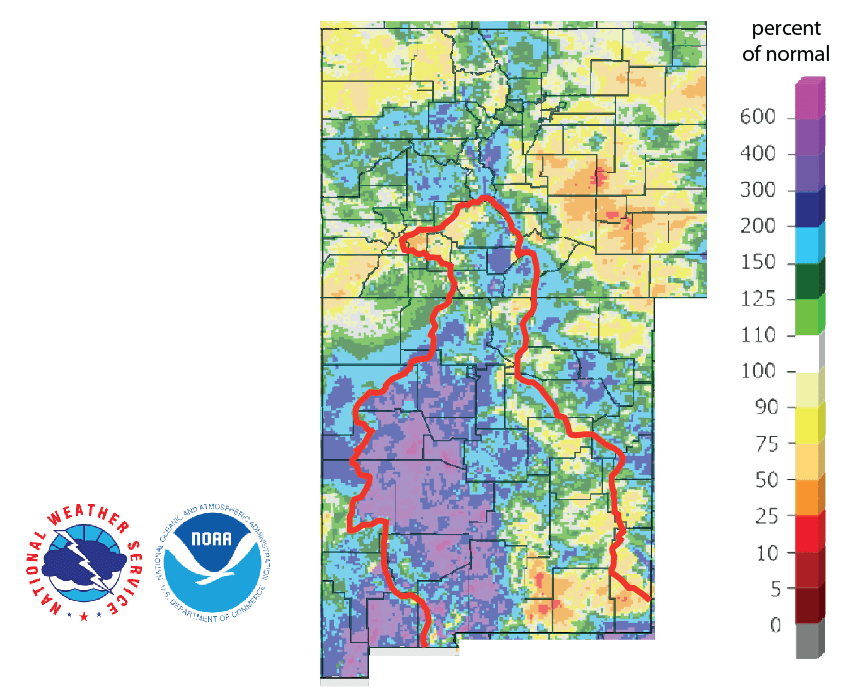
The North American Drought Monitor for the end of April had not yet been released by mid-May when we prepared this summary. April showed major improvements across Texas as well as in the headwaters of the Rio Grande (Figure 4a). Percent of normal precipitation in the Rio Grande watershed in Colorado, the primary source of water for Elephant Butte Reservoir, over the last 30 days shows the results of major rainfalls in the basin resulting in two to three times normal precipitation (Figure 4b).
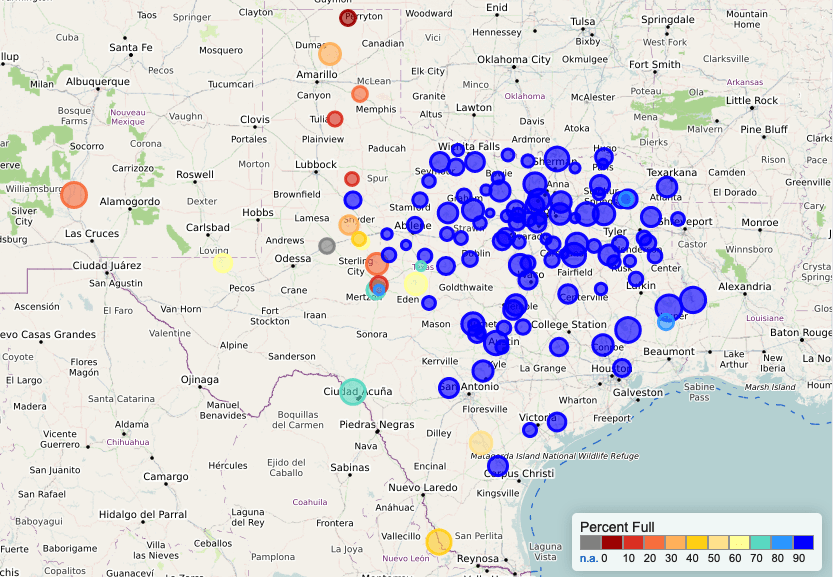
Statewide reservoir storage increased slightly over the past month and remains about 5 percentage points above normal for this time of year (Figure 5a). Percent full status for individual reservoirs this month (Figure 5b) is about the same as last month although Elephant Butte Reservoir is above 20 percent full, up from 13 percent a month ago.

We are still under an El Niño Advisory with a 70 percent chance (up from 65 percent a month ago) of weak El Niño conditions continuing through the summer and a 55 to 60 percent chance through the fall (Figure 6). El Niños generally result in wetter-than-normal and cooler-than-normal conditions for Texas and act as a tropical storm suppressor.
Author
 Robert Mace,
Interim Executive Director & Chief Water Policy Officer at The Meadows Center for Water and the Environment
Robert Mace is a Professor of Practice in the Department of Geography at Texas State University. Robert has over 30 years of experience in hydrology, hydrogeology, stakeholder processes, and water policy, mostly in Texas.