SUMMARY:
- Rainfall continues to be less than normal for this time of year for much of the state.
- Drought coverage remains about the same at 37 percent from four weeks ago.
- The U.S. Seasonal Drought Outlook through April 30, 2020, projects scattered drought-removal across the state but with scattered drought remaining.
I wrote this article on January 17, 2020.
I don’t know about you, but I love me some koalas. They’re fluffy, they’re goofy, and they’re cute. Koalas remind me a wee bit of a herd of balding Albert Einsteins (who, I learned earlier this week, published his first scientific paper on capillarity). The koalas, and other Australians, have been suffering from massive brush fires fueled, in part, by summers that have been getting warmer and warmer since the 1980s (Figure 1a) and an associated decrease in rainfall over the same period (Figure 2b). Although we don’t have native koalas here in Texas, we do share with Australia (1) a love of barbecue and (2) a susceptibility to wildfire. For example, during our one-year drought of record in 2011, we suffered from 31,453 wildfires resulting in 4 million burned acres and 2,947 lost homes (source). In comparison, the recent fires in Australia resulted in 27 million burned acres and the loss of over 2,300 homes (source).
The Texas A&M Forest Service monitors wildfire in Texas and has a web-app for Texans to assess their risk. For example, the Hill Country in West Austin has beautiful views but also has a high to very high wildfire risk (Figure 1c). As it turns out, much of Texas is susceptible to wildfires (Figure 1d), and climate scientists expect that risk to grow. Using the web-app, you can enter your address to see what the risk is to your property, see if you are in a community protection zone, and get tips on how to increase your wildfire resiliency.
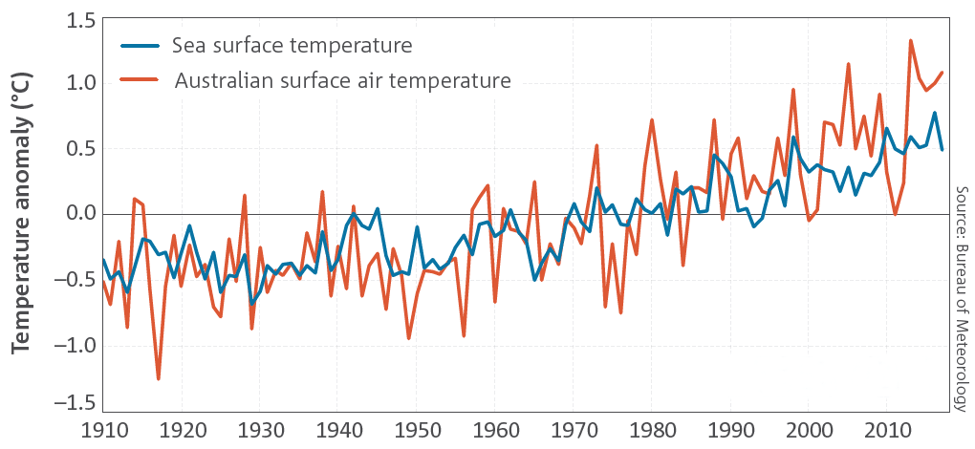
Figure 1a: Anomalies in long-term average temperatures in Australia from 1910 to present (source).
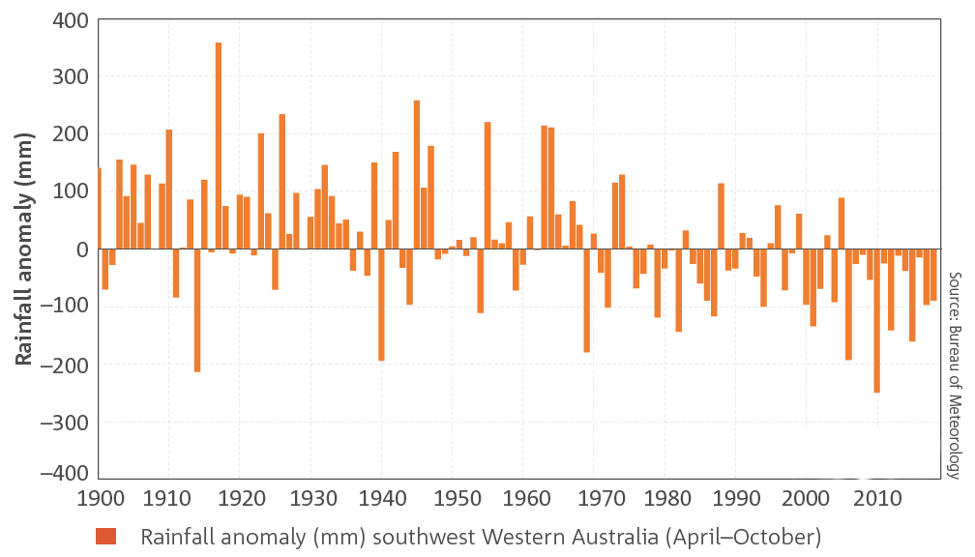
Figure 1b: Anomalies in rainfall in southwest Western Australia from 1900 to present (source).
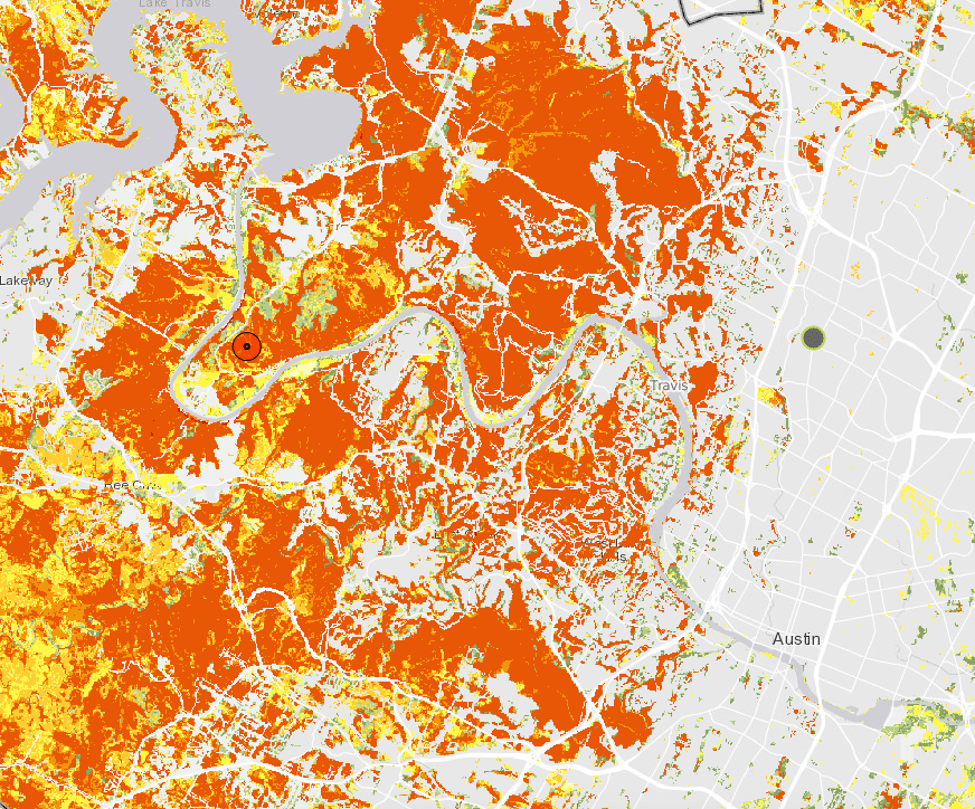
Figure 1c: Wildfire risk for a part of Austin (source).

Figure 1d: Wildfire risk for Texas (source).
Although Texas has benefitted from some rain over the past 30 days (Figure 2a), rainfall continues to be less than normal for this time of year for much of the state (Figure 2b). The Panhandle, North Texas, and the Corpus Christi areas saw higher-than-normal amounts of rainfall while Big Bend, Far West Texas, and parts of South Texas received less than 25 percent of normal rainfall (Figure 2b). Looking at precipitation over the past 90 days—a good proxy for drought—we see that much of the state still suffers from lower-than-normal rainfall (Figure 2c).
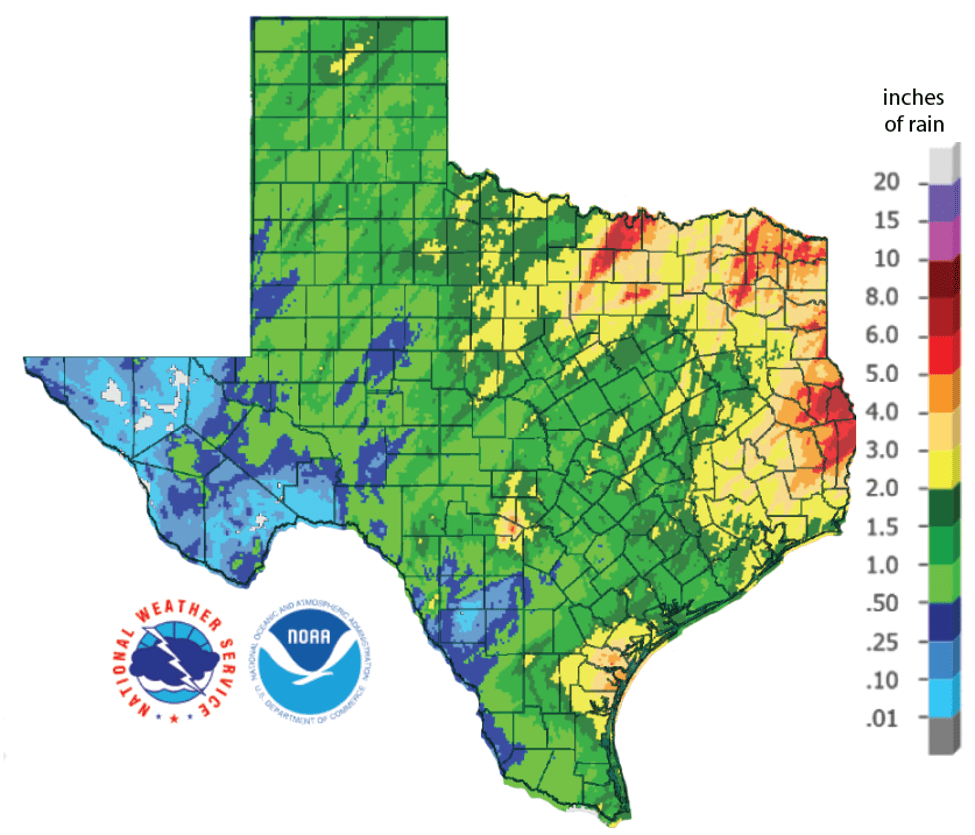
Figure 2a: Inches of precipitation that fell in Texas in the 30 days before January 17, 2020 (source). Note that cooler colors indicate lower values and warmer indicate higher values.
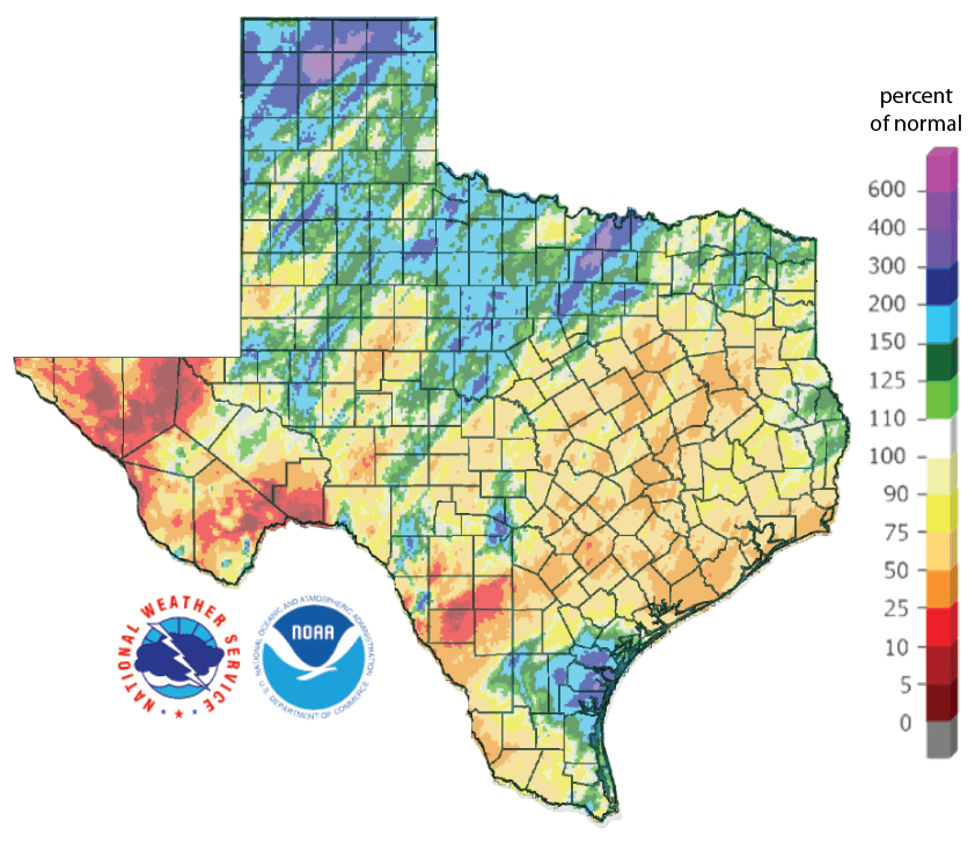
Figure 2b: Rainfall as a percent of normal for the past 30 days (as of January 17, 2020; source).
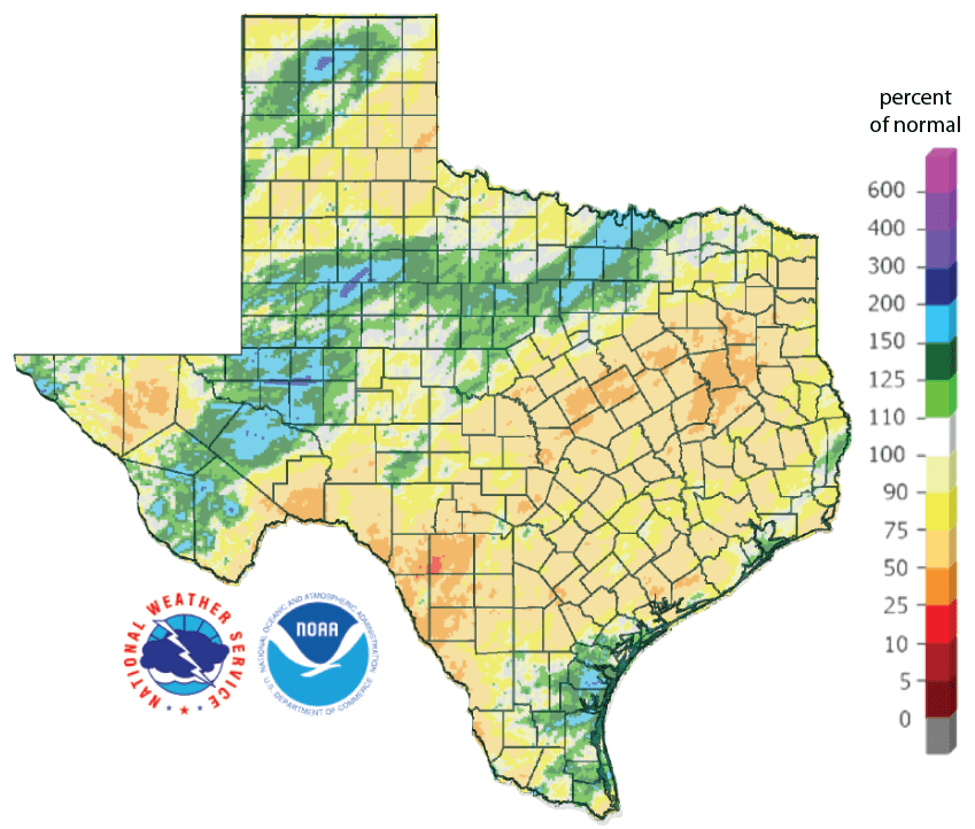
Figure 2c: Rainfall as a percent of normal for the past 90 days (as of January 17, 2020; source).
Drought coverage remained about the same at 37 percent from four weeks ago (and increased two percentage points from our last report), with 55 percent of the state either abnormally dry or in drought (Figure 3a). Extreme drought has expanded in the Uvalde-Zavala county area and has remained in the Llano area (Figure 3a). We saw drought improvement in Corpus Christi area based on the previously discussed rainfall and a smattering of improvement and intensification across the drought area (Figure 3b).
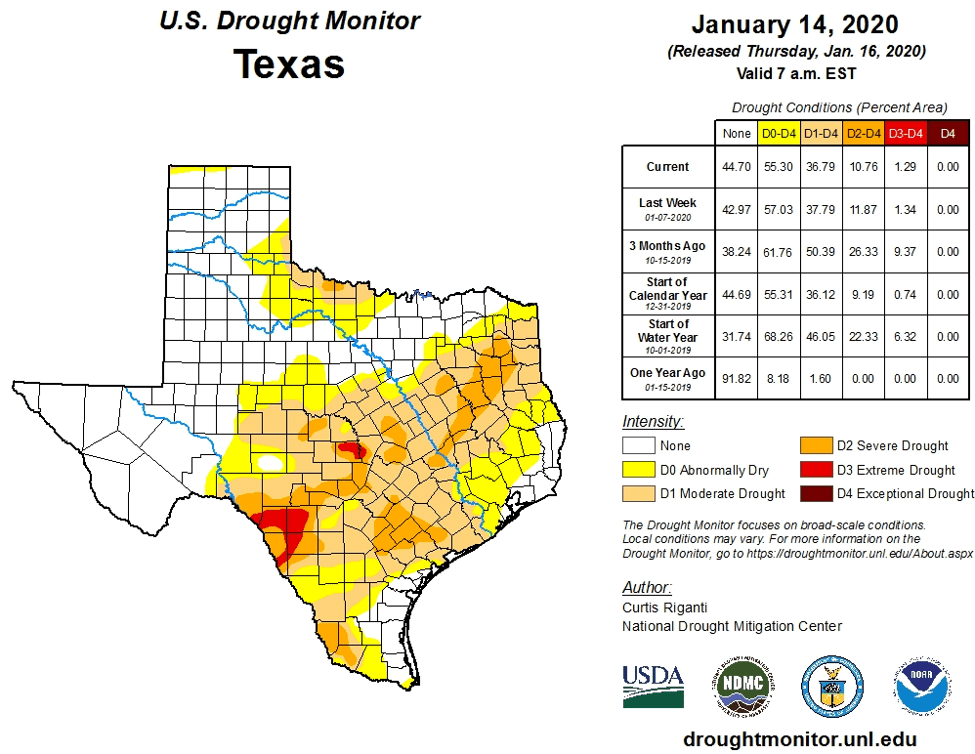
Figure 3a: Drought conditions in Texas according to the U.S. Drought Monitor (as of January 14, 2020; source).
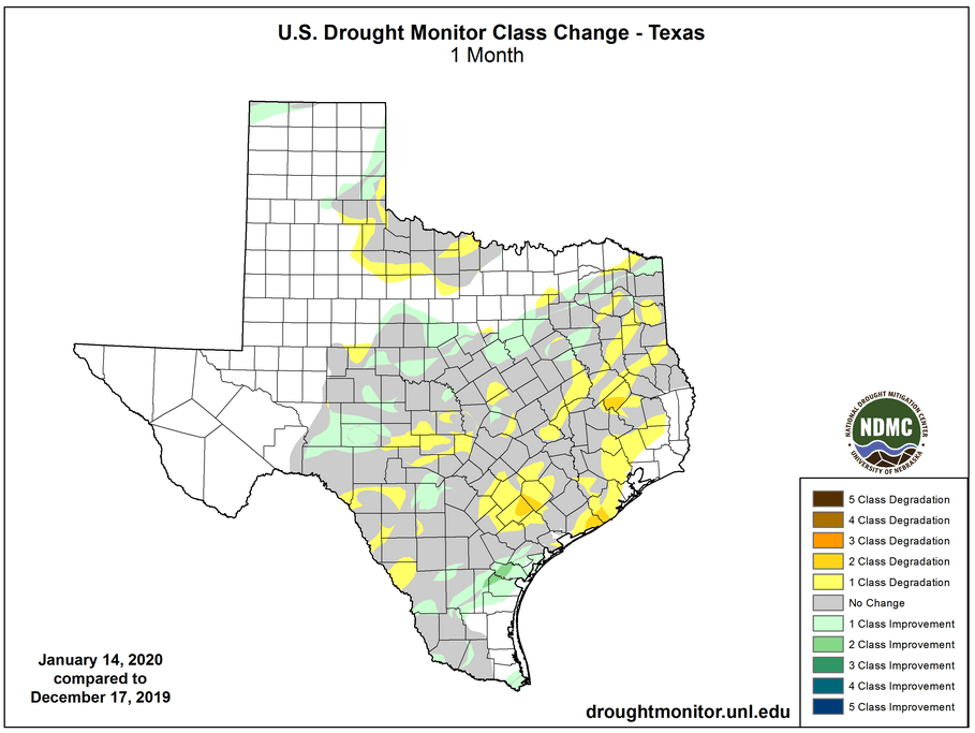
Figure 3b: Changes in the U.S. Drought Monitor for Texas between December 10, 2019, and January 14, 2020 (source).
The North American Drought Monitor for December continues to show severe drought in the headwaters of the Rio Grande in southern Colorado, a significant source of water for Elephant Butte Reservoir (Figure 4a). Percent of normal precipitation in the Rio Grande watershed in Colorado over the last 90 days is less than 50 percent of normal for much of the watershed (Figure 4b). The Rio Conchos basin in Mexico, an important source of water to the lower part of the Rio Grande in Texas, is out of drought with a small area of abnormally dry conditions at the southern end of the basin (Figure 4a).
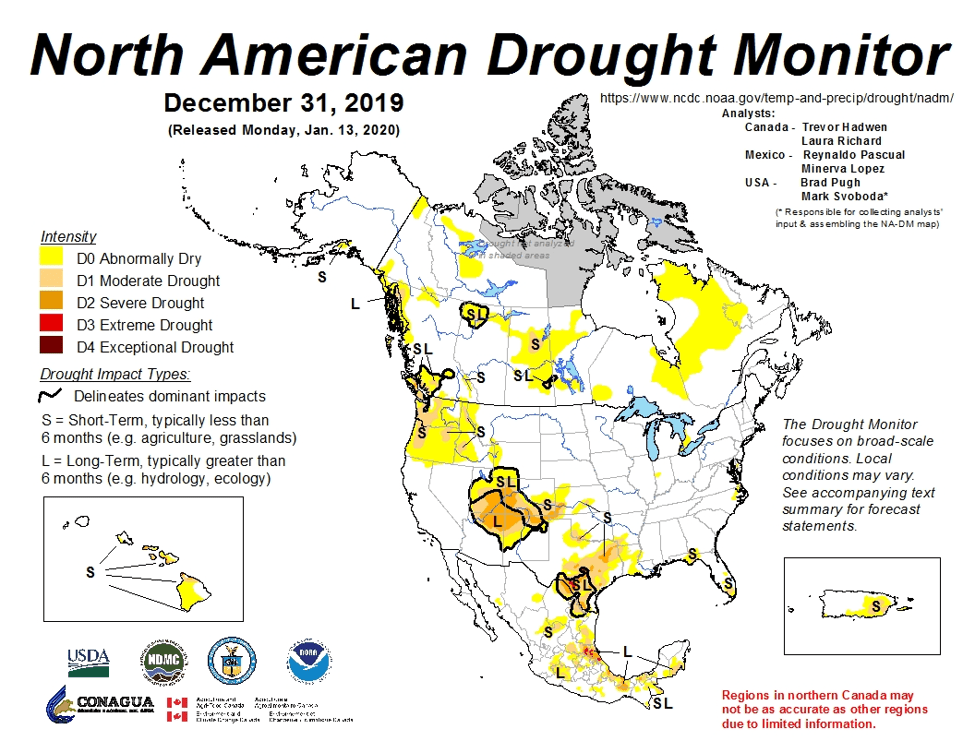
Figure 4a: The North American Drought Monitor for December 31, 2019 (source).
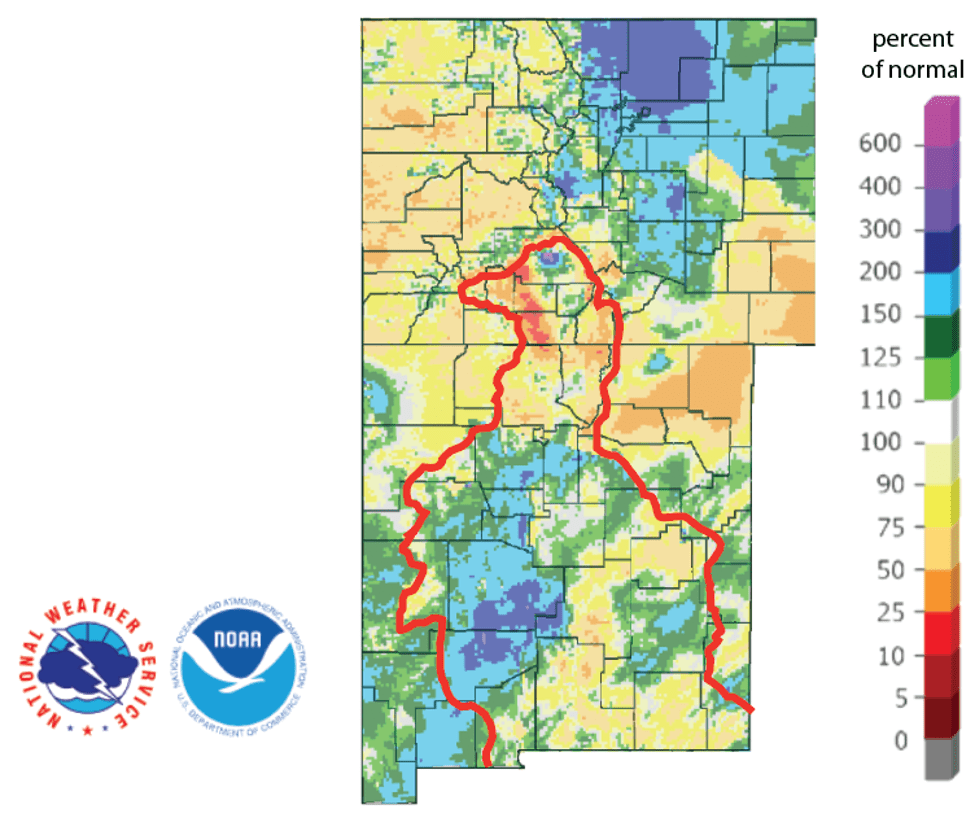
Figure 4b: Percent of normal precipitation for the past 90 days for Colorado and New Mexico as of January 17, 2020 (source). The red line is the Rio Grande Basin. I use this map to see check precipitation trends in the headwaters of the Rio Grande in southern Colorado, the main source of water to Elephant Butte Reservoir downstream.
Statewide reservoir storage increased about one percentage point since last month and currently sits at 82.3 percent, right at the median storage since 1990 for this time of year (Figure 5a). Storage in individual reservoirs remained relatively stable over the past month (Figure 5b). Lake Georgetown has decreased from full in July to 69 percent full today but has stayed level since October (Figure 5c).
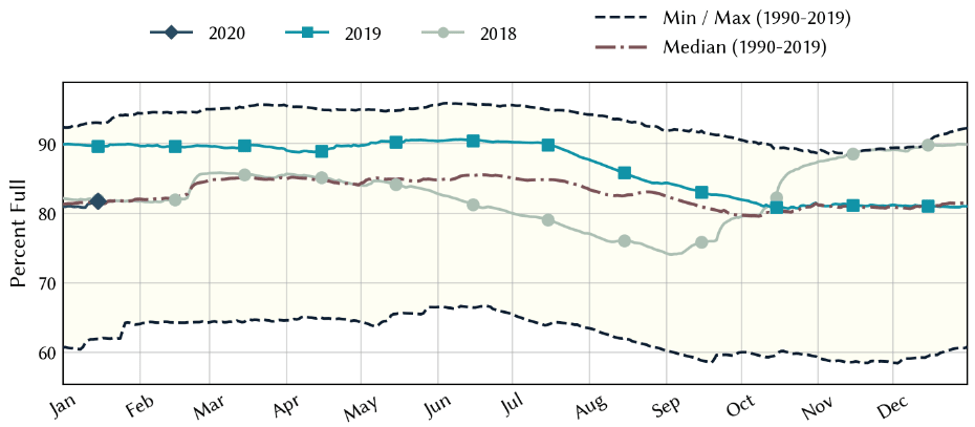
Figure 5a: Statewide reservoir storage since 2018 compared to statistics (median, min, and max) for statewide storage since 1990 (source).
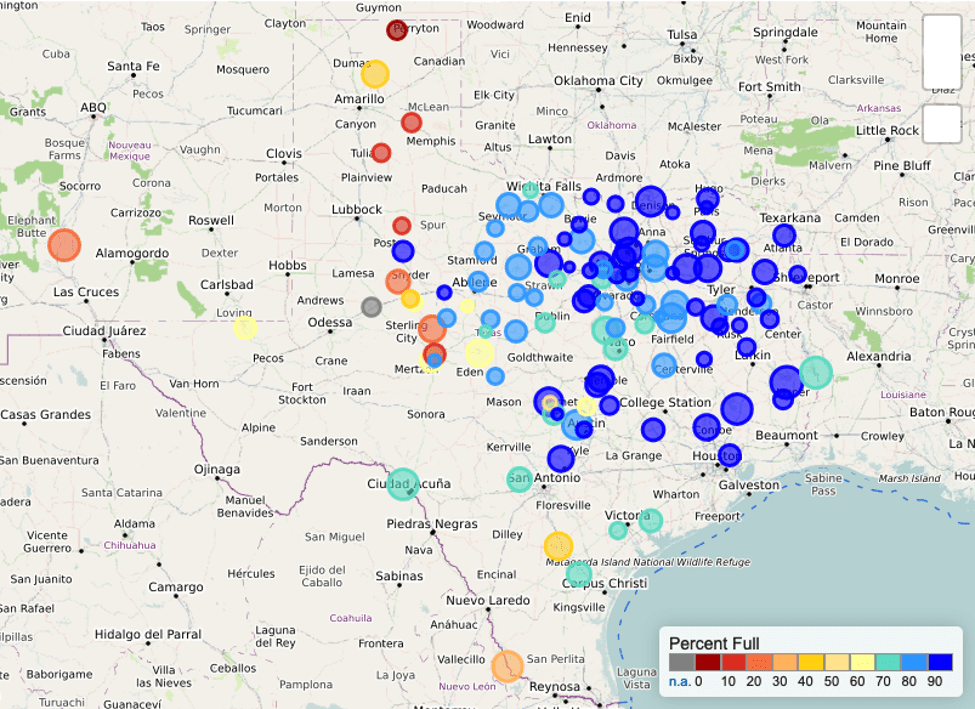
Figure 5b: Reservoir storage as January 17, 2020, in the major reservoirs of the state (source).
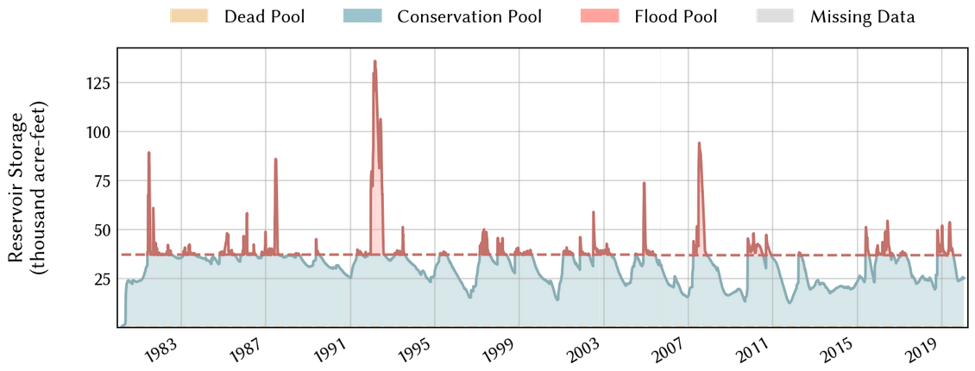
Figure 5c: Reservoir storage in Lake Georgetown since the early 1980s (source).
For the El Niño Southern Oscillation, we remain in neutral (La Nada) conditions (Figure 6). The Climate Prediction Center decreased the chances of neutral conditions continuing through the spring from a 65-percent chance a month ago to about a 60 percent chance as the sea surface flirts with El Niño temperatures. The Center just released a prediction for the summer with a 50 percent chance of neutral conditions.
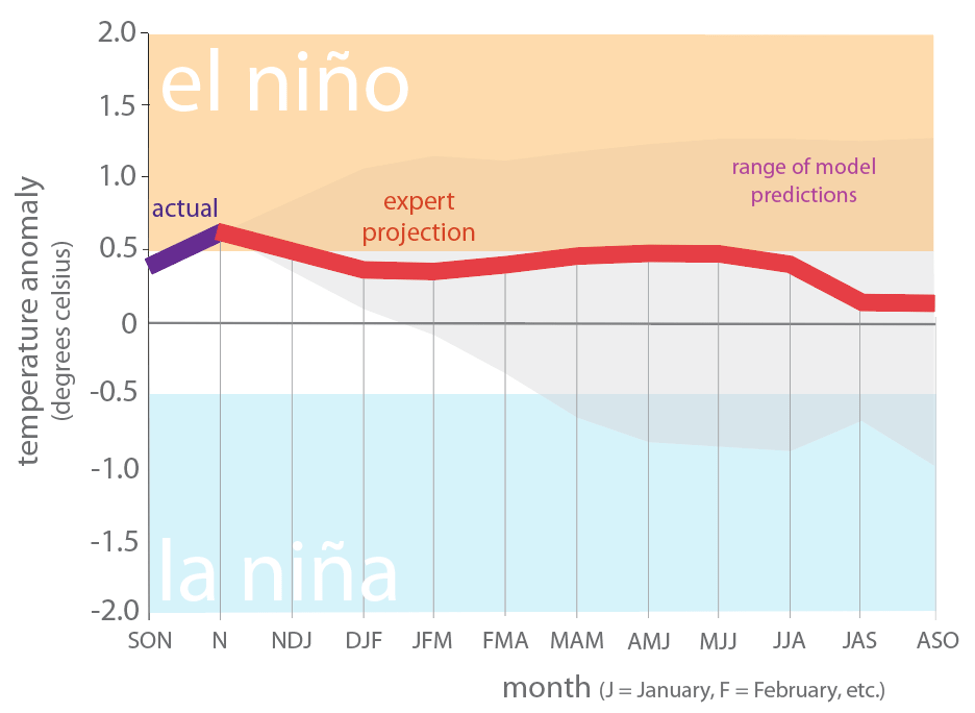
Figure 6. Forecasts of sea surface temperature anomalies for the Niño 3.4 Region as of December 19, 2019 (modified from source).
The U.S. Seasonal Drought Outlook through April 30, 2020 is rosier than last month with projections of scattered drought-removal across the state, but scattered drought remaining (Figure 7).
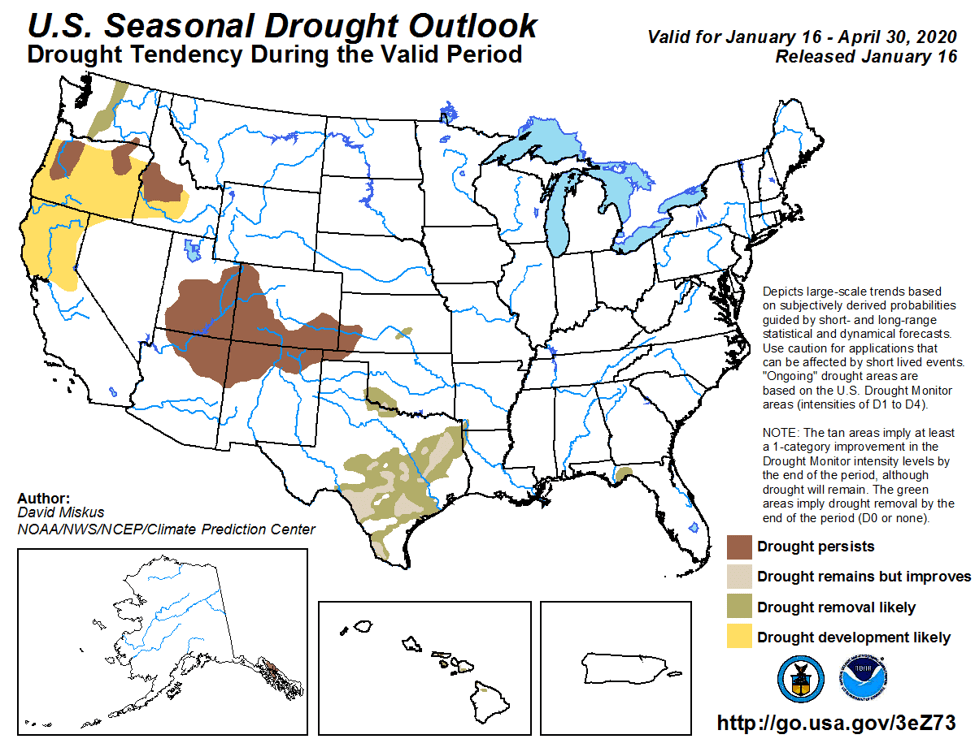
Figure 7: The U.S. Seasonal Drought Outlook for January 16, 2019, through April 30, 2020 (source).
Author

Robert Mace
Interim Executive Director & Chief Water Policy Officer at The Meadows Center for Water and the Environment
Robert Mace is the Interim Executive Director and the Chief Water Policy Officer at The Meadows Center. He is also Professor of Practice in the Department of Geography at Texas State University. Robert has over 30 years of experience in hydrology, hydrogeology, stakeholder processes, and water policy, mostly in Texas.