SUMMARY:
- Last year was the 17th warmest and the 62nd driest in Texas for our 125-year record.
- Almost half of the state — the southeastern half — remains at least abnormally dry.
- The next three months are projected to be warmer than normal with most of the state having an equal chance of drier-than-normal and wetter-than-normal conditions.
I wrote this article on February 16, 2020.
The numbers weren’t out last month to do a year-in-review, but I have them this month — hot off the press! Speaking of hot, globally, 2019 was the second warmest year recorded since 1880 (Figure 1a). For the contiguous United States, 2019 wasn’t a remarkedly warm year, but still clocked in as the 34th warmest year out of the 125-year record (Figure 1b). For Texas, last year was the 17th warmest for our 125-year record (Figure 1c). Rainfall in Texas for 2019 came in almost right in the middle of the record with the 64th wettest and 62nd driest year (Figure 1d).
As reported in Texas Climate News, 2020 started off with the warmest January on record for the planet. Here in Texas, Texas Climate News identified 52 new daily highs set in January with 44 ties. Statewide, January 2020 came in as the 11th warmest January on record. More long-term, the last five years in Texas have been the warmest and wettest on record.

Figure 1a: Temperature anomalies since 1880 for global land and ocean temperatures (source).
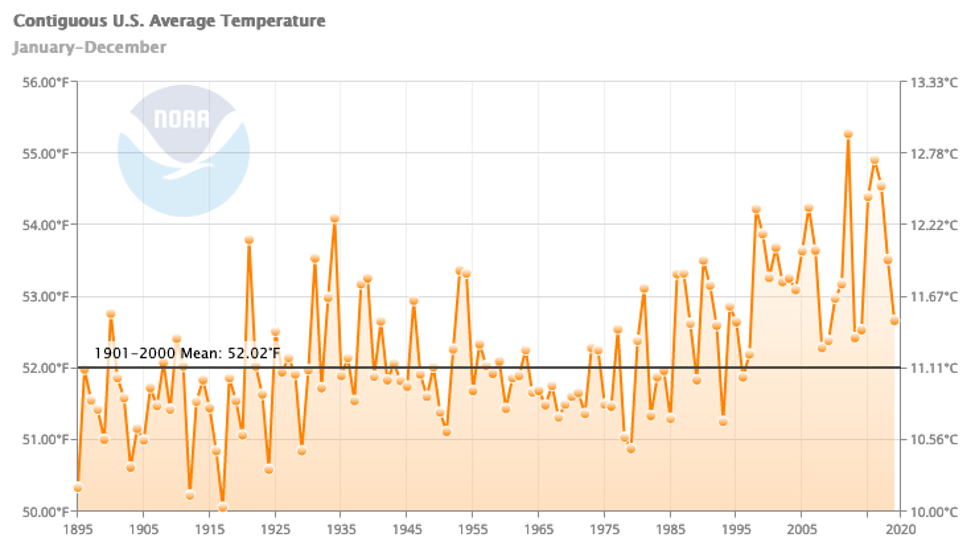
Figure 1b: Average annual temperatures in the contiguous United States since 1895 (source).

Figure 1c: Average annual temperatures in Texas since 1895 (source).
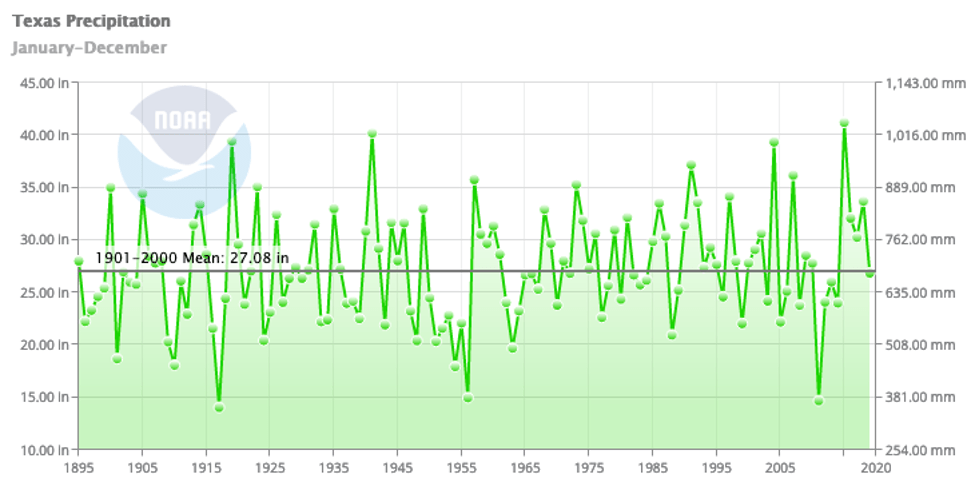
Figure 1d: Average annual precipitation in Texas since 1895 (source).
Several fronts that passed through over the past month striped the state with two inches or more of rainfall with our soppy cousins to the northeast receiving their traditional abundance relative to everyone else (Figure 2a). As a result, there were haves and have-nots with parts of the state receiving twice as much rainfall as normal and others receiving less than 25 percent of normal (Figure 2b). Much of the Rio Grande Valley received less than half the normal rainfall although the El Paso area saw more than its normal amount (Figure 2b). Much of the state is still below normal rainfall-wise over the past 90 days, particularly the southeastern half of the state (Figure 2c).
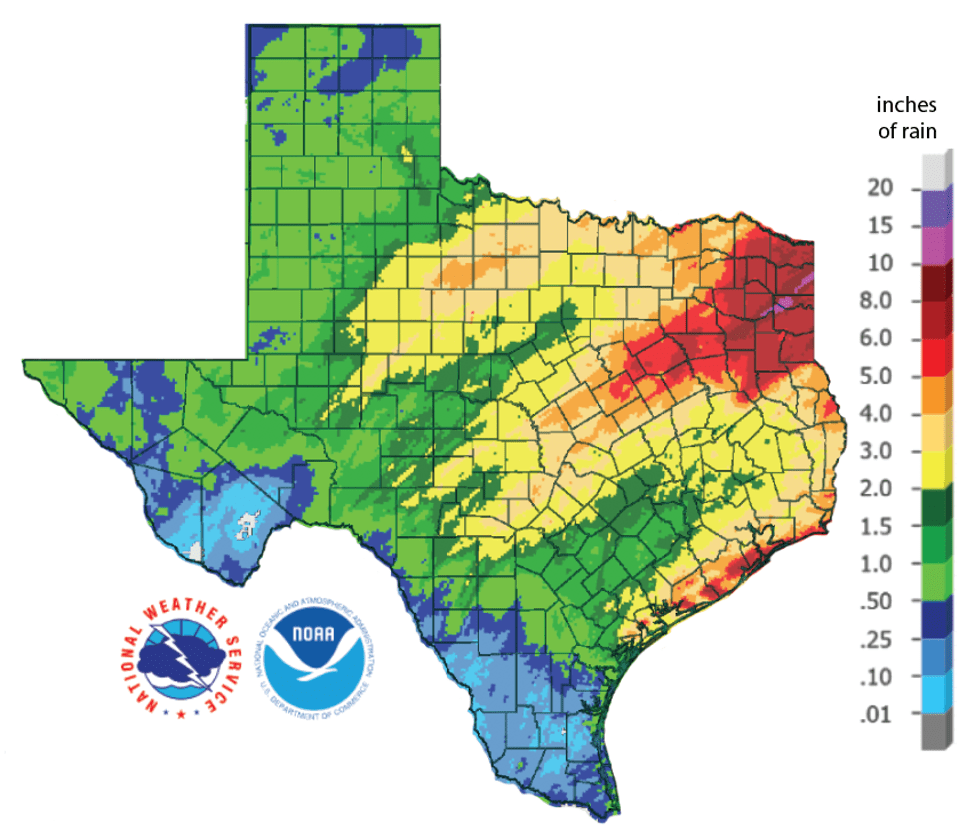
Figure 2a: Inches of precipitation that fell in Texas in the 30 days before February 16, 2020 (source). Note that cooler colors indicate lower values and warmer indicate higher values.
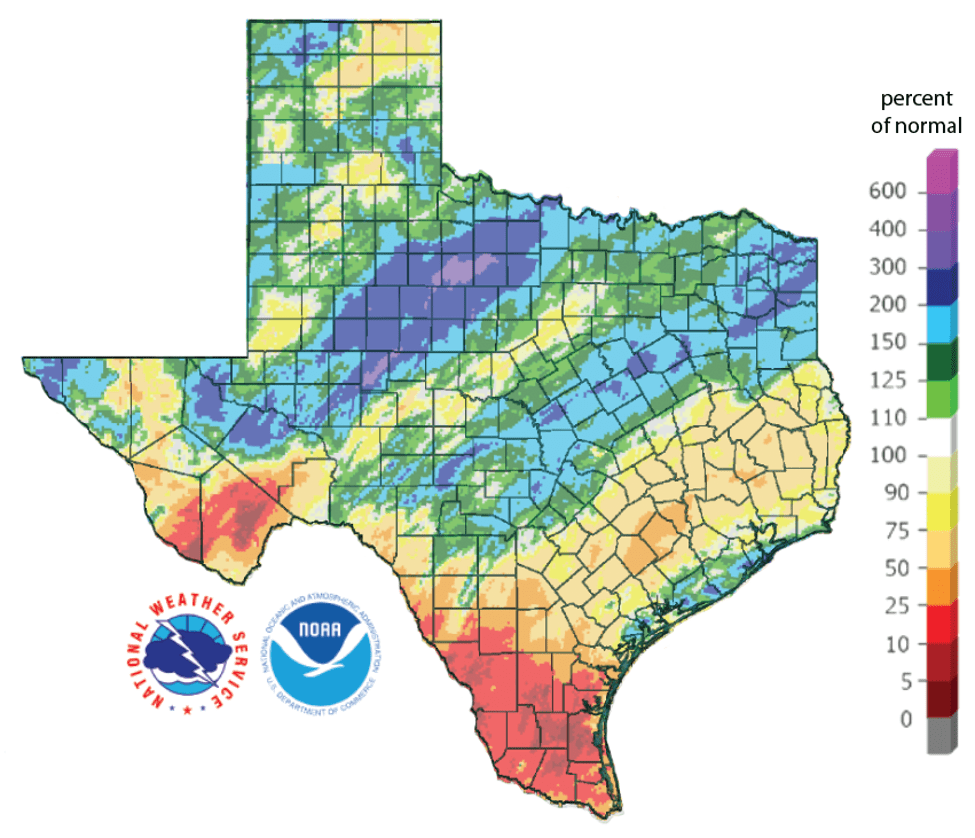
Figure 2b: Rainfall as a percent of normal for the past 30 days (as of February 16, 2020; source).
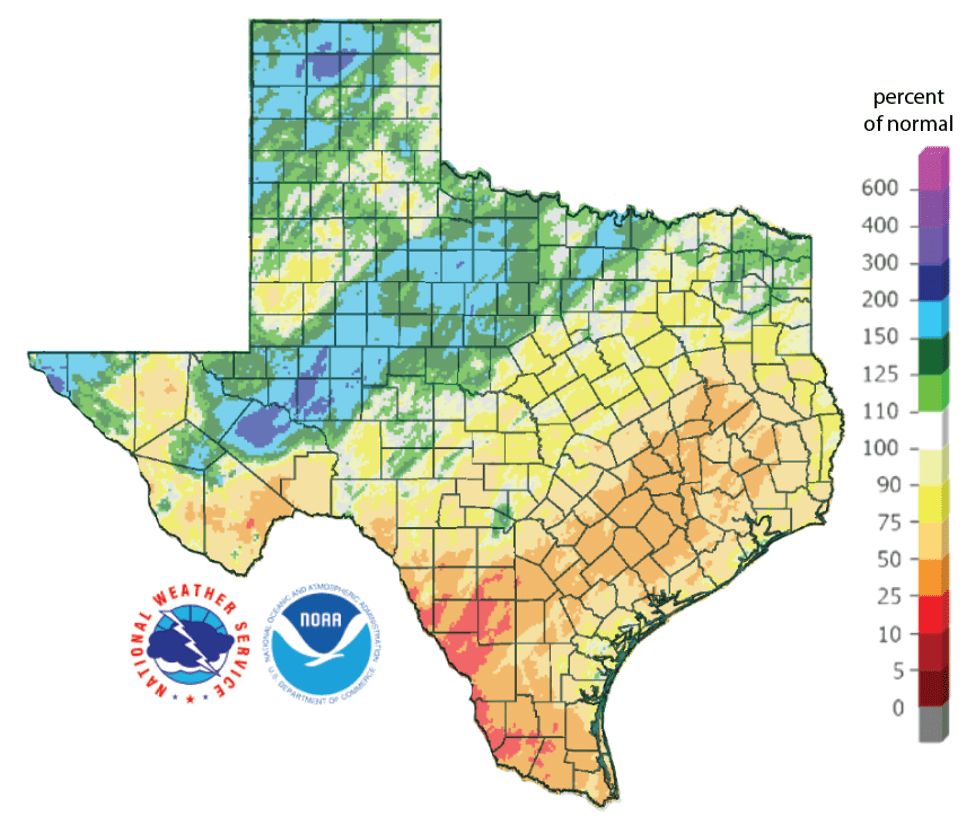
Figure 2c: Rainfall as a percent of normal for the past 90 days (as of February 16, 2020; source).
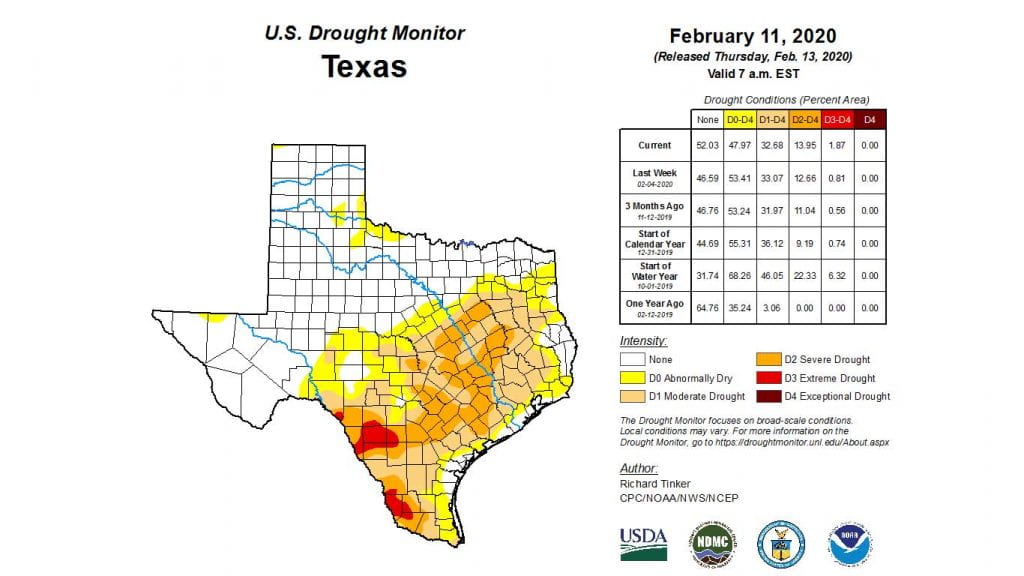
The amount of the state under drought conditions (D1-D4) decreased from 37 percent four weeks ago to 33 percent today (Figure 3a) thanks to rains in the northwestern part of the state (Figure 3b). Extreme drought conditions have shifted slightly in the Del Rio area and developed in the upper reaches of the Lower Rio Grande Valley (Figure 3a). About 48 percent of the state is abnormally dry or worse (D0-D4; Figure 3a).
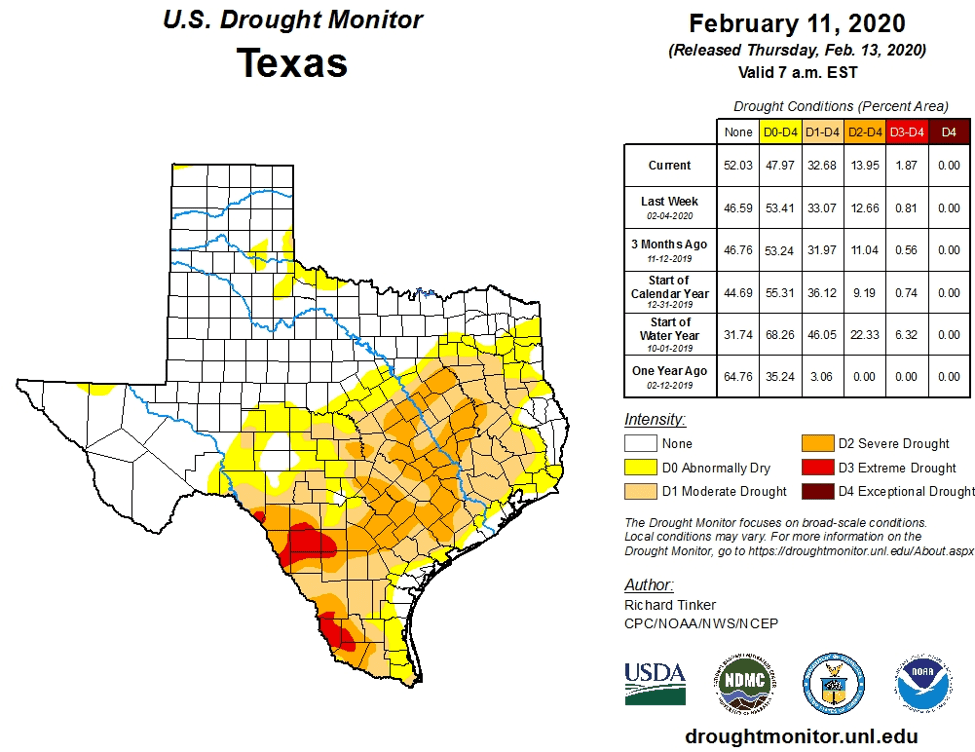
Figure 3a: Drought conditions in Texas according to the U.S. Drought Monitor (as of February 11, 2020; source).
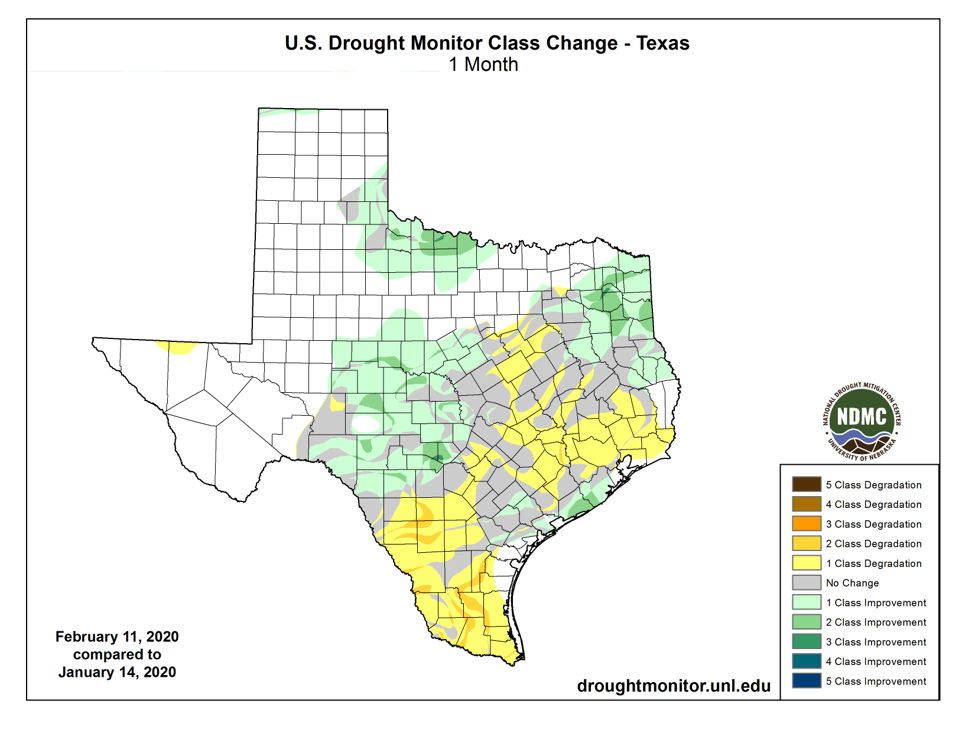
Figure 3b: Changes in the U.S. Drought Monitor for Texas between January 14, 2020, and February 11, 2020 (source).
The North American Drought Monitor for December continues to show severe drought in the headwaters of the Rio Grande in southern Colorado, a significant source of water for Elephant Butte Reservoir which is, in turn, a significant source of water for the El Paso area (Figure 4a). Precipitation in the Rio Grande watershed in Colorado over the last 90 days is less than 50 percent of normal for much of the watershed; however, much of the basin in New Mexico received greater than normal rainfalls (Figure 4b) bringing Elephant Butte Reservoir up to 30.7 percent full. The Rio Conchos basin in Mexico, an important source of water to the lower part of the Rio Grande in Texas, has a small area of abnormally dry conditions at the southeastern end of the basin (Figure 4a).
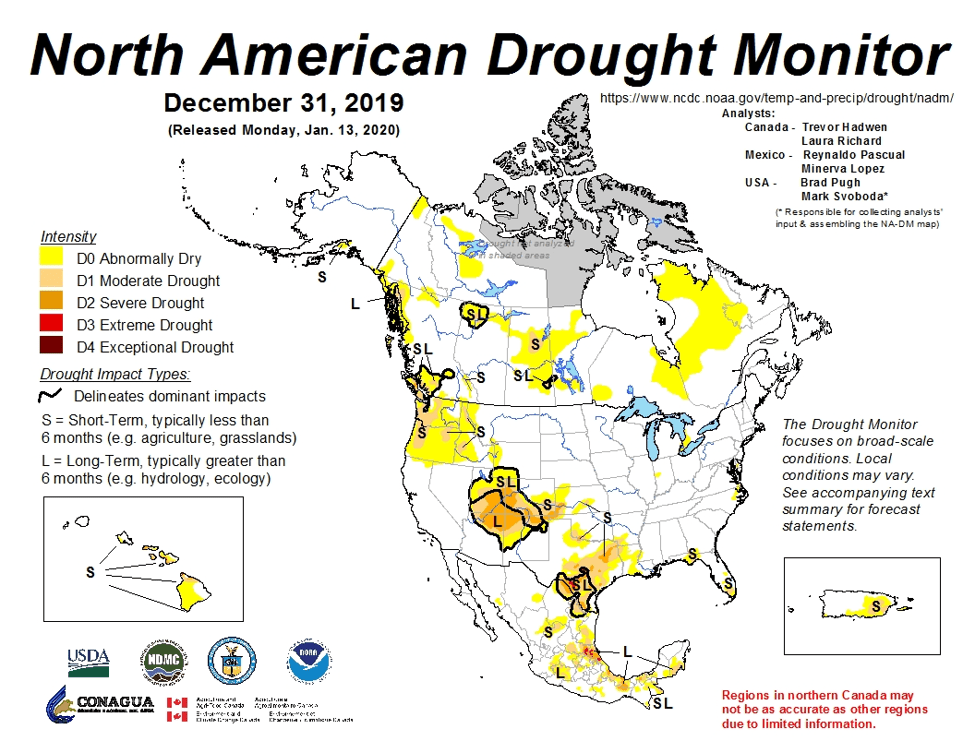
Figure 4a: The North American Drought Monitor for December 31, 2019 (source).
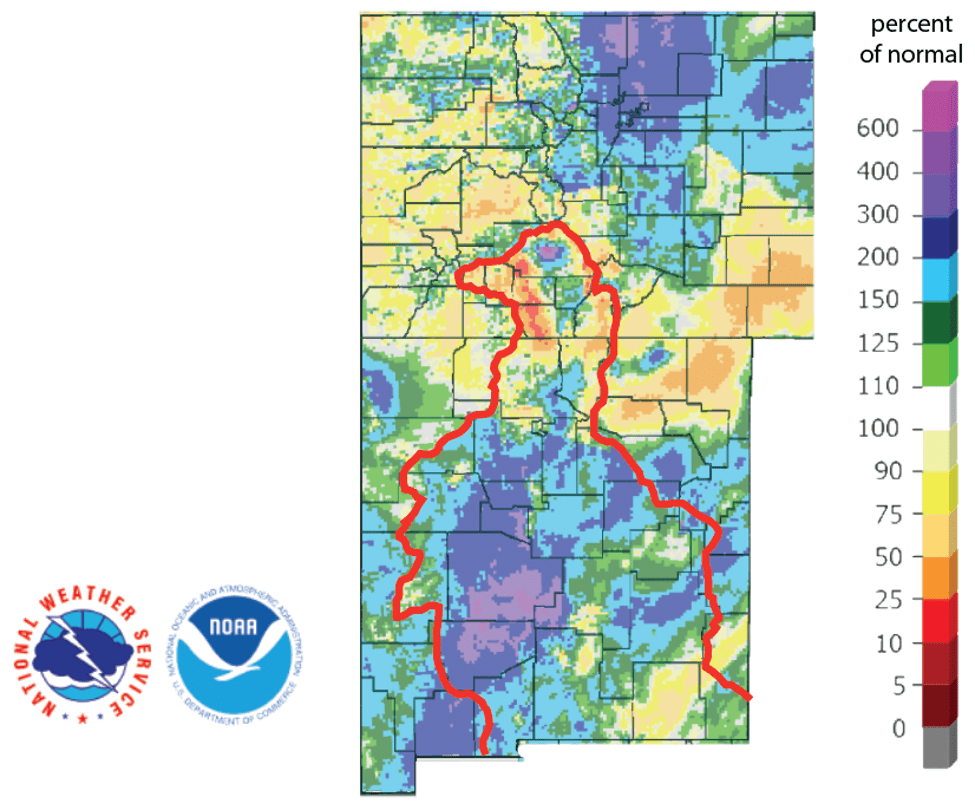
Figure 4b: Percent of normal precipitation for the past 90 days for Colorado and New Mexico as of February 16, 2020 (source). The red line is the Rio Grande Basin. I use this map to see check precipitation trends in the headwaters of the Rio Grande in southern Colorado, the main source of water to Elephant Butte Reservoir downstream.
Statewide reservoir storage increased about three percentage points since last month and currently sits at 84.9 percent full, a couple points above the median storage since 1990 for this time of year (Figure 5a). Storage in individual reservoirs remained relatively stable over the past month (Figure 5b). Choke Canyon Reservoir is at 44.5 percent full but still hasn’t returned to pre-2011 drought levels (Figure 5c).
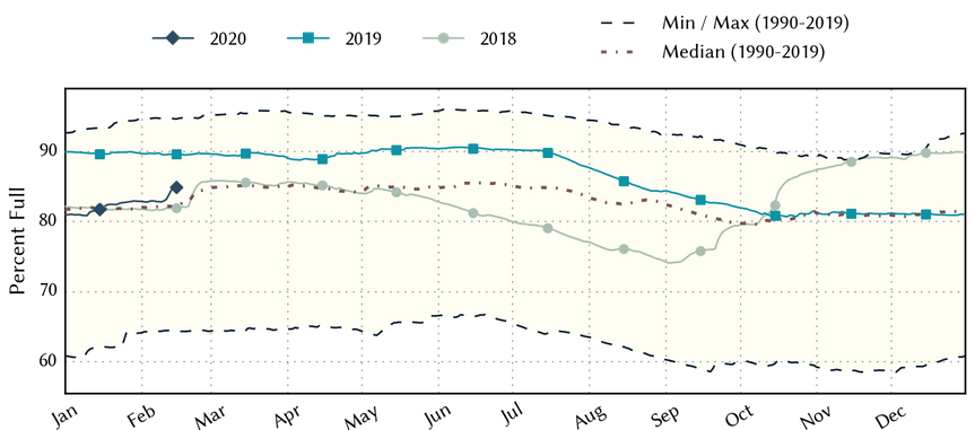
Figure 5a: Statewide reservoir storage since 2018 compared to statistics (median, minimum and maximum) for statewide storage since 1990 (source).
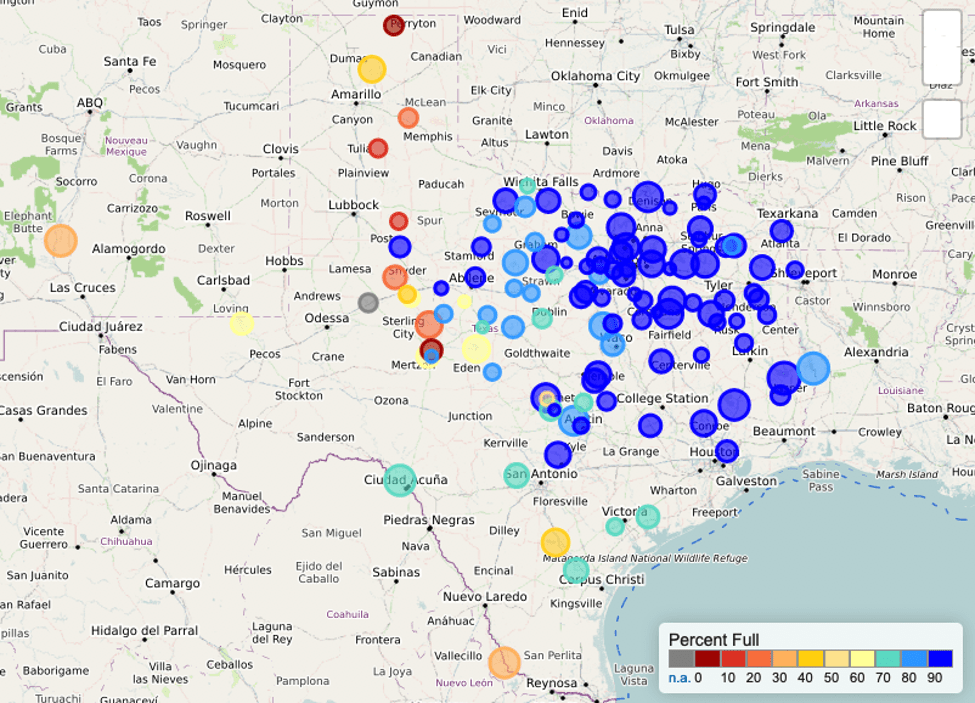
Figure 5b: Reservoir storage as February 16, 2020, in the major reservoirs of the state (source).
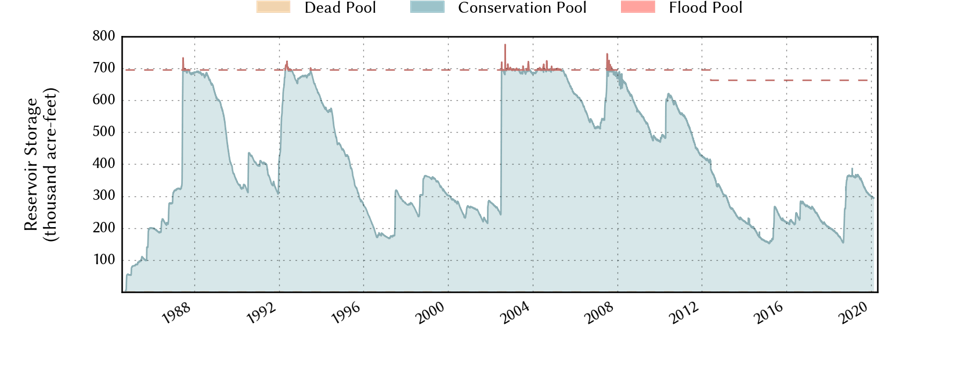
Figure 5c: Reservoir storage in Choke Canyon Reservoir since the mid-1980s (source).
For the El Niño Southern Oscillation, we remain in neutral (La Nada) conditions (Figure 6). The Climate Prediction Center continues to show the chance of neutral conditions through the spring at about 60 percent with about a 50 percent chance of La Nada conditions continuing through the summer.
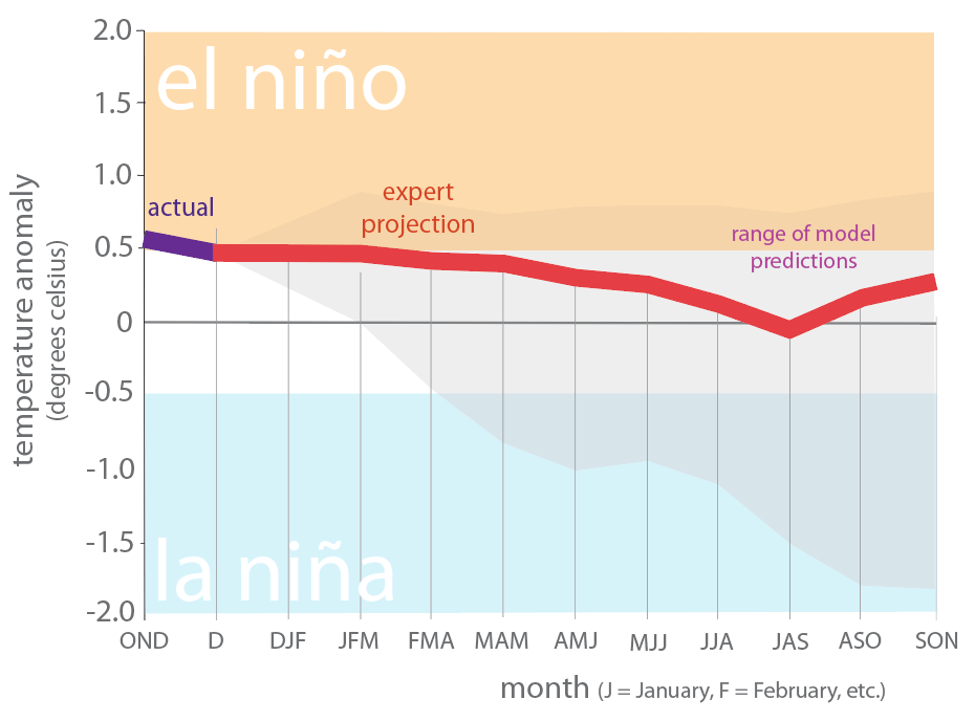
Figure 6. Forecasts of sea surface temperature anomalies for the Niño 3.4 Region as of January 19, 2020 (modified from source).
The U.S. Seasonal Drought Outlook through April 30, 2020, shows scattered drought-removal across the state with scattered drought remaining (Figure 7a). The three-month temperature outlook projects — surprise, surprise — warmer than normal conditions (Figure 7b) while the three-month precipitation projects drier conditions in Far West Texas (Figure 7c).
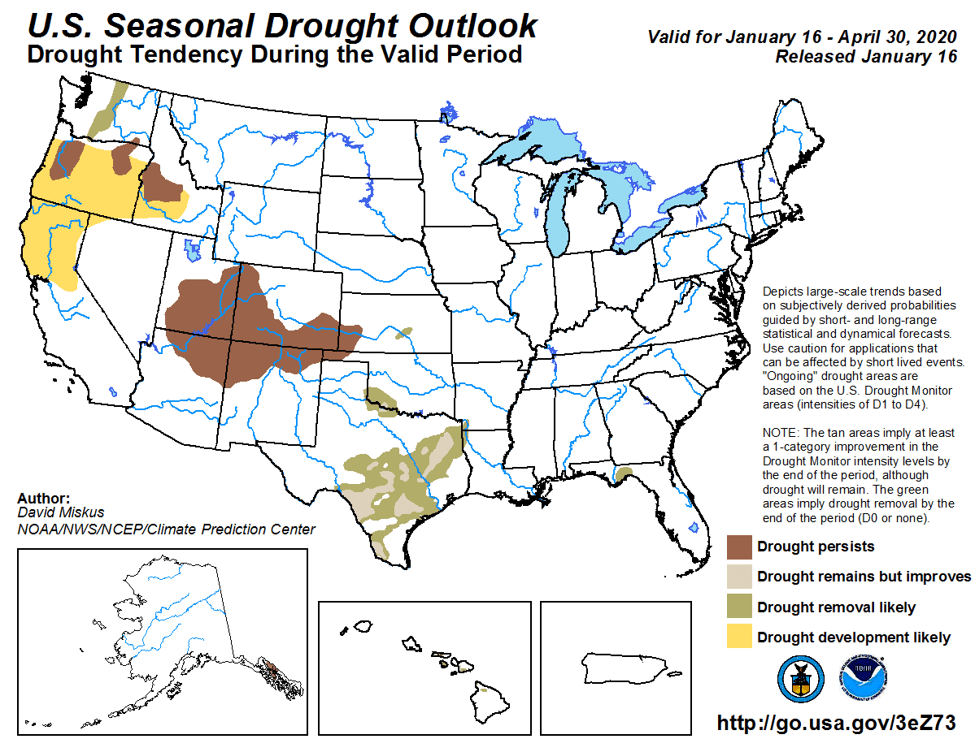
Figure 7a: The U.S. Seasonal Drought Outlook for January 16, 2019, through April 30, 2020 (source).
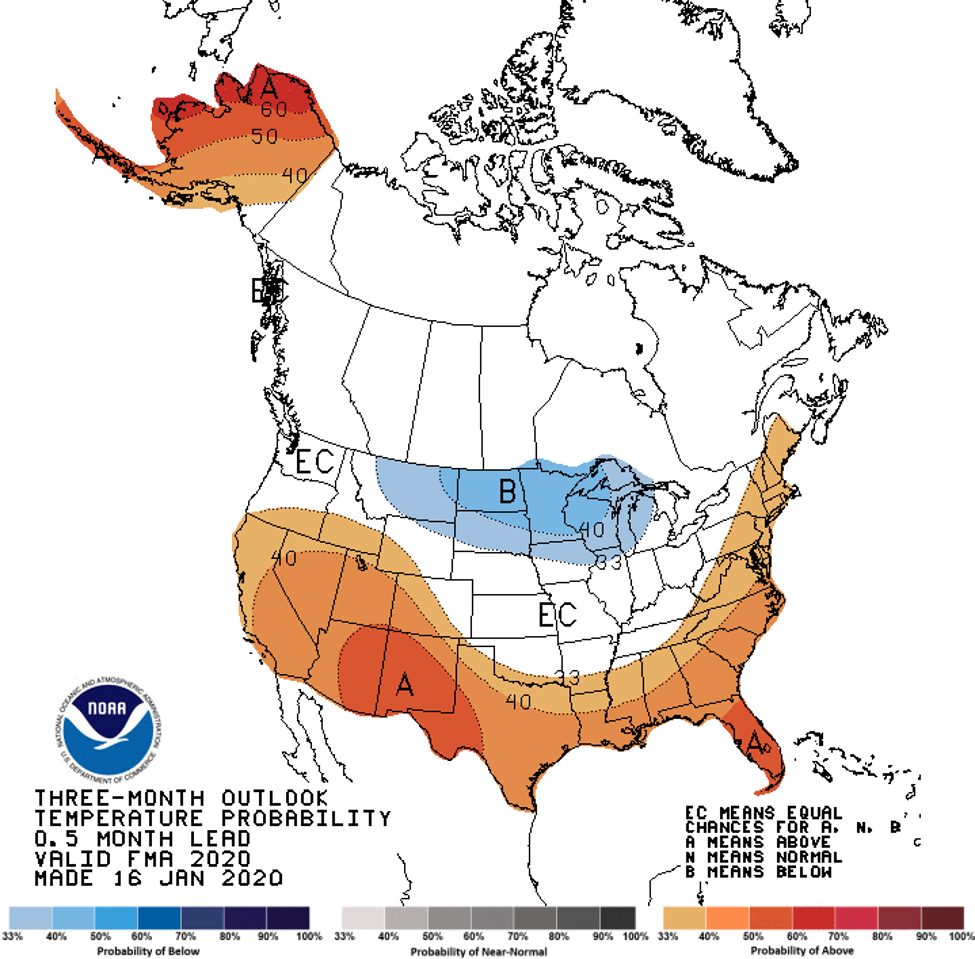
Figure 7b: Three-month temperature outlook from January 16, 2019 (source).
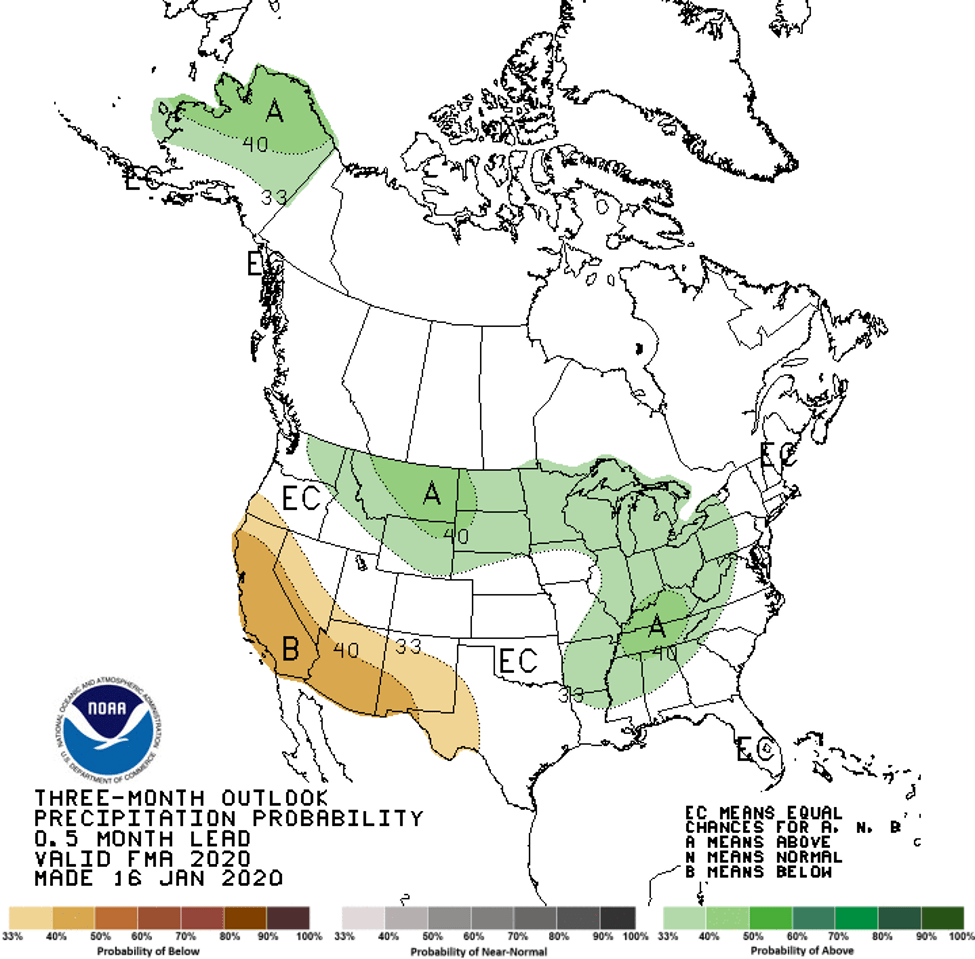
Figure 7c: Three-month precipitation outlook from January 16, 2019 (source).
Author

Robert Mace
Interim Executive Director & Chief Water Policy Officer at The Meadows Center for Water and the Environment
Robert Mace is the Interim Executive Director and the Chief Water Policy Officer at The Meadows Center. He is also Professor of Practice in the Department of Geography at Texas State University. Robert has over 30 years of experience in hydrology, hydrogeology, stakeholder processes, and water policy, mostly in Texas.
Hi ,
This is Dr. Jalaluddin Qureshi professor of environmental Science and Geology in HCC.
I shall be grateful if the power point on taxes of ground water management and ground water recharge may kindly arrange for education of college student . I have International experience with international organizations .
thanking you in advance .
Dr. Jalaluddin qureshi ,
jalaluddin.qureshi@hccs.edu