SUMMARY:
- Drought—including exceptional drought—is focused on the southeastern two-fifths of the state.
- Drought is expected to remain in this area through June.
- Wash your hands and only flush toilet paper!
I wrote this article on March 20, 2020.
With all of my in-person meetings canceled or delayed by the coronavirus, I feel fortunate that the monthly generation of this column only requires me, a computer, and the calming assistance of my dedicated feline companion, Lilly Reich. I’m going to pan the pandemic with two thumbs down—our present situation sucks, and I hope everyone is safe and sound (and keeping your distance with your recently washed hands). The outbreak has definitely presented some interesting challenges in the water and wastewater sector, namely the binge buying of toilet paper and bottled water.
I would have never predicted that the apocalypse would be met with a run on toilet paper, but here we are. The issue in the wastewater world is people using TP alternatives (disinfecting wipes, paper towels, napkins, shredded t-shirts, corncobs) and then flushing them down the toilet. I have to admit that paper towels and napkins were new ones for me (not that I ever flush them). Even so-called “flushable wipes” should not be flushed. These toilet paper alternatives clog up city sewer collection systems and may even clog up your line (which means not only no toilet paper, but also no toilet). The only thing you should flush down the toilet (besides your [ahem] bidness) is toilet paper: no ifs, ands, or butts. And wash your hands afterwards!
The run on water is probably default disaster response, but water supplies remain safe and reliable. According to the EPA “The COVID-19 virus has not been detected in drinking-water supplies. Based on current evidence, the risk to water supplies is low. Americans can continue to use and drink water from their tap as usual.” Like any good scientist, they avoided absolutes by using weaselwords (“based on current evidence” “low risk”), so there’s still a risk, however minuscule. Standard water treatment includes processes that deal with viruses. The American Water Works Association has expressed some concern over supply chains and absenteeism, but many water providers are planning for these issues. The Texas Commission on Environmental Quality has posted information for public water systems, and the Department of Homeland Security has marked water and wastewater as essential and exempt from closure. The Texas Water Conservation Association also put out a statement on water and wastewater.
And if you’re still thinking of attending (or have to attend) a meeting, Figure 1 quantifies the risk of someone at that meeting having the virus. My advice? If you can cancel it, postpone it, or do it remotely, cancel it, postpone it, or do it remotely. Lilly would love to purrticipate in more meetings.
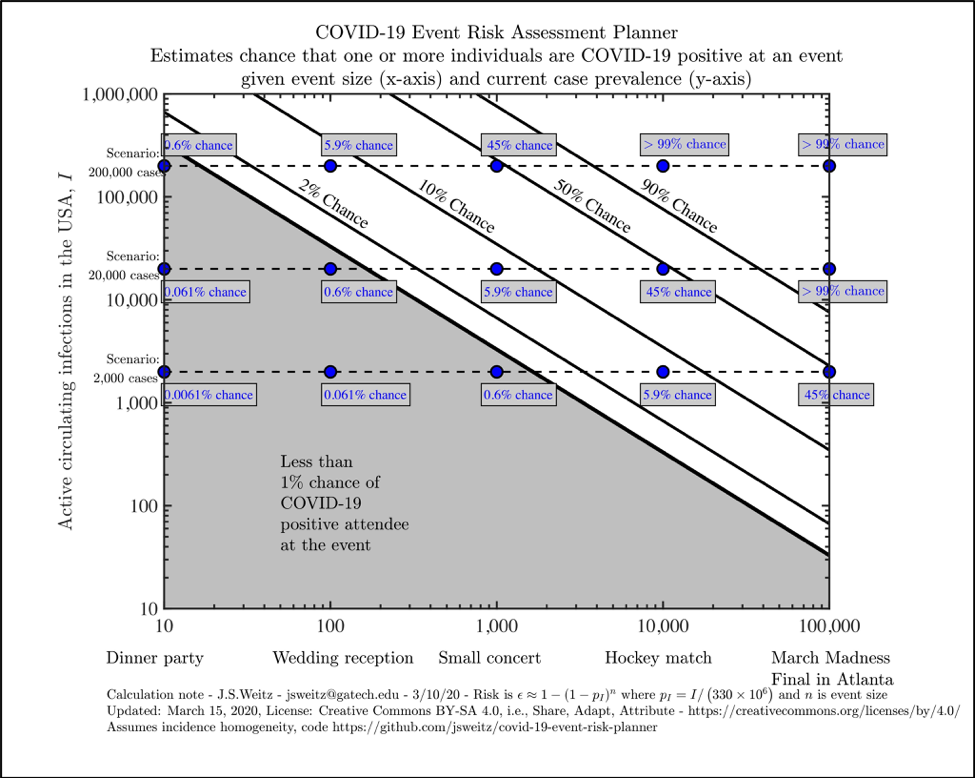
Figure 1: Covid-19 risk assessment planner (source).
Several fronts that passed through the northwestern three-fifths of the state over the past month left behind more than four inches of rain and, in some cases, more than 10 inches (Figure 2a). Much of the same area, with the exception of the greater Big Bend area and the northern fringes of the Panhandle, received greater-than-normal amounts of precipitation with much of West Texas receiving two the three times the normal (Figure 2b). Looking back 90 days, the greater Big Bend area, parts of West Texas, and the southeastern parts of the state have suffered below normal rainfall with large parts of the lower Gulf Coast (and parts of Brewster County) receiving less than 25 percent of normal (Figure 2c).
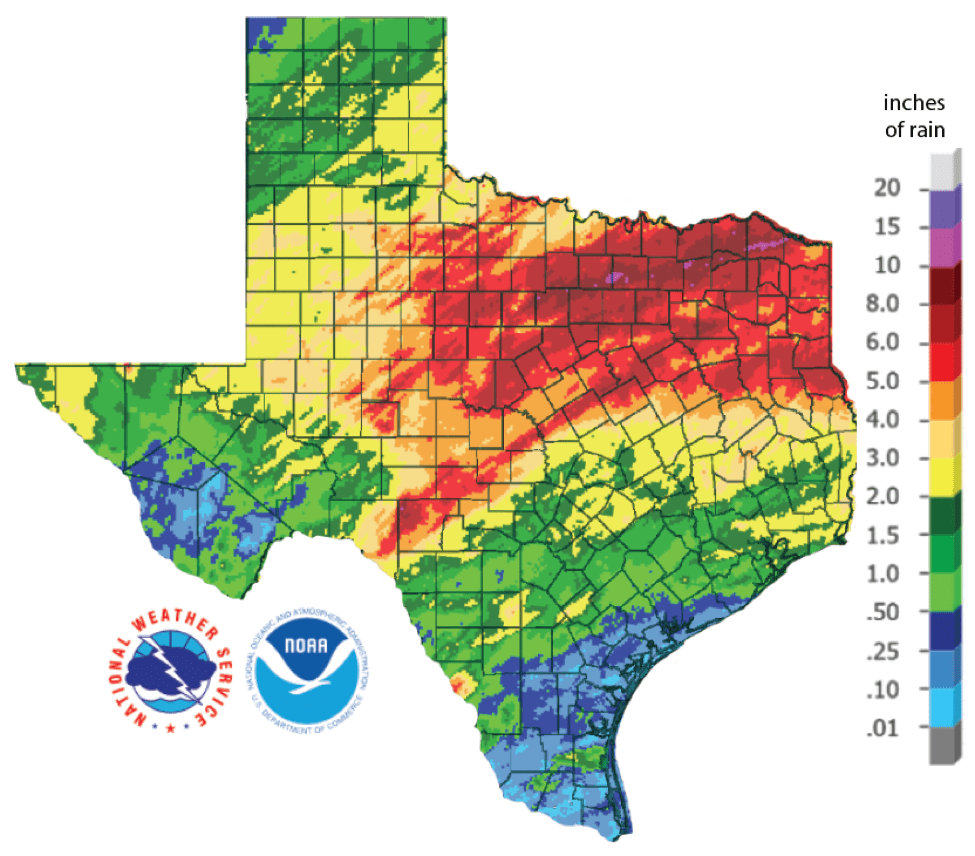
Figure 2a: Inches of precipitation that fell in Texas in the 30 days before March 20, 2020 (source). Note that cooler colors indicate lower values and warmer indicate higher values.
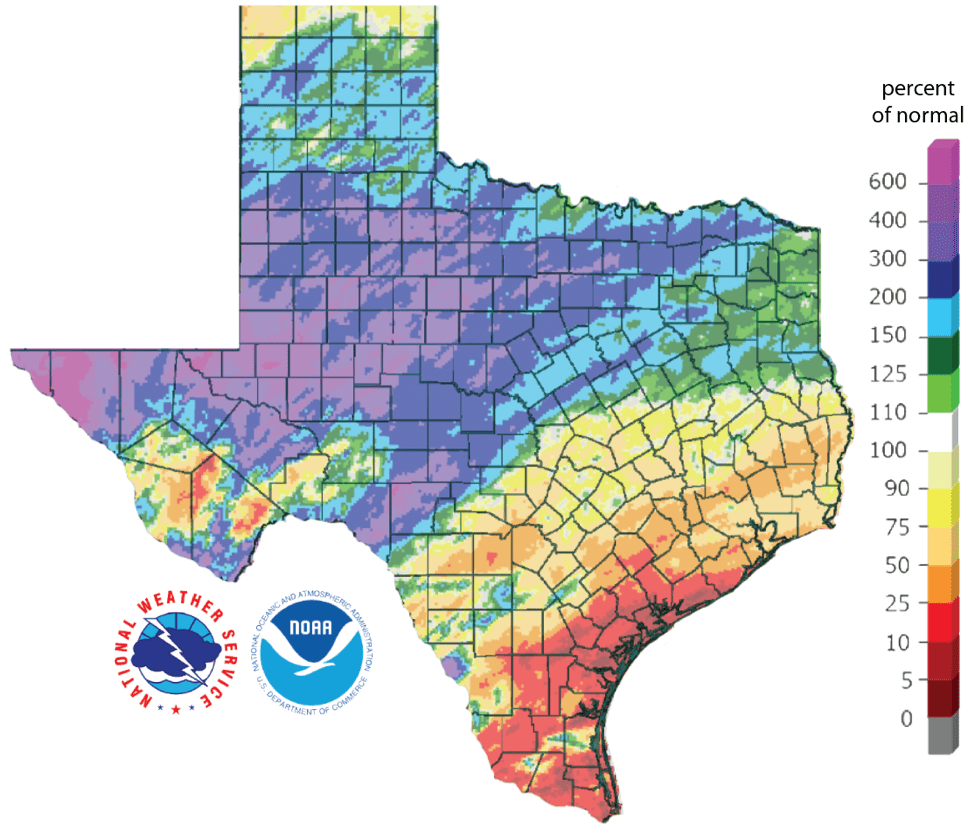
Figure 2c: Rainfall as a percent of normal for the past 90 days (as of March 20, 2020; source).
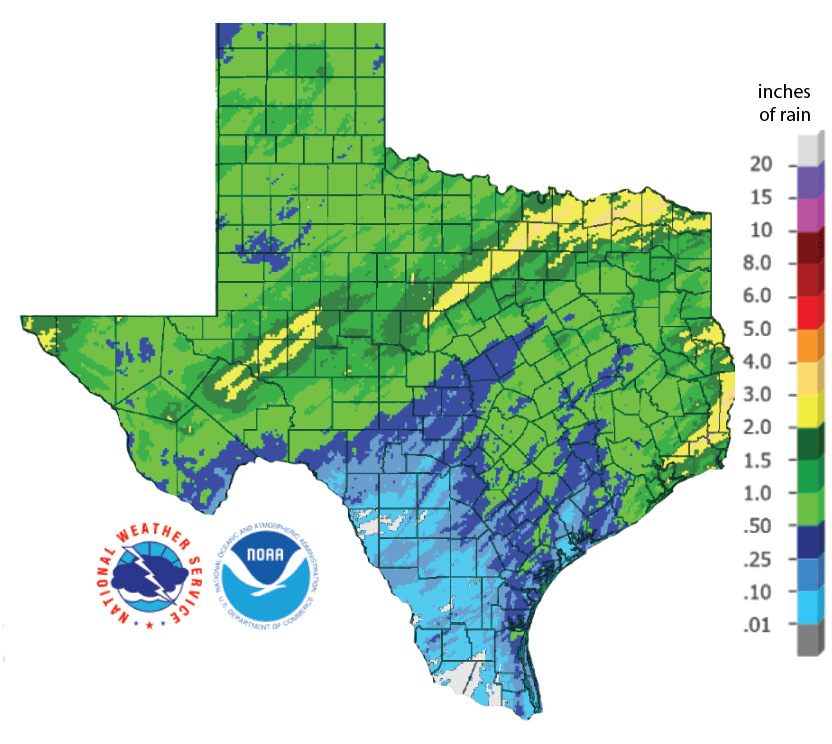
Figure 2a: Inches of precipitation that fell in Texas in the 30 days before December 16, 2019 (source). Note that cooler colors indicate lower values and warmer indicate higher values.
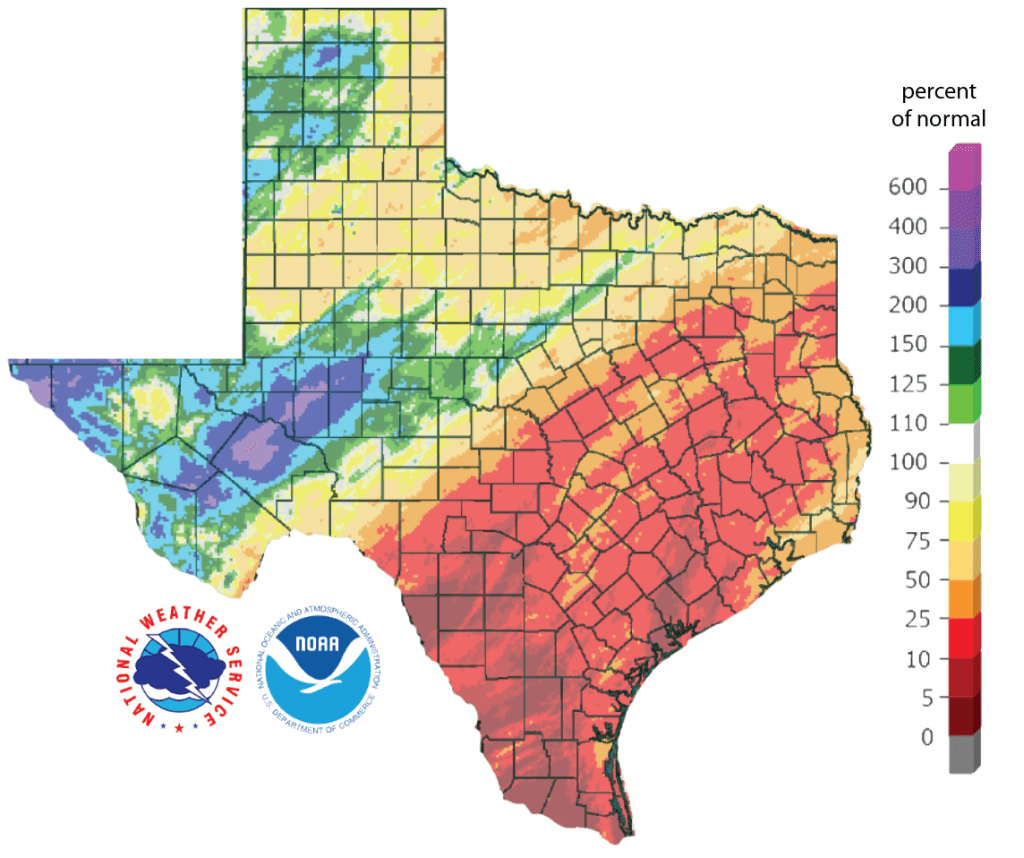
Figure 2b: Rainfall as a percent of normal for the past 30 days (as of December 15, 2019; source).
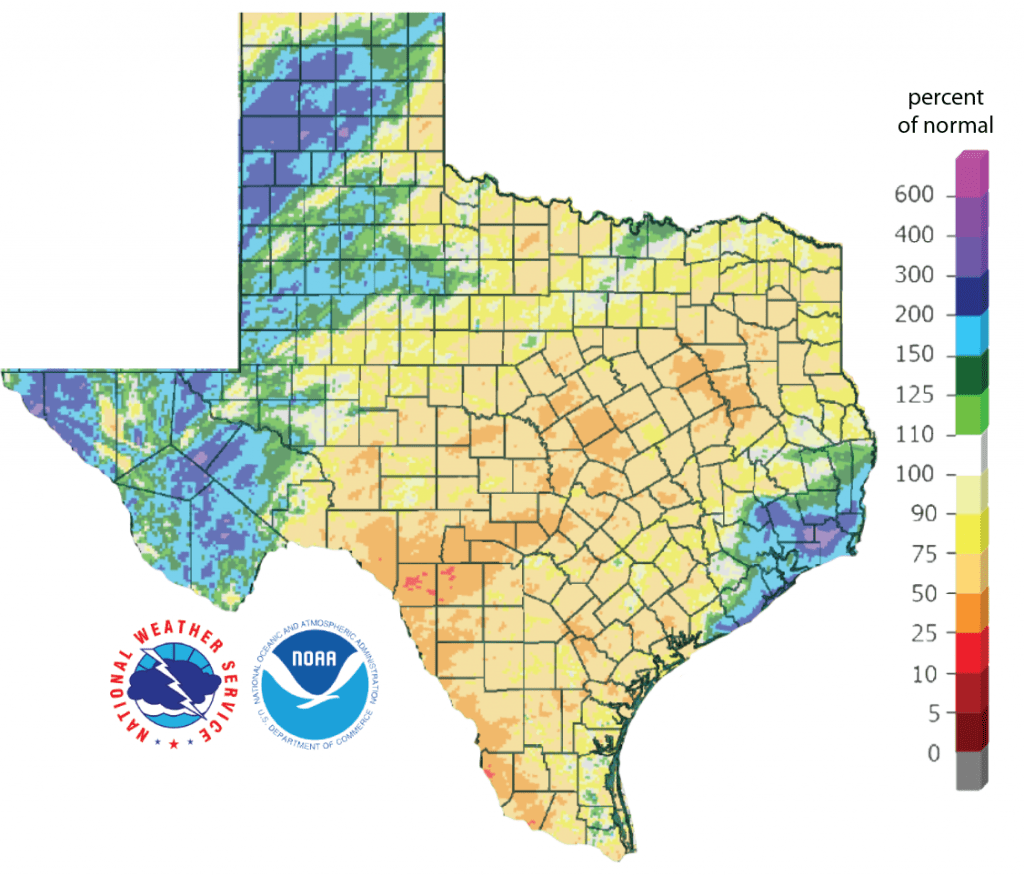
Figure 2c: Rainfall as a percent of normal for the past 90 days (as of December 15, 2019; source).
The amount of the state under drought conditions (D1-D4) decreased slightly from 24 percent four weeks ago to 22 percent today (Figure 3a). Rains over the past month decreased drought along the northwestern fringes of the drought area while drought conditions worsened (Figure 3b). About 7 percent of the state is experiencing extreme drought with exceptional drought appearing for the first time this past week during this dry spell in Jim Hogg, Starr, and Zapata counties (Figure 3a). About 31 percent of the state is abnormally dry or worse (D0-D4; Figure 3a), down from 32 percent four weeks ago.
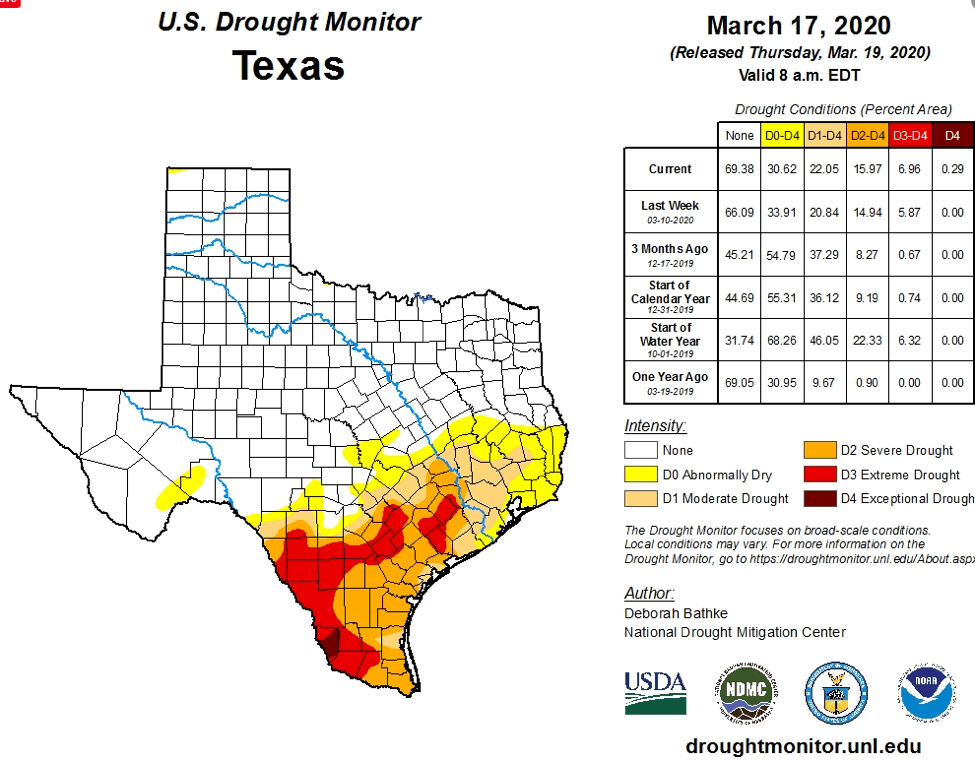
Figure 3a: Drought conditions in Texas according to the U.S. Drought Monitor (as of March 17, 2020; source).

Figure 3b: Changes in the U.S. Drought Monitor for Texas between February 18, 2020, and March 17, 2020 (source).
The North American Drought Monitor for February continues to show severe drought in the headwaters of the Rio Grande in southern Colorado, a significant source of water for Elephant Butte Reservoir which is, in turn, a significant source of water for the El Paso area (Figure 4a). Precipitation in the Rio Grande watershed in Colorado over the last 90 days is less than 50 percent of normal for much of the watershed; however, much of the basin in New Mexico received greater than normal rainfalls (Figure 4b) maintaining Elephant Butte Reservoir at about 30 percent full. The Rio Conchos basin in Mexico, an important source of water to the lower part of the Rio Grande in Texas, has a small area of abnormally dry conditions at the southeastern end of the basin (Figure 4a).
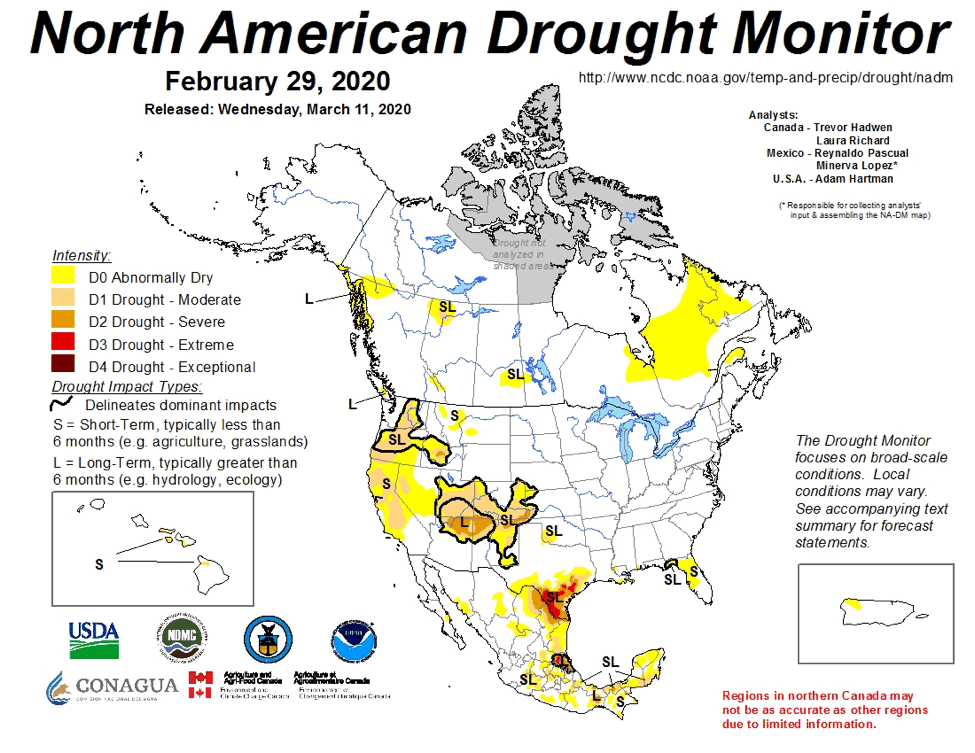
Figure 4a: The North American Drought Monitor for February 29, 2019 (source).
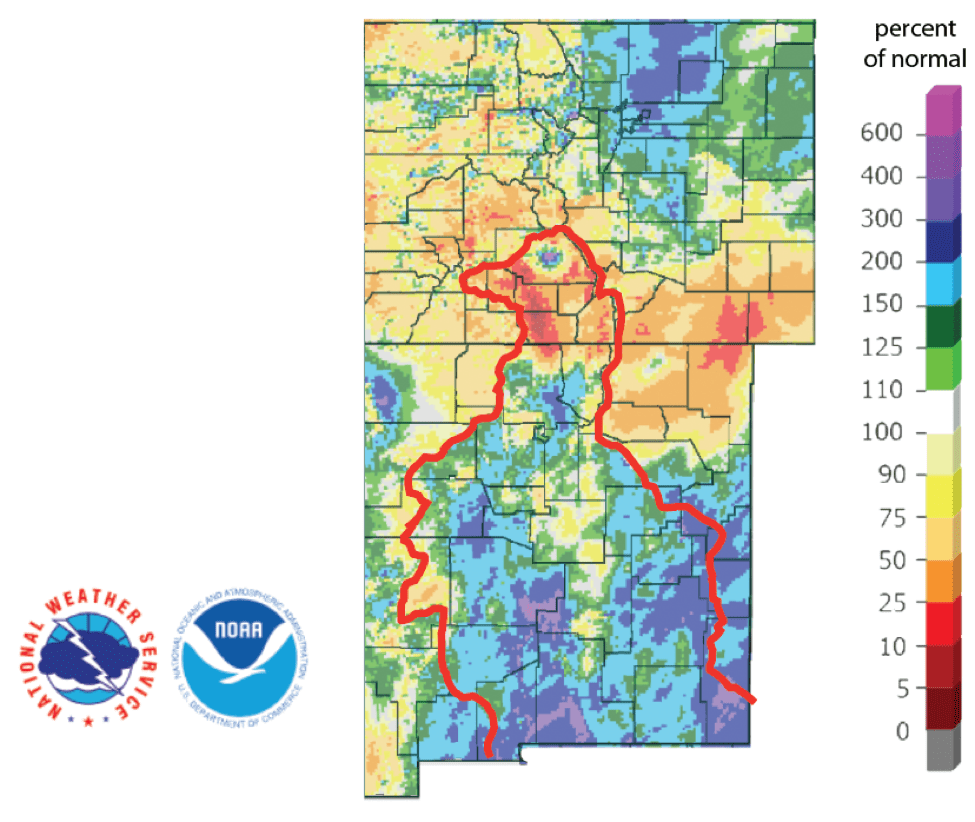
Figure 4b: Percent of normal precipitation for the past 90 days for Colorado and New Mexico as of March 20, 2020 (source). The red line is the Rio Grande Basin. I use this map to see check precipitation trends in the headwaters of the Rio Grande in southern Colorado, the main source of water to Elephant Butte Reservoir downstream.
Statewide reservoir storage increased about one percentage point over the past four weeks and currently sits at 86.7 percent full, a couple points above the median storage since 1990 for this time of year (Figure 5a). Storage in individual reservoirs remained relatively stable over the past month (Figure 5b). Amistad Reservoir is at 63.7 percent full, dropping from the median of 75 percent in mid-January (Figure 5c).
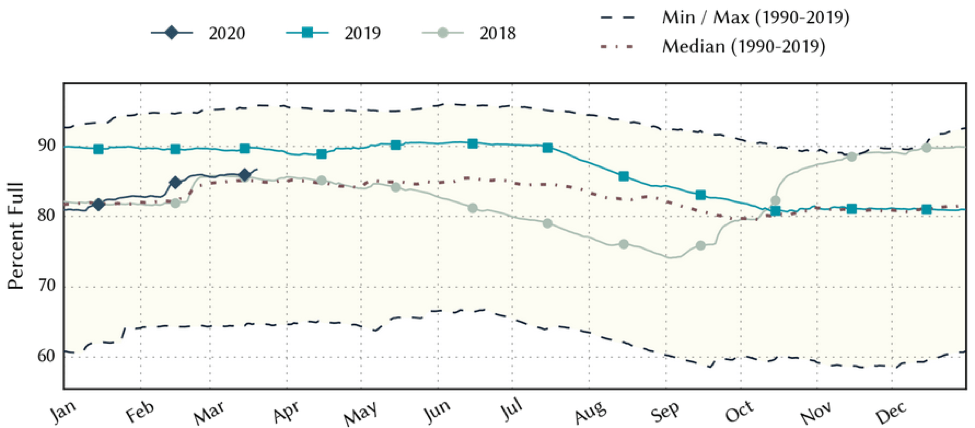
Figure 5a: Statewide reservoir storage since 2018 compared to statistics (median, min, and max) for statewide storage since 1990 (source).
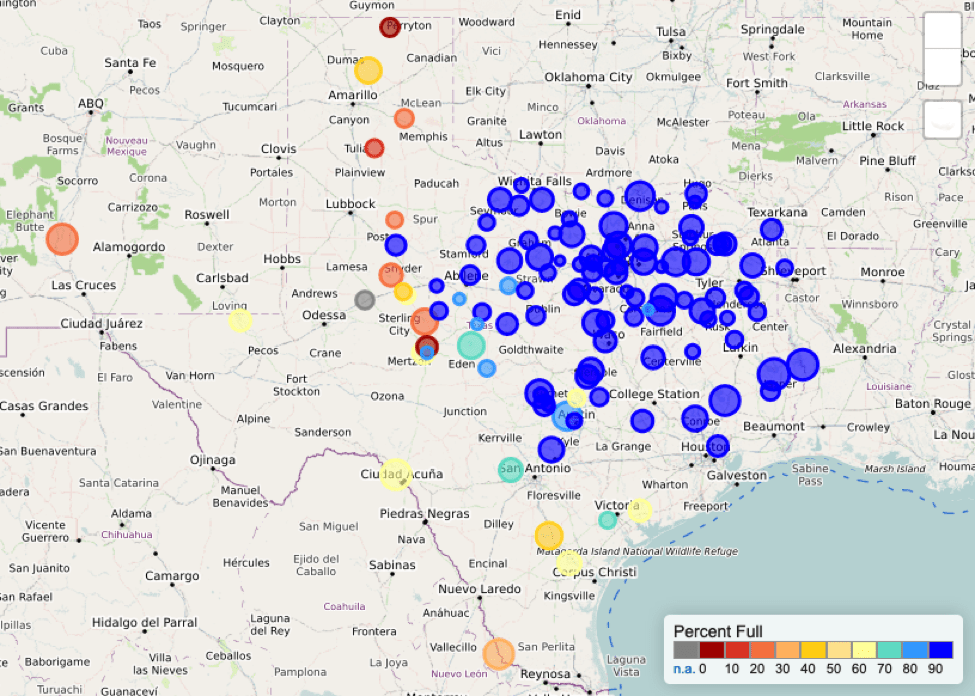
Figure 5b: Reservoir storage as March 20, 2020, in the major reservoirs of the state (source).
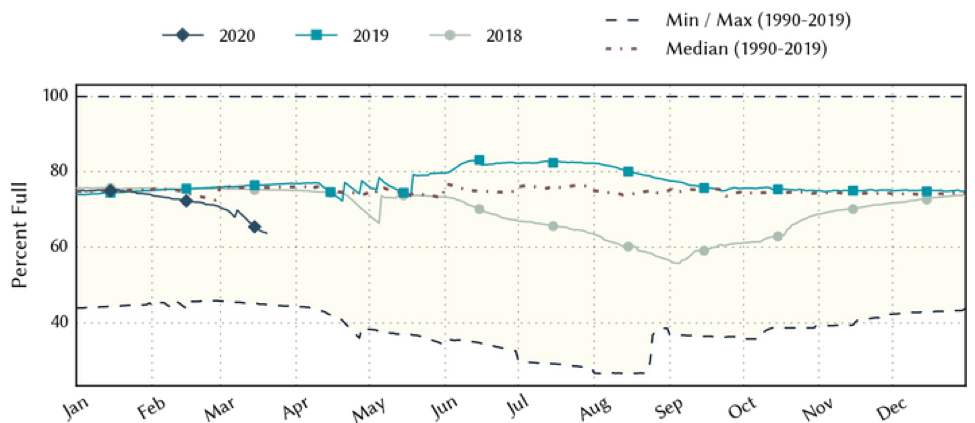
Figure 5c: Reservoir storage in Lake Amistad (source).
For the El Niño Southern Oscillation, we remain in neutral (La Nada) conditions (Figure 6). The Climate Prediction Center increased the chance of neutral conditions through the spring to about 65 percent with about a 55 percent chance of La Nada conditions continuing through the summer. It’s unclear to me why the consensus projection takes a sharp turn in late summer.
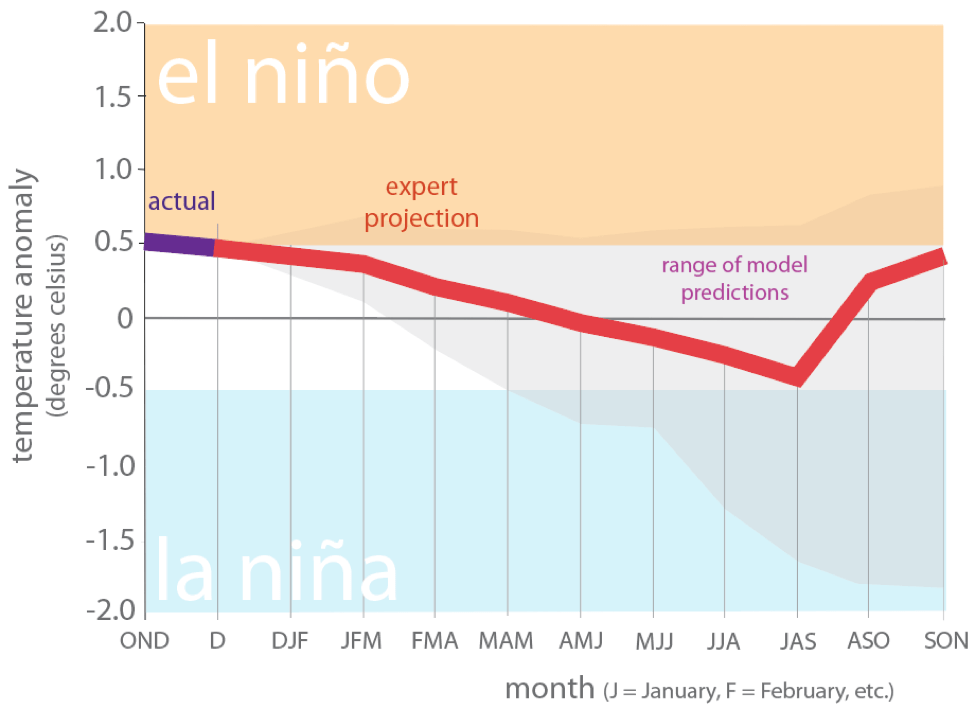
Figure 6. Forecasts of sea surface temperature anomalies for the Niño 3.4 Region as of February 19, 2020 (modified from source).
The U.S. Seasonal Drought Outlook through June 30, 2020, projects persistent drought along much of the Gulf Coast and Lower Rio Grande areas with likely drought removal in the greater Houston area (Figure 7a). The three-month temperature outlook projects warmer-than-normal conditions statewide with greater warming to the south (Figure 7b) while the three-month precipitation projects drier-than-normal conditions for the southwestern half of the state (Figure 7c).

Figure 7a: The U.S. Seasonal Drought Outlook for March 19, 2019, through June 30, 2020 (source).
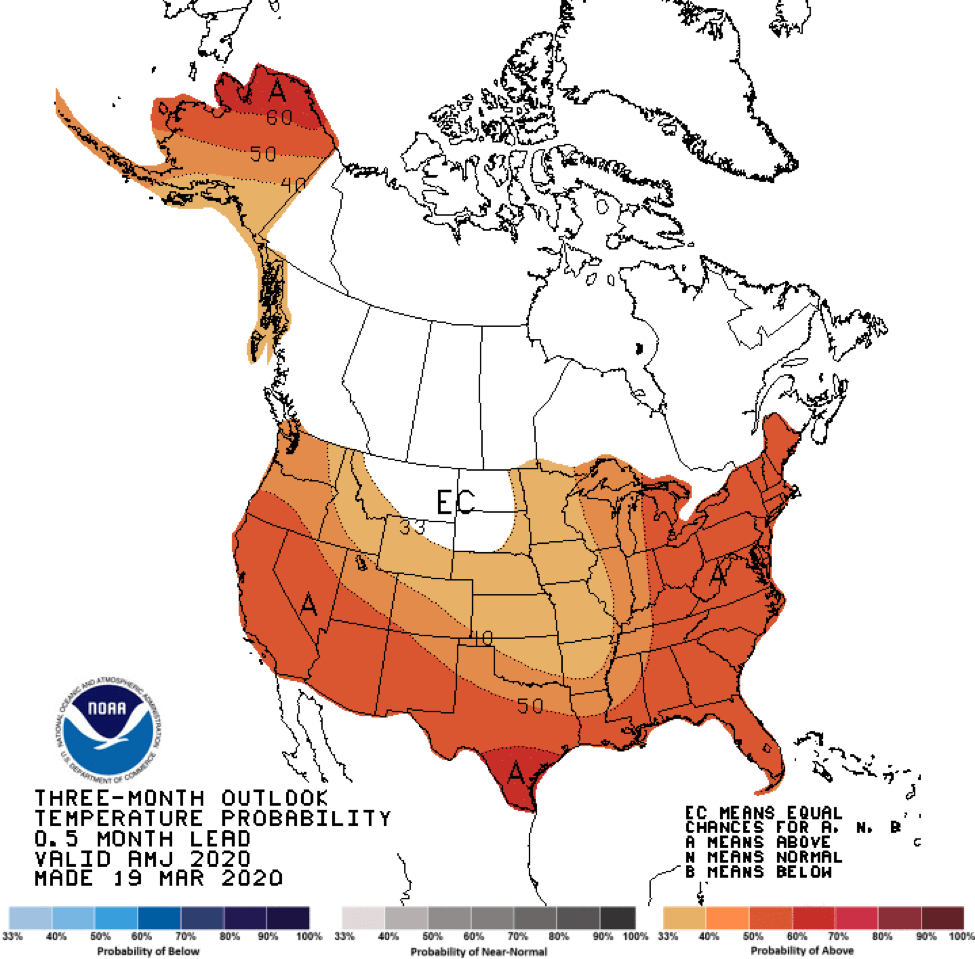
Figure 7b: Three-month temperature outlook from January 16, 2019 (source).
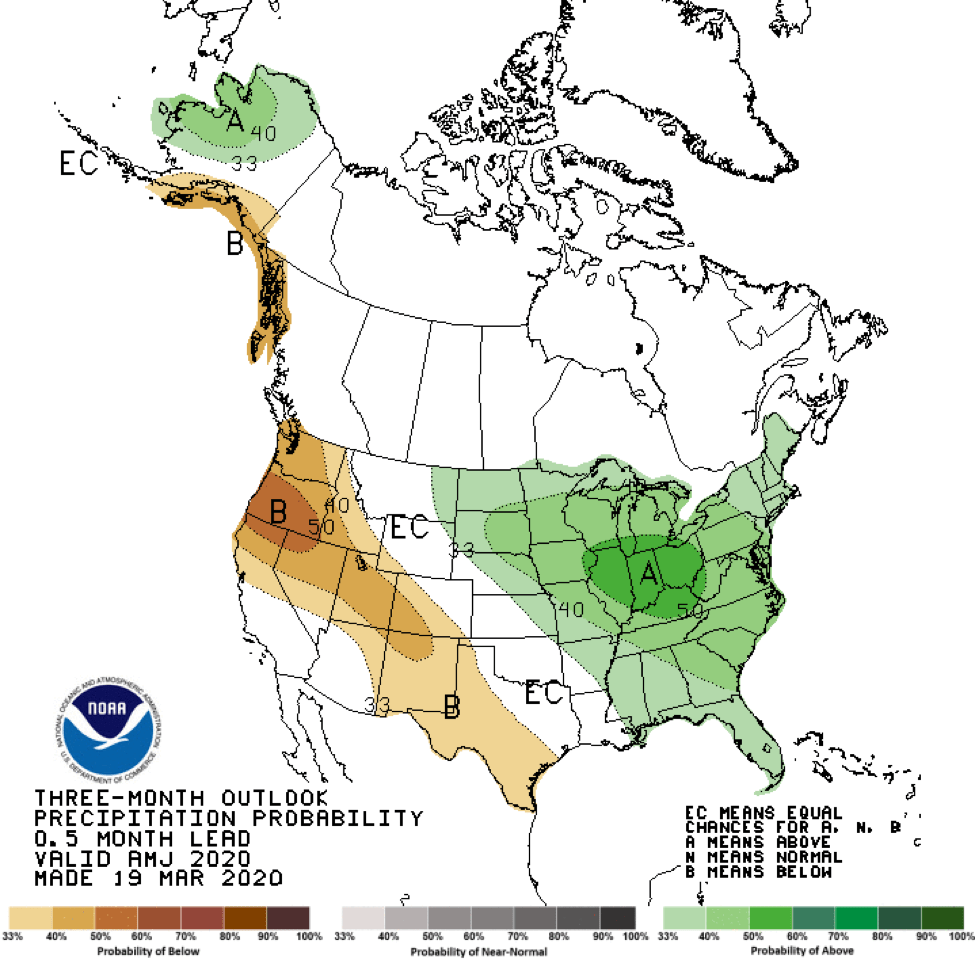
Figure 7c: Three-month precipitation outlook from January 16, 2019 (source).
Author

Robert Mace
Interim Executive Director & Chief Water Policy Officer at The Meadows Center for Water and the Environment
Robert Mace is the Interim Executive Director and the Chief Water Policy Officer at The Meadows Center. He is also Professor of Practice in the Department of Geography at Texas State University. Robert has over 30 years of experience in hydrology, hydrogeology, stakeholder processes, and water policy, mostly in Texas.