SUMMARY:
- NOAA projects a 60 percent chance of a more active Atlantic hurricane season this year.
- Drought conditions decreased over the past month (from 16 to 11 percent of the state), but abnormally dry conditions or worse increased from 28 to 38 percent.
- The state is projected to be warmer than normal though the summer with the Rio Grande region suffering the brunt of higher temperatures.
I wrote this article on May 22 and 24, 2020.
The 2020 Atlantic Hurricane Season is upon us, officially running from June 1 through November 30 (even though we had our first tropical storm, Arthur, in mid-May). NOAA projects a 60 percent chance of a more active hurricane season, 30 percent chance of a normal season, and a 10 percent chance of a less active season. NOAA projects a 70 percent probability of there being 13 to 19 named storms with 6 to 10 hurricanes, 3 to 6 of which could be Cat 3 or greater. Accumulated Cyclone Energy (which, as a measure of a hurricane season’s overall strength, sounds ominous) is projected to be 100 to 190 percent of the median. NOAA plans to update their projections in August.
NOAA’s Eastern Pacific Hurricane Season Outlook projects 11 to 18 named storms, 5 to 10 hurricanes, and 1 to 5 major hurricanes. NOAA projects a 40 percent chance of a more active hurricane season, 35 percent chance of a normal season, and a 25 percent chance of a less active season for the eastern Pacific season, which runs from May 15th to November 30.
NOAA’s projections are informed in large part by projections of no El Niño this year, a weather phenomenon that tends to suppress tropical storm development in the Atlantic through wind shear. The projections are also informed by warmer sea-surface temperatures and weaker trade winds where hurricanes form, conditions that started in 1995 (coinciding with the current warming phase of the Atlantic Multidecadal Oscillation).
August 20 through October 20 is the peak season with September 10 being the peak time for hurricanes in the Atlantic (Figure 1).
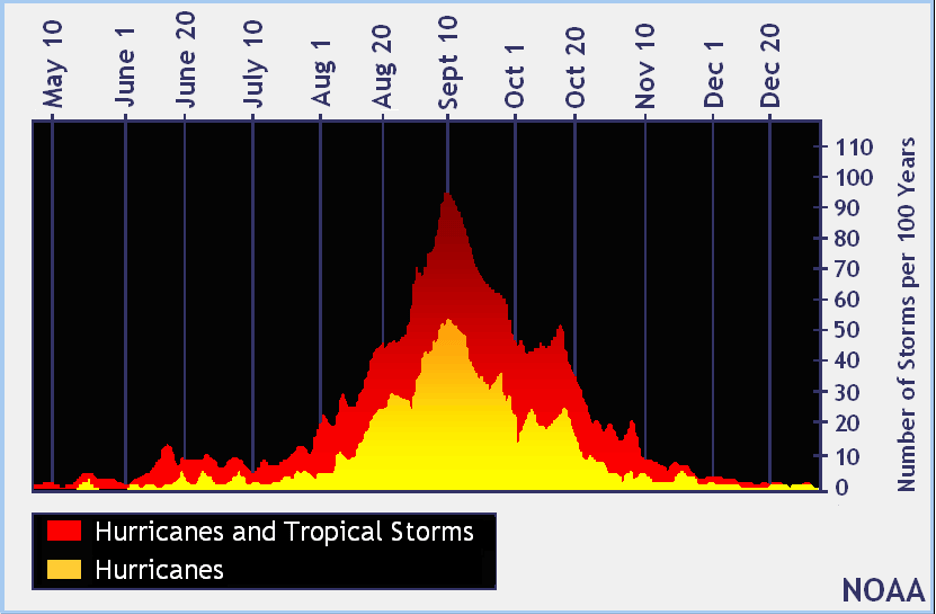
Figure 1. Number of tropical storms per 100 years (source).
Several fronts that passed through the eastern half of the state over the past month left behind more than four inches of rain and, in some cases, more than six inches (Figure 2a). Most of the state received less than normal rainfall over the past four weeks with much of West and Far West Texas getting less than 25 percent of normal, although central Pecos County’s four or so inches were two to three times greater than normal (Figure 2b). Looking back 90 days, Big Bend and West Texas have suffered substantially below normal rainfall while conditions in the Lower Rio Grande Valley and along the Gulf Coast have improved from last month (Figure 2c).
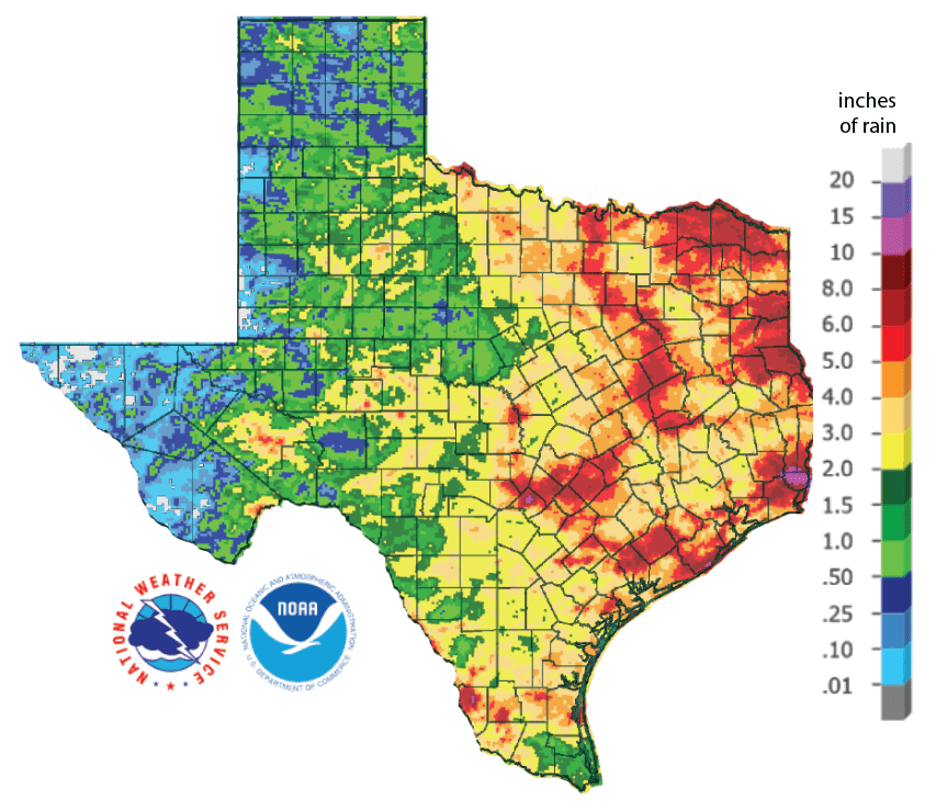
Figure 2a. Inches of precipitation that fell in Texas in the 30 days before May 22, 2020 (source). Note that cooler colors indicate lower values and warmer indicate higher values.
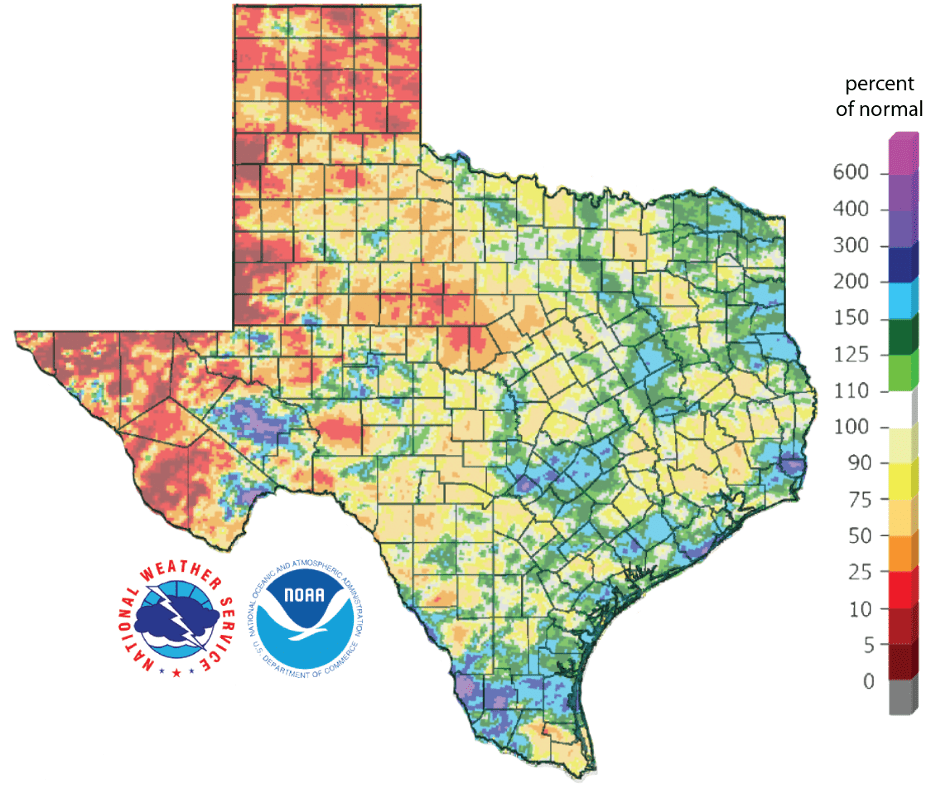
Figure 2b. Rainfall as a percent of normal for the past 30 days as of May 22, 2020 ( source).
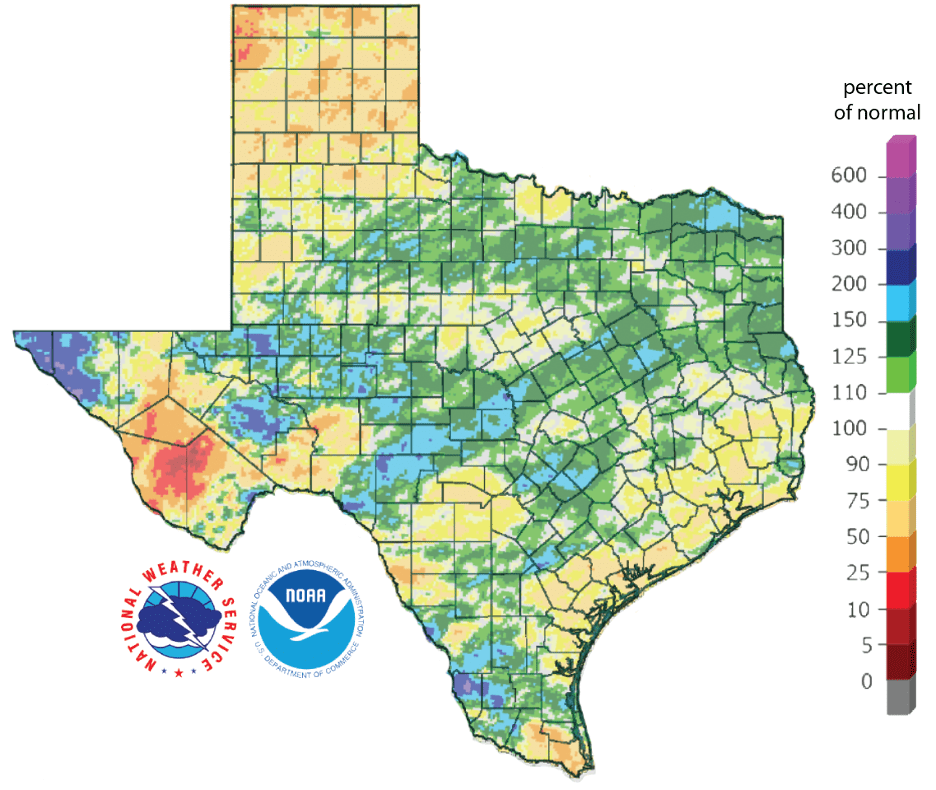
Figure 2c. Rainfall as a percent of normal for the past 90 days as of May 22, 2020 (source).
The amount of the state under drought conditions (D1-D4) decreased from 16.1 percent four weeks ago to 10.7 percent today (Figure 3a). Rains over the past month smothered drought along the Gulf Coast and Lower Rio Grande Valley while drought developed in parts of West and Far West Texas (Figure 3b). Less than 1 percent of the state is now experiencing extreme drought (Figure 3a). Despite the regional improvements, about 38 percent of the state is abnormally dry or worse (D0-D4; Figure 3a), up from 28 percent four weeks ago.
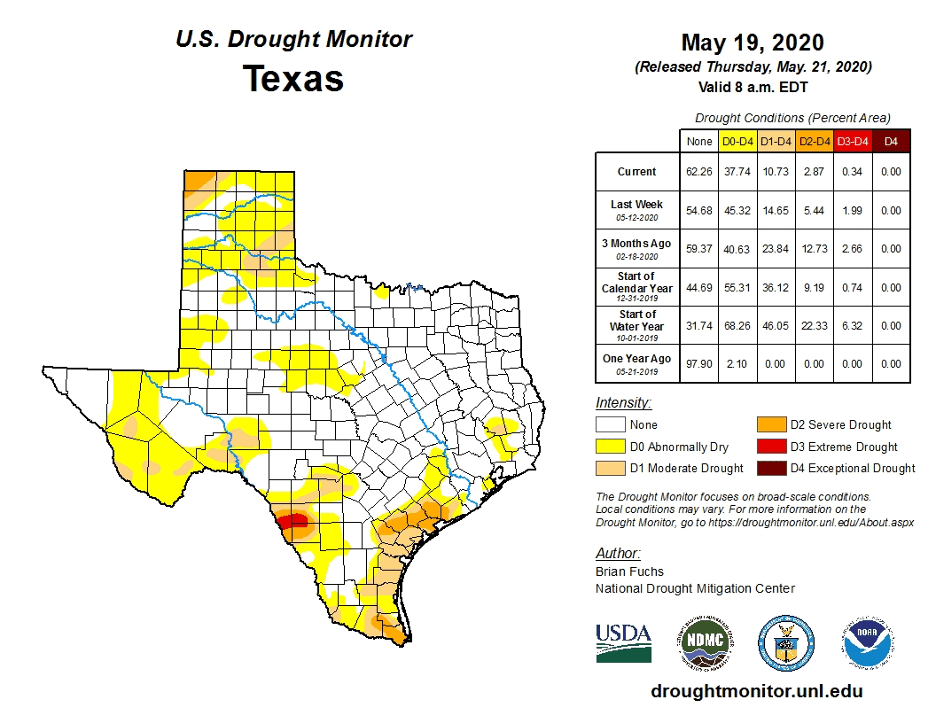
Figure 3a. Drought conditions in Texas according to the U.S. Drought Monitor (as of May 19, 2020; source).

Figure 3b. Changes in the U.S. Drought Monitor for Texas between April 21, 2020, and May 19, 2020 (source).
The North American Drought Monitor for April shows growing severe drought conditions in the headwaters of the Rio Grande in southern Colorado, a significant source of water for Elephant Butte Reservoir which is, in turn, a significant source of water for the El Paso area (Figure 4a). Precipitation in the Rio Grande watershed in Colorado over the last 90 days is less than 10 to 25 percent of normal for much of the watershed in a seemingly endless drought for the region (Figure 4b).
Conservation storage in Elephant Butte Reservoir decreased from 26.5 percent full on April 26 to 21.9 percent on May 24, 2020, below normal for this time of year (Figure 4c). The Rio Conchos basin in Mexico, which confluences into the Rio Grande just above Presidio and is an important source of water to the lower part of the Rio Grande in Texas, has developed moderate drought conditions at the southeastern end of the basin (Figure 4a). Combined conservation storage in Amistad and Falcon reservoirs decreased from 49.3 percent full on April 24 to 45.8 percent on May 24, 2020, about 7.5 percentage points below normal for this time of year (Figure 4d).
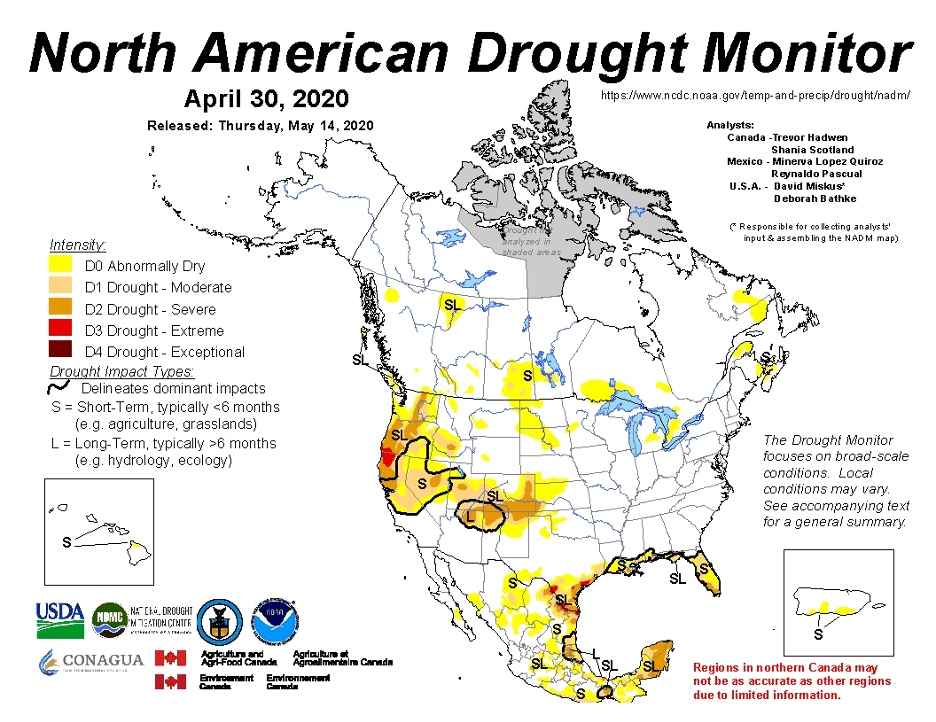
Figure 4a. The North American Drought Monitor for April 30, 2020 (source).

Figure 4b. Percent of normal precipitation for the past 90 days for Colorado and New Mexico as of May 22, 2020 (source). The red line is the Rio Grande Basin. I use this map to see check precipitation trends in the headwaters of the Rio Grande in southern Colorado, the main source of water to Elephant Butte Reservoir downstream.
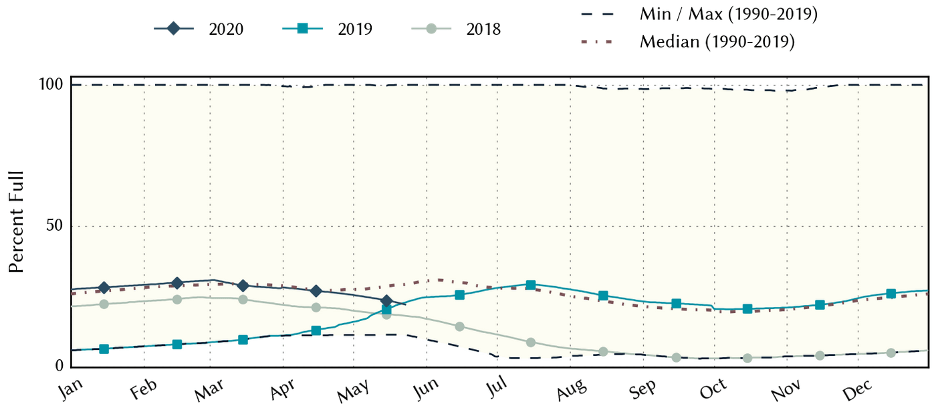
Figure 4c. Reservoir storage in Elephant Butte Reservoir since 2018 with the median, min, and max for measurements since 1990 (source).

Figure 4d. Reservoir storage in Amistad and Falcon reservoirs since 2018 with the median, min, and max for measurements since 1990 (source).
A dozen or so river and stream basins in the southwestern half of the state (and one near the Panhandle) have flows less than 25 percent of normal with a couple catchments with flows less than 10 percent of normal (Figure 5a). Statewide reservoir storage is at 86.8 percent full as of May 24, down from 87.2 percent a month ago, and remains a few percentage points above normal (Figure 5b). Storage in individual reservoirs remained relatively stable over the past month (Figure 5c).
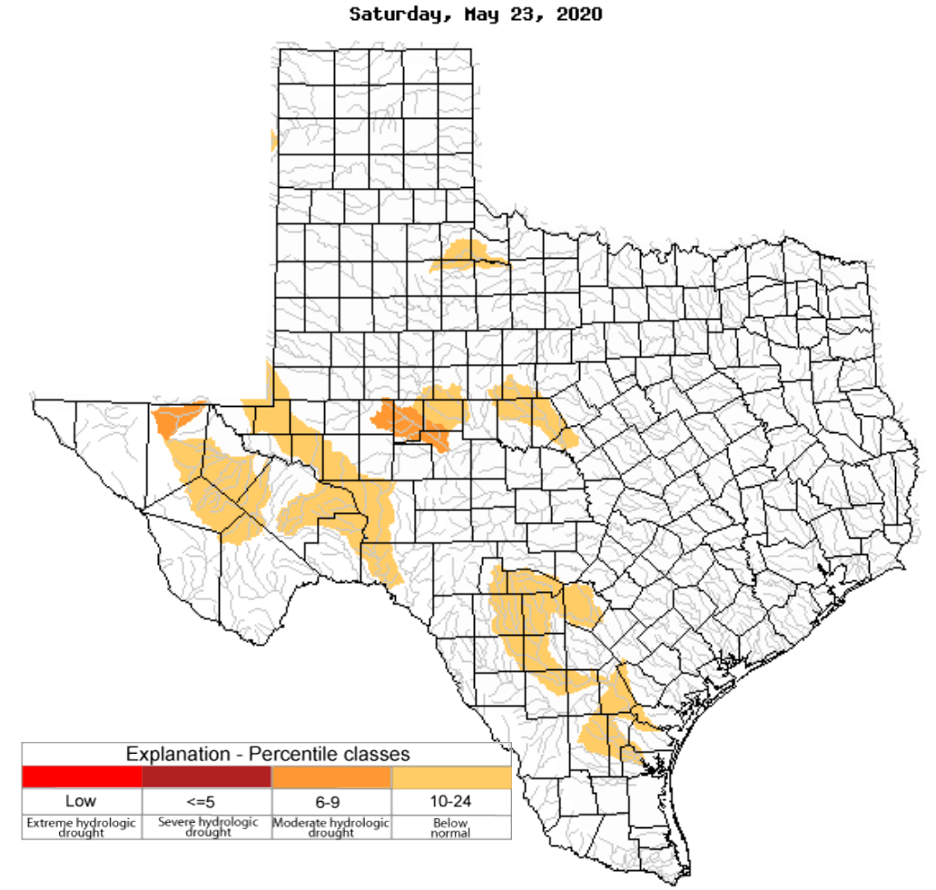
Figure 5a. Parts of the state with below-normal seven-day average streamflow as of May 23, 2020 (source).
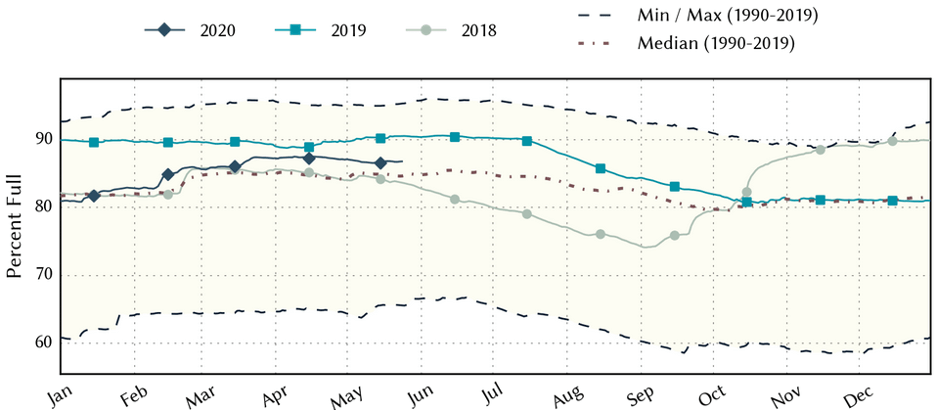
Figure 5b. Statewide reservoir storage since 2018 compared to statistics (median, min, and max) for statewide storage since 1990 (source).

Figure 5c. Reservoir storage as May 24, 2020, in the major reservoirs of the state (source).
Sea-surface temperatures in the central Pacific warmed into El Niño territory (Figure 6a), but we remain in La Nada (neutral) conditions because there is no coupling between the ocean and the atmosphere, the second of two requirements to be an El Niño. The Climate Prediction Center increased the chance of neutral conditions through the summer from 60 to 65 percent with a 45 to 50 percent chance of neutral conditions continuing through the fall (Figure 6b), although the spread of model projections widens considerably in the fall (Figure 6a). I don’t quite understand the jump towards warmer temperatures in the consensus projection for the November-December-January and December-January-February seasons (Figure 6a) when the probabilistic forecasts hover near the La Nada-Lan Niña threshold (Figure 6b).

Figure 6a. Forecasts of sea-surface temperature anomalies for the Niño 3.4 Region as of May 14, 2020 (modified from source).

Figure 6b. Probabilistic forecasts of El Niño, La Niña, and La Nada conditions (source).
The U.S. Seasonal Drought Outlook through August 31, 2020, projects improving drought conditions along much of the Gulf Coast and Lower Rio Grande areas with persistent drought in the Big Bend area (Figure 7a). The three-month temperature outlook projects warmer-than-normal conditions statewide with greater warming to the southwest (Figure 7b) while the three-month precipitation slightly favors wetter-than-normal conditions for the northeastern part of the state (Figure 7c).
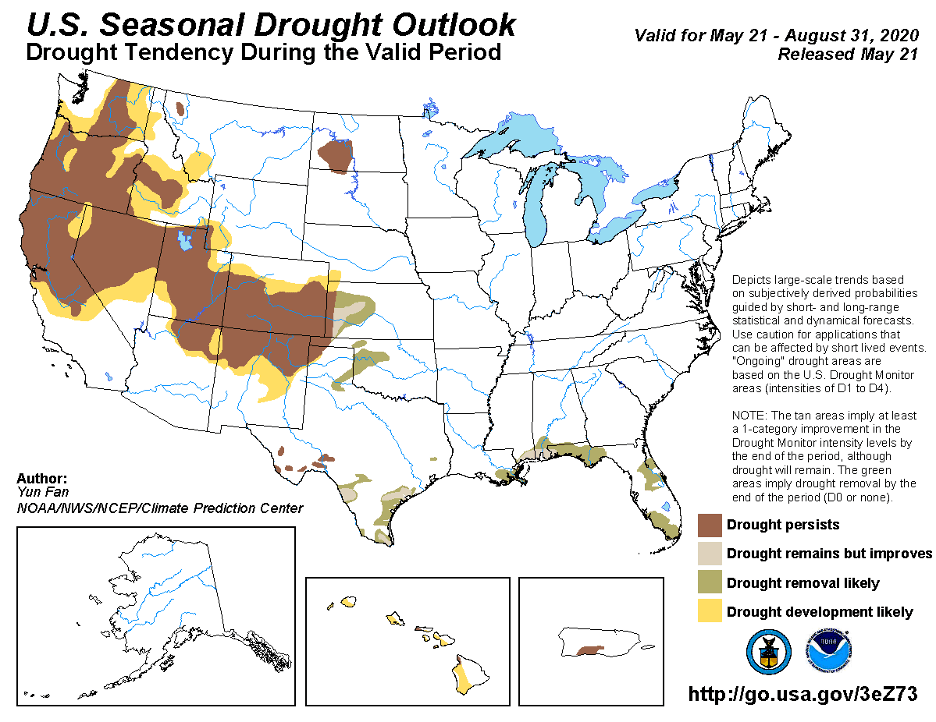
Figure 7a. The U.S. Seasonal Drought Outlook for May 21, 2020, through August 31, 2020 (source).

Figure 7b. Three-month temperature outlook from May 21, 2020 (source).
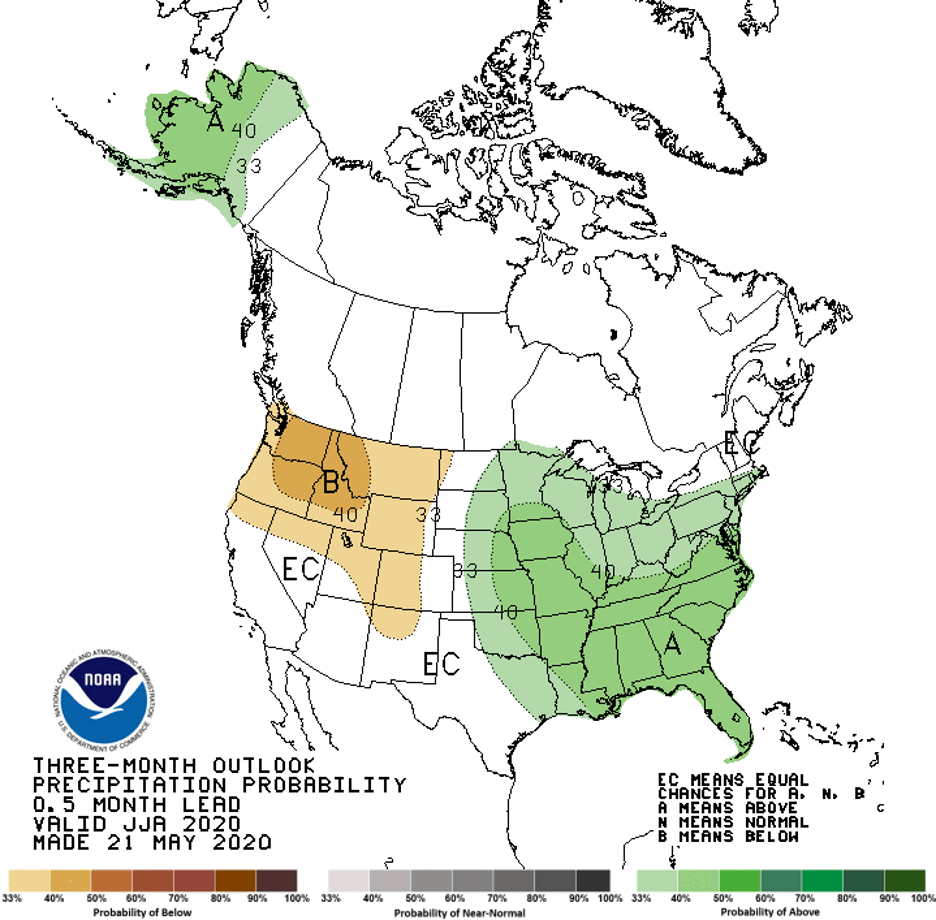
Figure 7c. Three-month precipitation outlook from May 21, 2020 (source).