SUMMARY:
- The tropical storm season continues to break records, including making the Atlantic look like Vincent van Gogh’s “Starry Night.”
- Speaking of tropical storms, recent rainfall has pulled much of the eastern half of the state out of drought conditions.
- La Niña conditions are now officially entrenched in the Pacific, leading to projections of warmer and drier conditions in the state over the next three months.
I wrote this article on September 25, 2020.
This Atlantic tropical season has been one for the record books. With 23 named storms, the 2020 season is already the second most active (and needs 8 more storms to match the 2005 season). Nine of the storms have made landfall on the United States, tying a record set in 1916. Wilfred, Alpha and Beta all formed within six hours of eachother, the first time that has occurred. And on September 11, the Atlantic looked like a Vincent van Gogh painting with five active tropical systems in the Atlantic and the beginnings of three additional storms.
With the formal season ending on November 30, there’s still plenty of time to meet or beat these records (Figure 1; anybody up for a hurricane on Christmas?). Beta in 2005 formed on October 26, more than a month later than 2020’s Beta. Similar to 2005, we seem to be having a late September lull in tropical activity, but the season is a long way from being over.
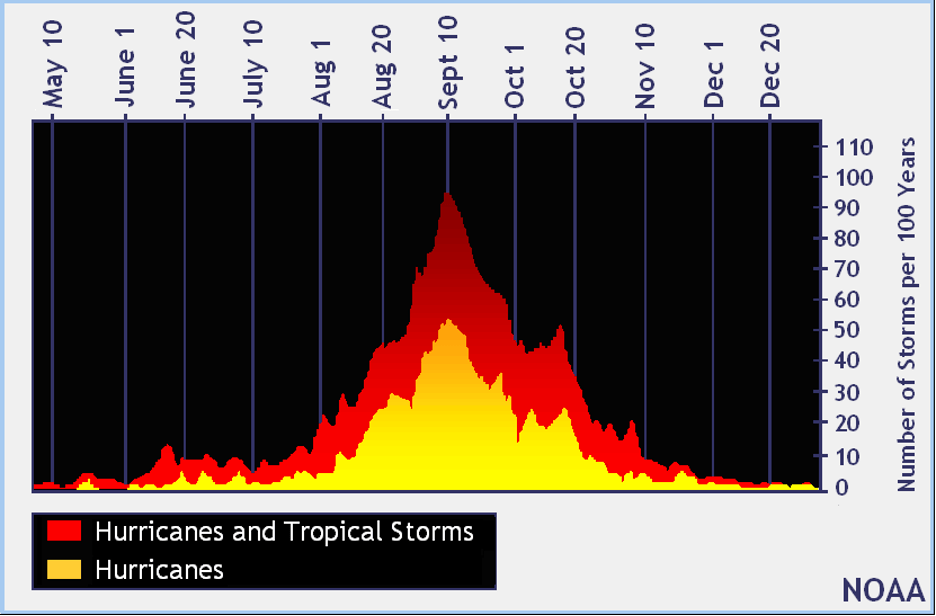
Figure 1a: Number of tropical cyclones per 100 years in the Atlantic (source).
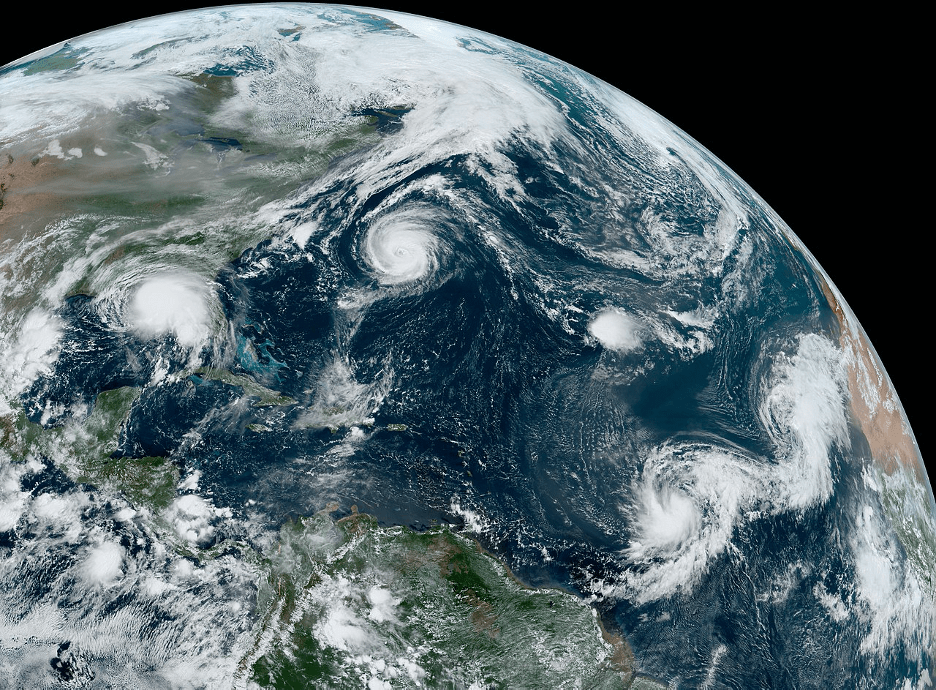
Figure 1b: Five active tropical cyclones in the Atlantic on September 14 with the beginnings of Wilfred, Alpha and Beta (source).

Vincent van Gogh’s “Starry Night”
Recent tropical weather dropped massive amounts of rain over the past month in the eastern third of the state with many areas receiving more than 10 inches of rain and some getting more than 15 inches (Figure 2a). Much of the High Plains and the eastern part of the Trans Pecos/Big Bend area benefitted from an inch or more of rain, although some areas saw less than a quarter or even a tenth of an inch (Figure 2a). The big rains were two to three times normal for the past month; however, large parts of Big Bend, Far West Texas and much of the High Plains received 50% or less of normal amounts (Figure 2b). Tropical rainfall moved a large part of the state from behind-in-rainfall to ahead-in-rainfall over the past 90 days with much of the Panhandle, Far West Texas, Trans-Pecos Texas and parts of South-Central Texas remaining in rainfall deficits (Figure 2c).
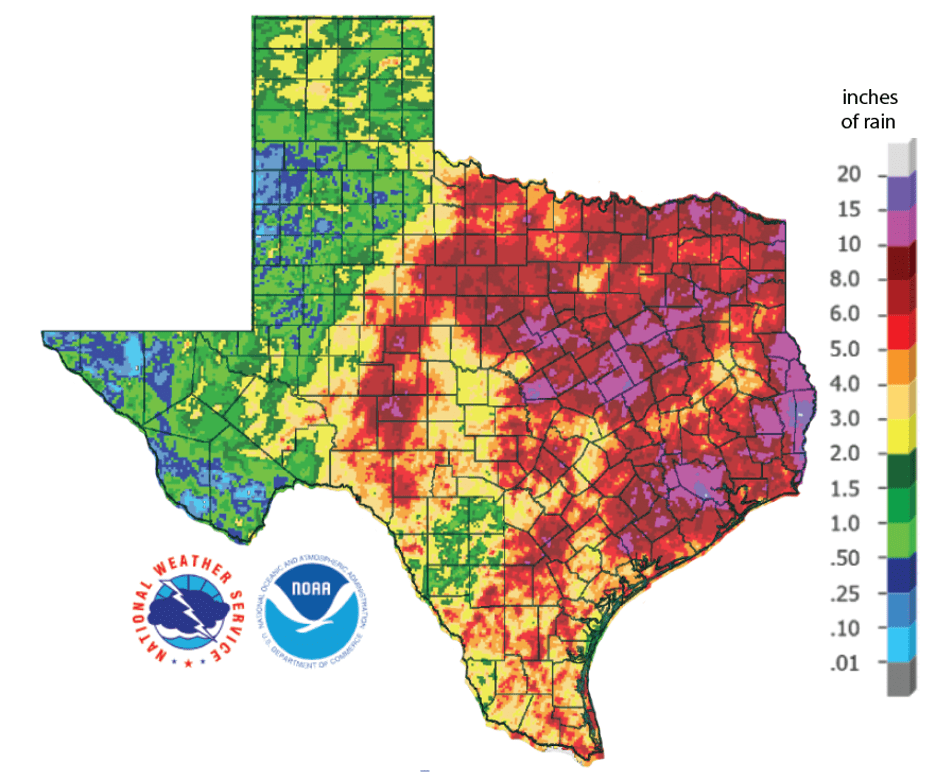
Figure 2a: Inches of precipitation that fell in Texas in the 30 days before September 25, 2020 (source). Note that cooler colors indicate lower values and warmer indicate higher values.
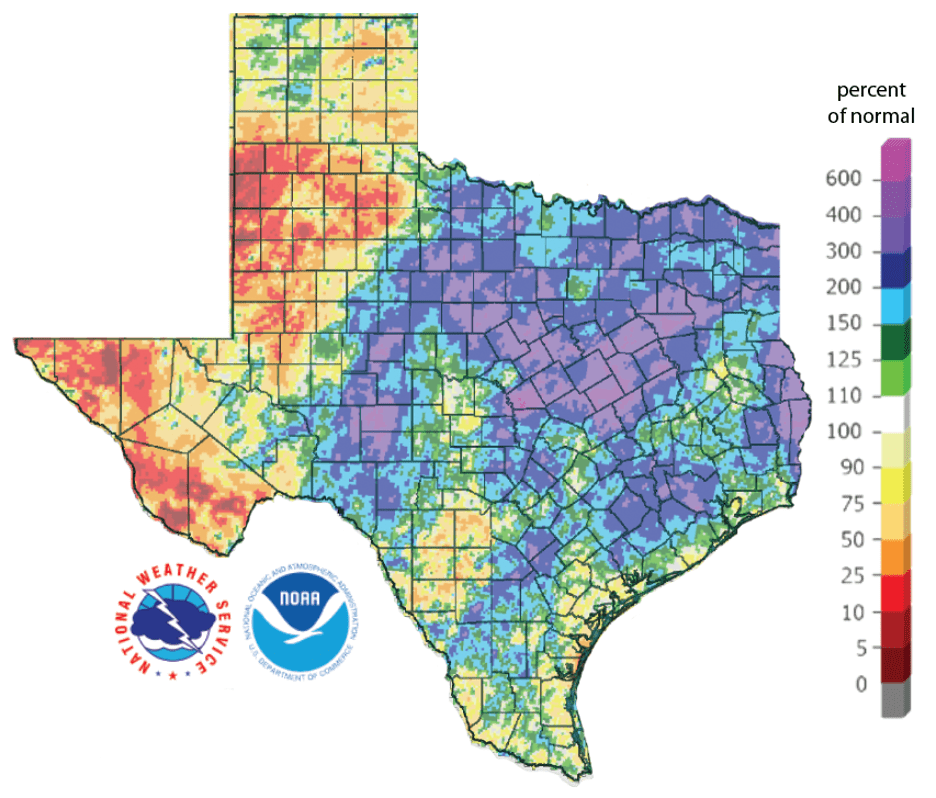
Figure 2b: Rainfall as a percent of normal for the 30 days before September 25, 2020 (source).
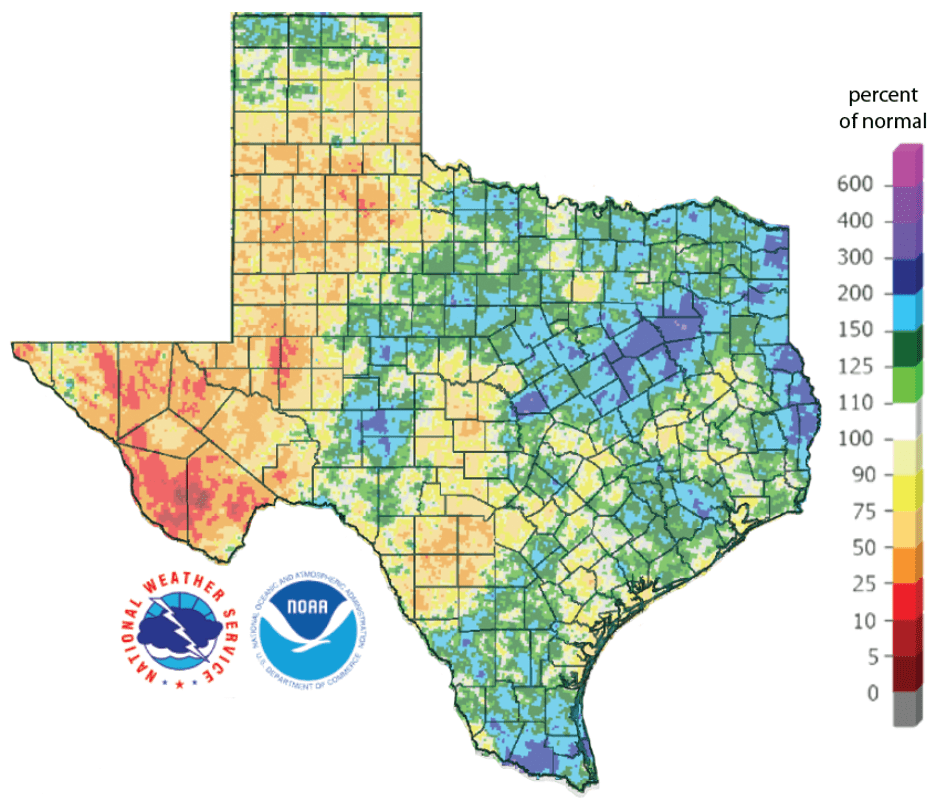
Figure 2c: Rainfall as a percent of normal for the 90 days before September 25, 2020 (source).
The amount of the state under drought conditions (D1-D4) decreased from 57.3 percent four weeks ago to 31.9 percent today (Figure 3a) with a general intensifying of conditions in Far West Texas and parts of the High Plains (Figure 3b). Three areas of Extreme Drought conditions exist in the High Plains, Big Bend area and the Wintergarden area with a pocket of Exceptional Drought in Brewster and Presidio counties in the Big Bend area (Figure 3a). In all, about 45 percent of the state is abnormally dry or worse (D0-D4; Figure 3a), slightly down from 73 percent four weeks ago.
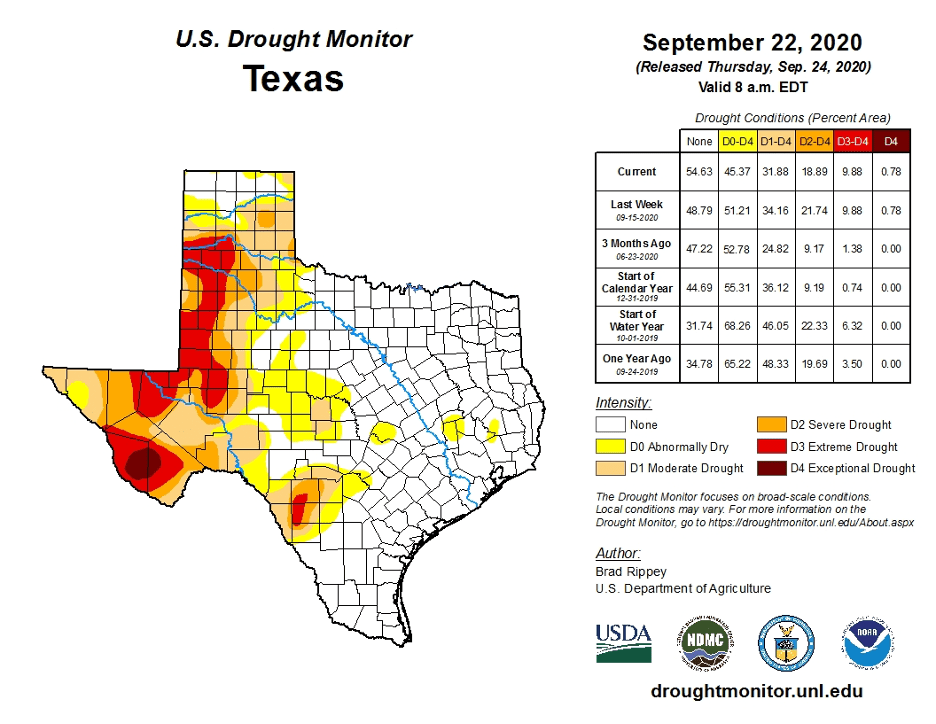
Figure 3a: Drought conditions in Texas according to the U.S. Drought Monitor (as of September 22, 2020; source).
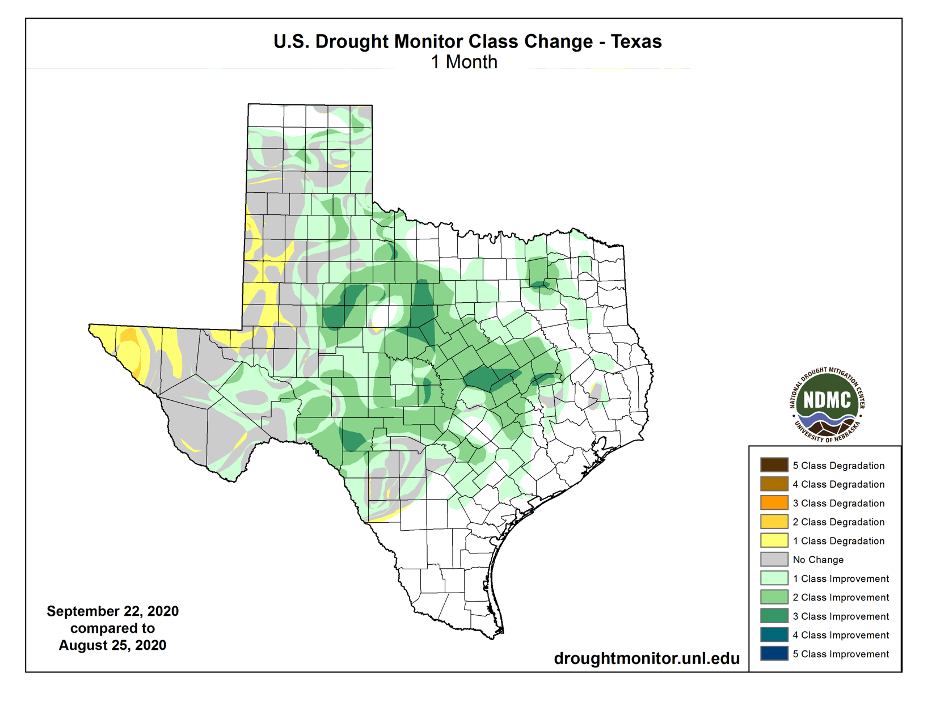
Figure 3b: Changes in the U.S. Drought Monitor for Texas between August 25, 2020 and September 22, 2020 (source).
The North American Drought Monitor for August now shows a large regional drought that stretches from Pacific Northwest down through Texas and deep into Mexico with short-term and long-term effects (Figure 4a). Precipitation in much of the Rio Grande watershed in Colorado and New Mexico over the last 90 days is less than normal with the Sacramento Mountains at less than 25 percent of normal (Figure 4b). Conservation storage in Elephant Butte Reservoir decreased from 6.1 percent full on August 25 to 4.2 percent on September 25, 2020 (Figure 4c).
The Rio Conchos basin in Mexico, which confluences into the Rio Grande just above Presidio and is an important source of water to the lower part of the Rio Grande in Texas, continues to show severe drought conditions (Figure 4a). Combined conservation storage in Amistad and Falcon reservoirs increased over the past month from 42.9 percent on August 25 to 45.9 percent on September 25, about 15 percentage points below normal for this time of year (Figure 4d).
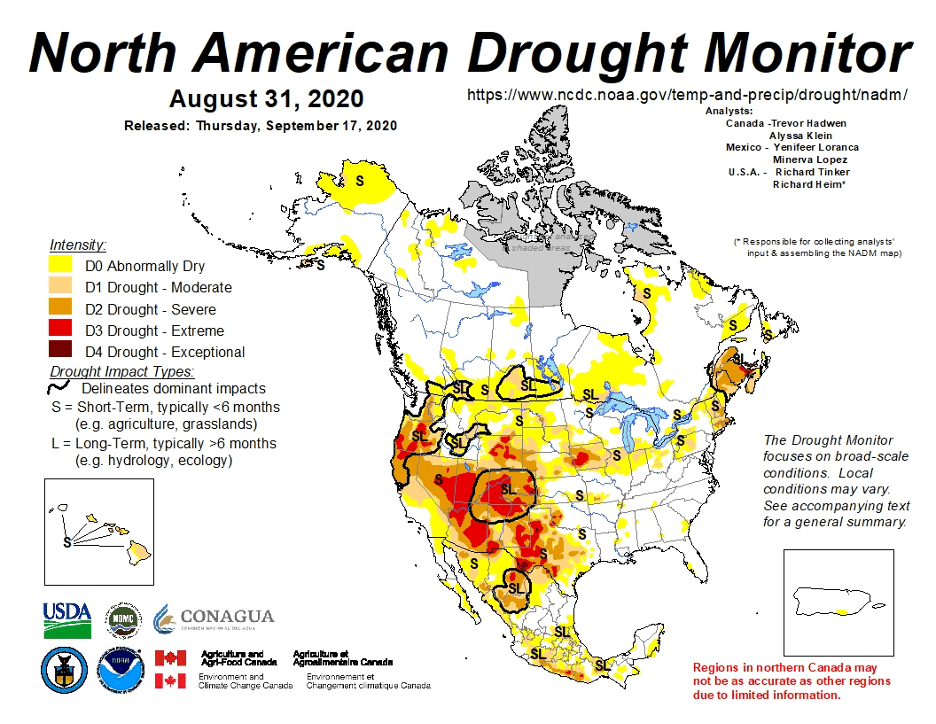
Figure 4a: The North American Drought Monitor for August 31, 2020 (source).
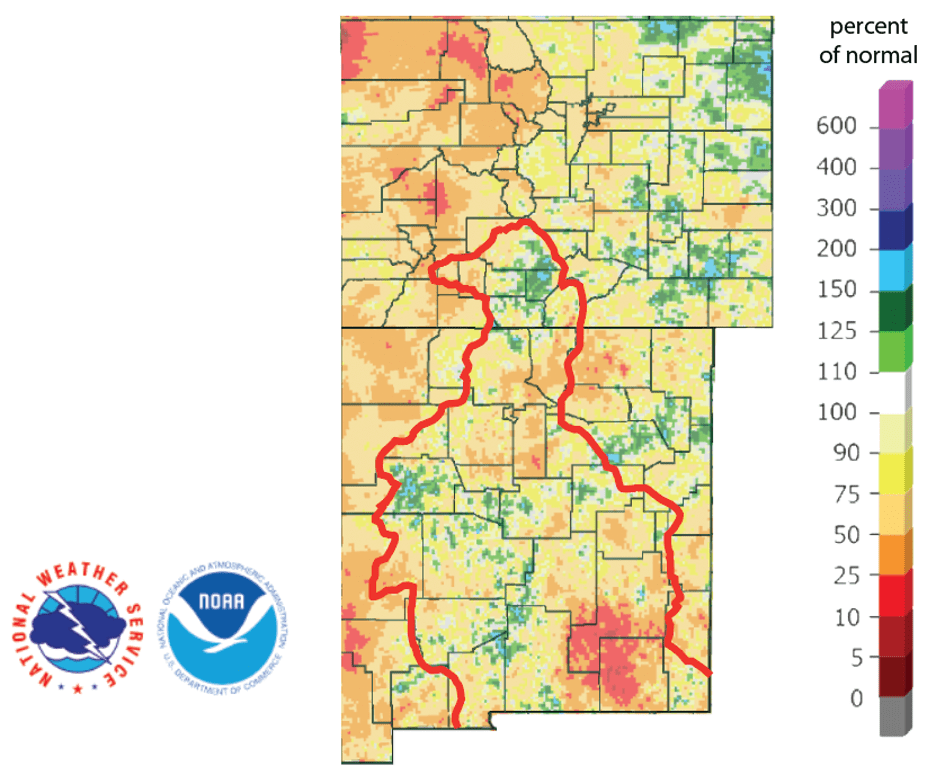
Figure 4b: Percent of normal precipitation for Colorado and New Mexico for the 90 days before September 25, 2020 (source). The red line is the Rio Grande Basin. I use this map to see check precipitation trends in the headwaters of the Rio Grande in southern Colorado, the main source of water to Elephant Butte Reservoir downstream.
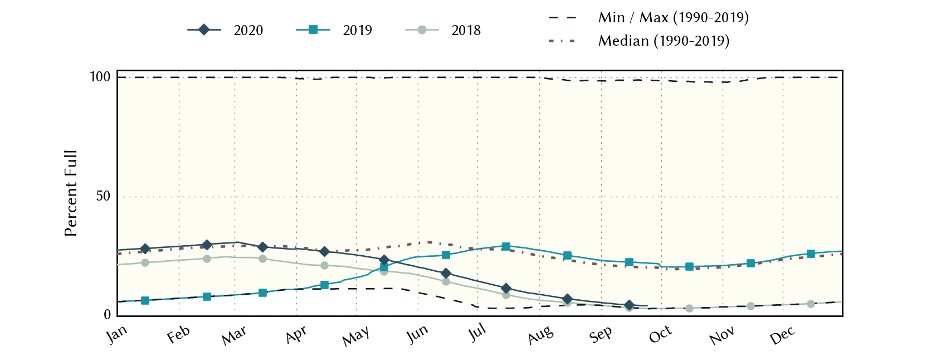
Figure 4c: Reservoir storage in Elephant Butte Reservoir since 2018 with the median, min and max for measurements since 1990 (source).
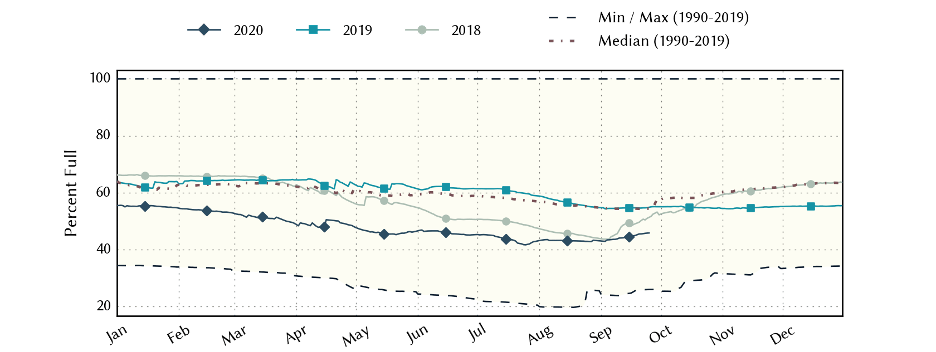
Figure 4d: Reservoir storage in Amistad and Falcon reservoirs since 2018 with the median, min and max for measurements since 1990 (source).
A number of river/stream basins in the state have flows over the seven days less than 25 percent of normal with four catchments with flows less than 10 percent of normal, two less than 5 percent of normal and one in extreme hydrologic drought (Figure 5a). Statewide reservoir storage is at 82.2 percent full as of September 25, down from 80.8 percent a month ago, and a few percentage points above normal for this time of year (Figure 5b). Storage in individual reservoirs increased from last month with a number of reservoirs back above 90 percent full (Figure 5c).
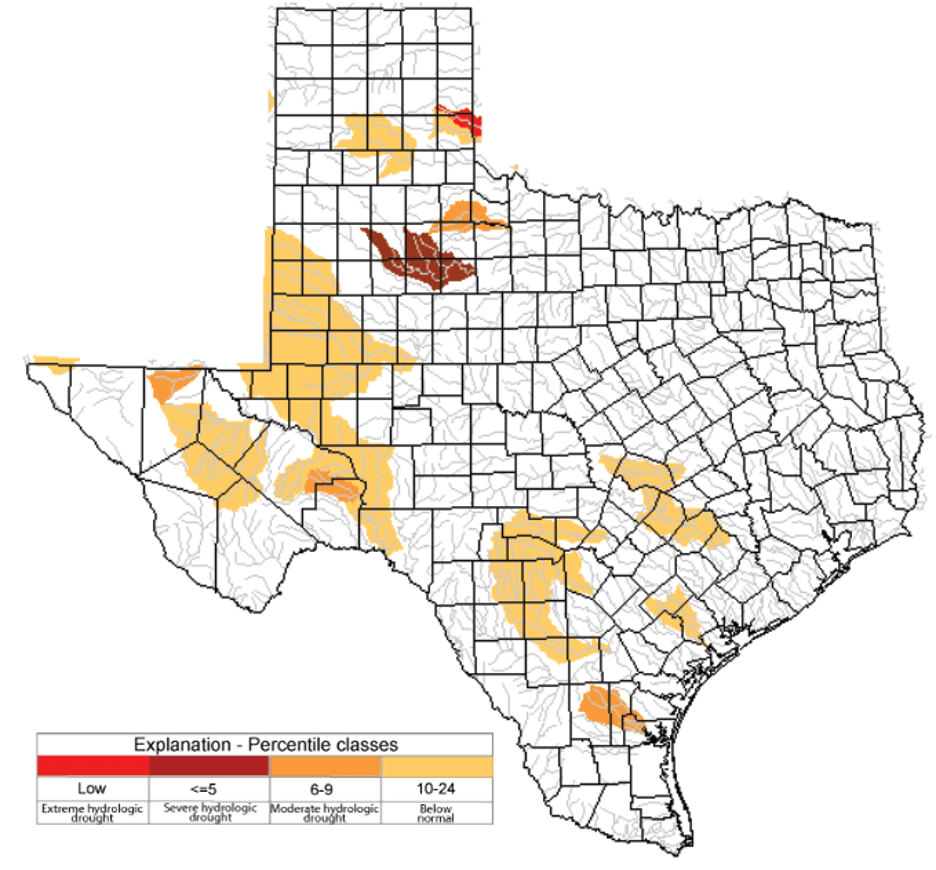
Figure 5a: Parts of the state with below-normal seven-day average streamflow as of September 24, 2020 (source).
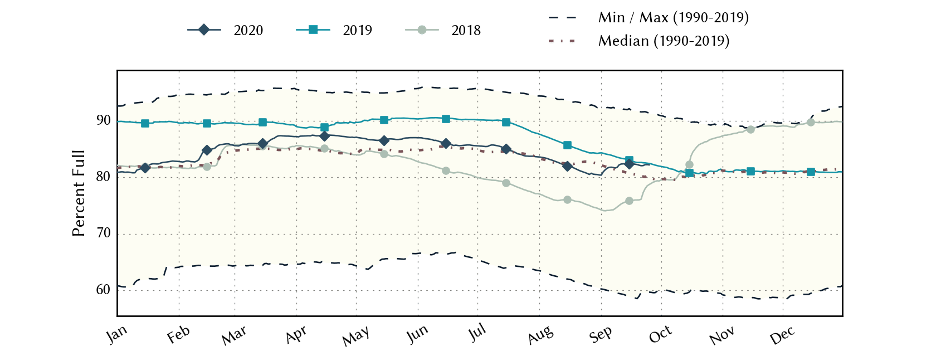
Figure 5b: Statewide reservoir storage since 2018 compared to statistics (median, min and max) for statewide storage since 1990 (source).
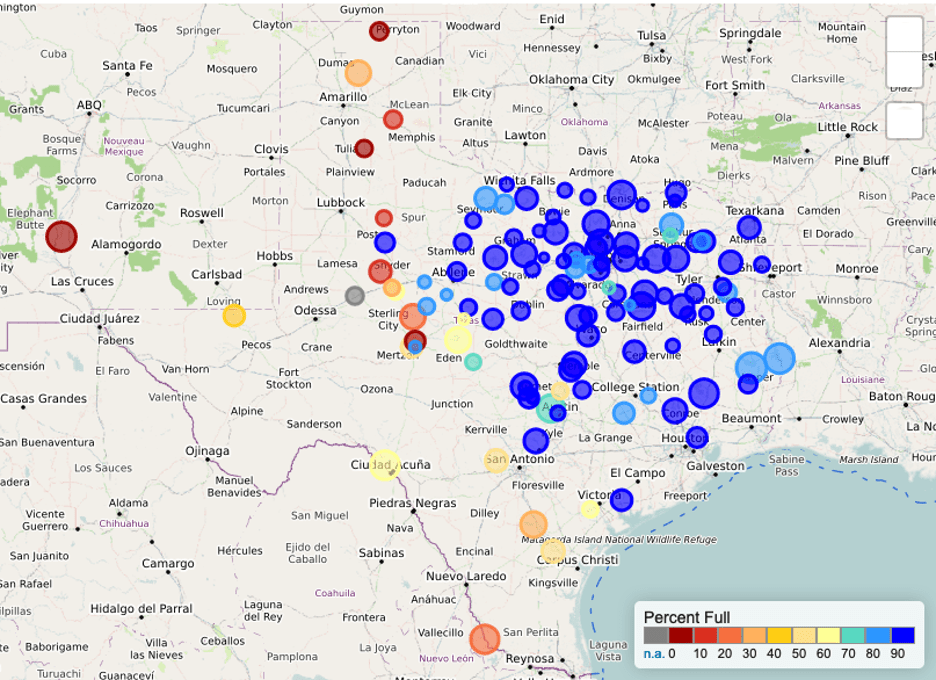
Figure 5c: Reservoir storage as September 25, 2020 in the major reservoirs of the state (source).
Sea-surface temperatures in the Central Pacific entered La Niña conditions in August and are expected to continue their colling trend (Figure 6a). The Climate Prediction Center increased the chance of La Niña conditions from ~5 percent last month to ~75 percent this month for La Niña continuing through the winter (Figure 6b).
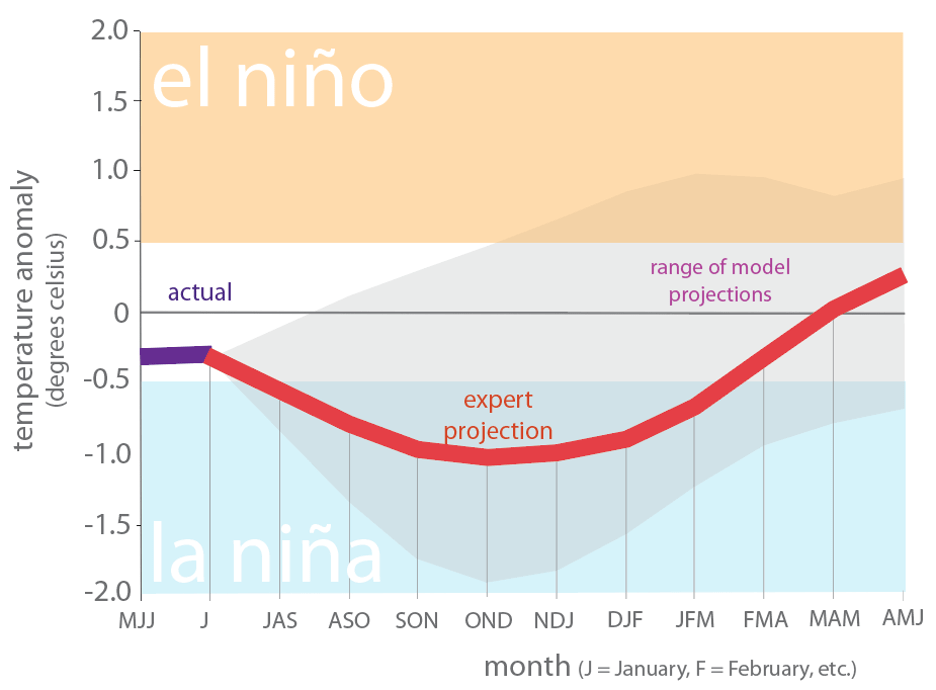
Figure 6a. Forecasts of sea-surface temperature anomalies for the Niño 3.4 Region as of August 19, 2020 (modified from source).
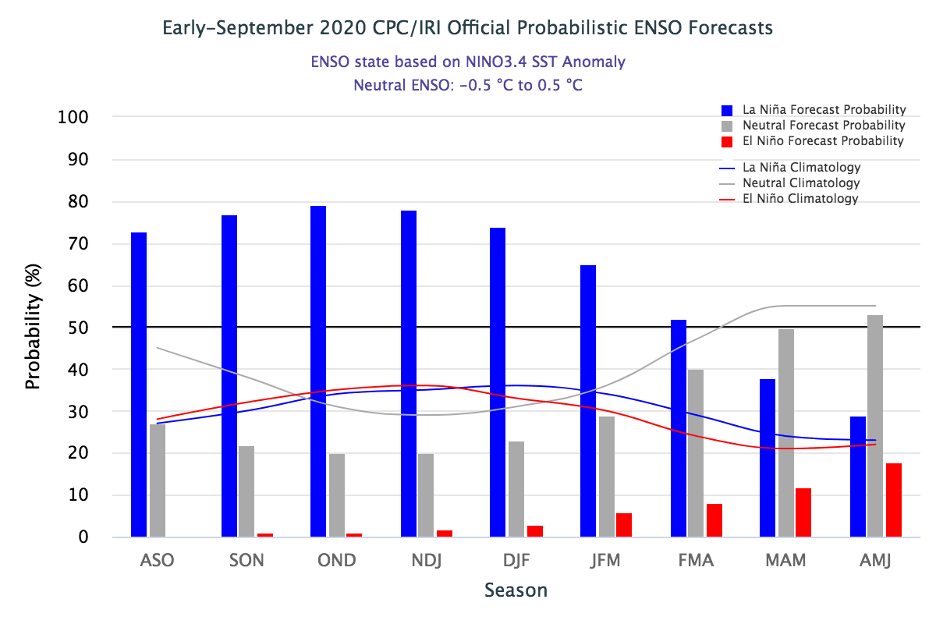
Figure 6b. Probabilistic forecasts of El Niño, La Niña and La Nada conditions (source).
The U.S. Seasonal Drought Outlook through December 31, 2020 projects drought persistence and development in much of West, Far West, Central and East Texas (Figure 7a). The three-month temperature outlook projects warmer-than-normal conditions statewide with greater warming to the west (Figure 7b) while the three-month precipitation slightly favors drier-than-normal conditions for the state (Figure 7c).
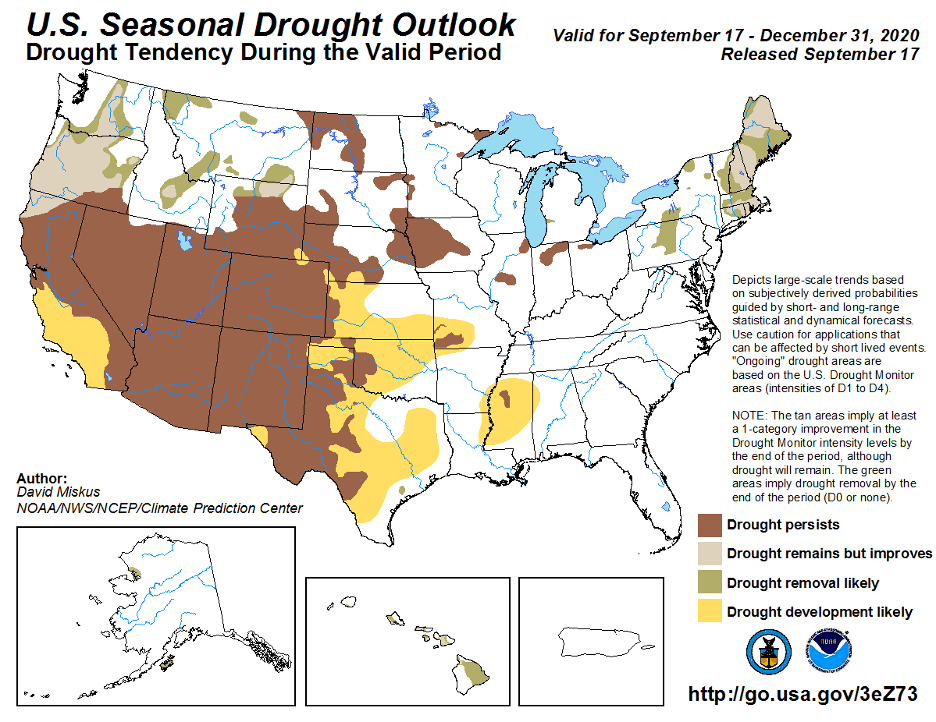
Figure 7a: The U.S. Seasonal Drought Outlook for July 16, 2020, through October 31, 2020 (source).
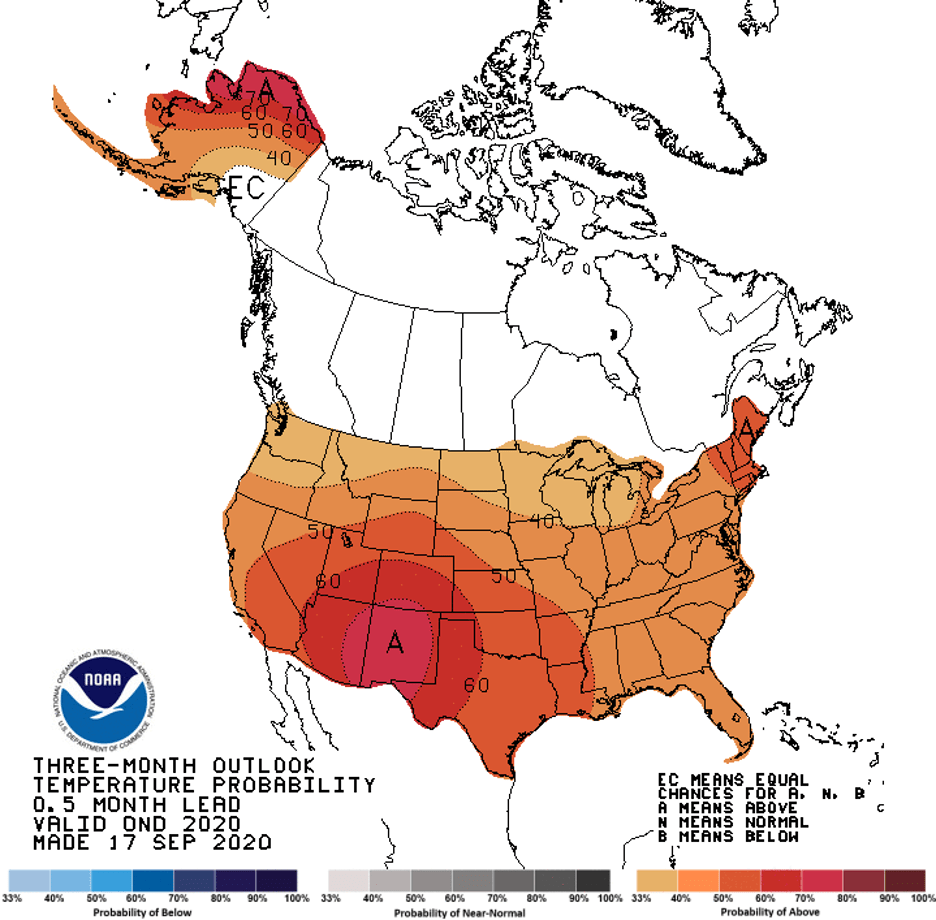
Figure 7b: Three-month temperature outlook from September 17, 2020 (source).
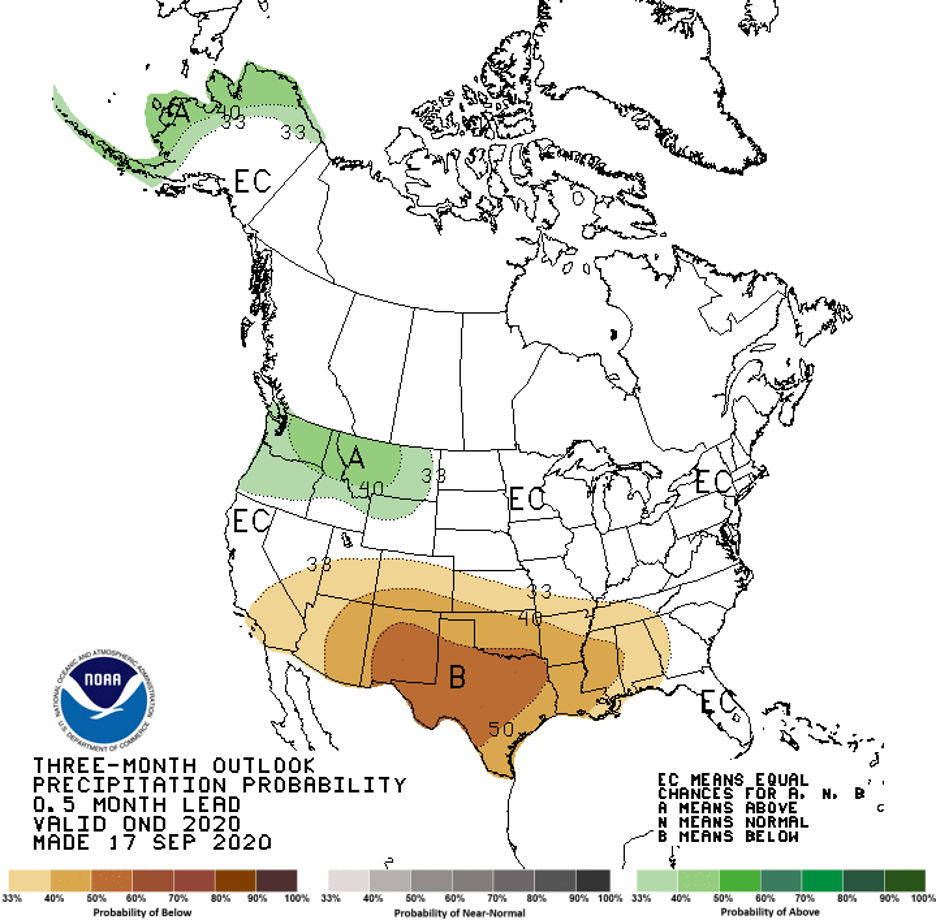
Figure 7c: Three-month precipitation outlook from September 17, 2020 (source).
Author

Robert Mace
Executive Director & Chief Water Policy Officer at The Meadows Center for Water and the Environment
Robert Mace is the Executive Director and the Chief Water Policy Officer at the Meadows Center. He is also Professor of Practice in the Department of Geography at Texas State University. Robert has over 30 years of experience in hydrology, hydrogeology, stakeholder processes, and water policy, mostly in Texas.
