SUMMARY:
- Recent winter storms have improved drought conditions across much of the state, but…
- Extreme and exceptional drought conditions remain on the High Plains, Far West Texas, South Texas and the Lower Rio Grande Valley.
- 2020 was the seventh warmest year on record in Texas.
I wrote this article on January 22, 2020.
A new year is a time for reflection, so let’s reflect climatically on 2020. Looking back on the year, 2020 was, on average, warmer than normal, clocking in as the seventh warmest year in Texas for the 126-year record. For the average maximum temperature, 2020 in Texas came in 11th at 79.4 °F, behind 2011 which holds the top spot with 80.9 °F. For average low temperature in Texas, 2020 was the sixth warmest at 54.2 °F with 2016 the warmest at 55.2 °F. Average annual rainfall for the state was 26.04 inches, the 54th driest (out of 126 years which has an average of 27.2 inches).
For the U.S., 2020 was the fifth warmest on record at 2.35 °F warmer than the 1901 through 2000 baseline. The warmest year for the U.S. was 2012, which came in at 3.26 °F warmer than the baseline. Globally, the planet had its second warmest year on record in 2020 at 1.76 °F warmer than the 1901 through 2000 average (with 2016 as the warmest at 1.80 °F warmer).
New Year’s resolution? Try not to be so hot under the collar (but we may not have a choice).

Figure 1: Haywood plot for Texas showing year-to-date average temperature with the five warmest years, five coolest years, 2020, and period of record average with all other years in light gray (source).
Parts of East Texas received more than 10 inches of rain over the past 30 days with widespread rainfalls (even snow!) across much of Central, North-Central, and near-West Texas benefitting from 2 to 4 inches of precipitation (Figure 2a). However, much of the Panhandle, Far West Texas and a large part of the Lower Rio Grande Valley received less than half an inch (Figure 2a).
Much of West Texas, particularly the Edwards Plateau, benefitted from at least three times normal precipitation over the past 30 days with the aforementioned Panhandle, Far West Texas and Lower Rio Grande Valley receiving less than normal, often less than half of normal (Figure 2b). Although precipitation over the past 30 days greatly decreased rainfall deficits, the vast majority of the state remains with less-than-normal precipitation over the past 90 days (Figure 2c).

Figure 2a: Inches of precipitation that fell in Texas in the 30 days before January 22, 2021 (source). Note that cooler colors indicate lower values and warmer indicate higher values.

Figure 2b: Rainfall as a percent of normal for the 30 days before January 22, 2021 (source).

Figure 2c: Rainfall as a percent of normal for the 90 days before January 22, 2021 (source).
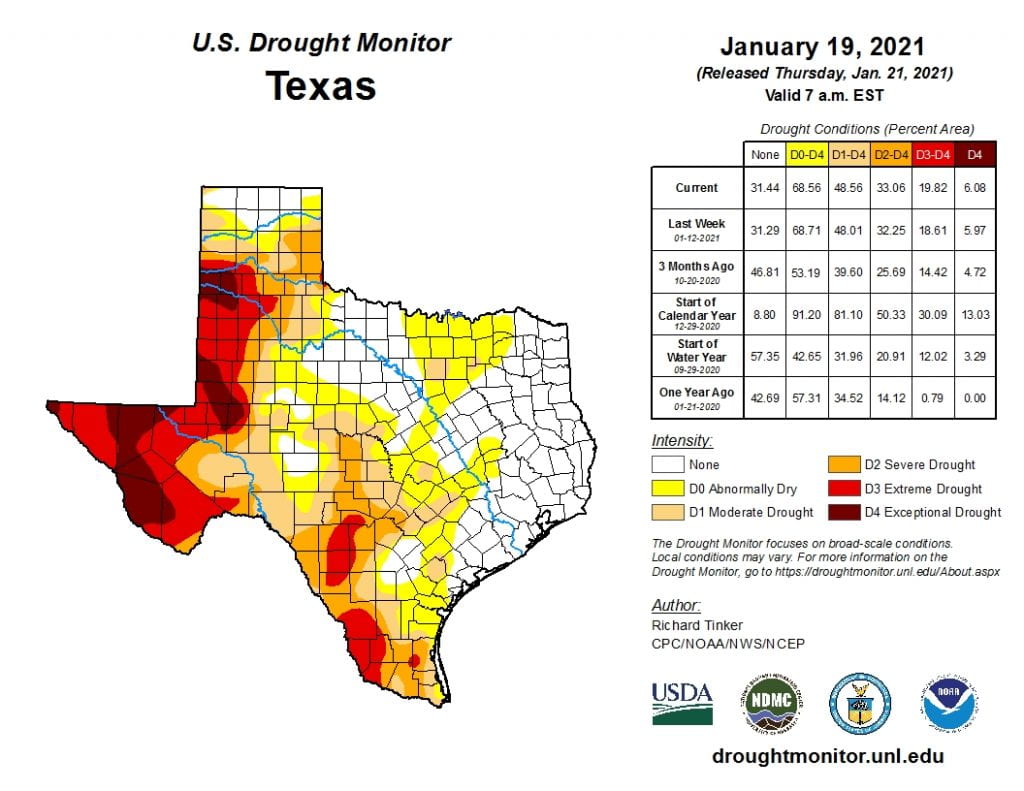
The amount of the state under drought conditions (D1–D4) decreased from 78.4 percent four weeks ago to 48.6 percent over the past four weeks (Figure 3a) with drought dissolving away in East, North-Central and parts of West Texas (Figure 3b). Exceptional Drought—focused in West and Far West Texas—remains in 6.1 percent of the state (Figure 3a). In all, 68.6 percent of the state is abnormally dry or worse (D0–D4; Figure 3a), down from 92.5 percent four weeks ago.

Figure 3a: Drought conditions in Texas according to the U.S. Drought Monitor (as of January 19, 2021; source).

Figure 3b: Changes in the U.S. Drought Monitor for Texas between December 22, 2020, and January 19, 2021 (source).
The North American Drought Monitor for December continues to show a raging drought in much of the western United States with Exceptional Drought entrenched in the American Southwest (Figure 4a). Precipitation in most of the Rio Grande watershed in Colorado and New Mexico over the last 90 days is less than normal but with parts of southern Colorado receiving more than 1.5 times normal precipitation (Figure 4b). Conservation storage in Elephant Butte Reservoir increased slightly from 6.0 percent full on December 22 to 7.4 percent on January 22 (Figure 4c), near historic lows.
The Rio Conchos basin in Mexico, which confluences into the Rio Grande just above Presidio and is an important source of water to the lower part of the Rio Grande in Texas, has parts that are Abnormally Dry, down from the Severe to Extreme conditions of last fall Figure 4a). Combined conservation storage in Amistad and Falcon reservoirs decreased over the past month from 48.7 percent on December 20 to 47.5 percent on January 22, about 13 percentage points below normal for this time of year (Figure 4d).

Figure 4a: The North American Drought Monitor for December 30, 2020 (source).

Figure 4b: Percent of normal precipitation for Colorado and New Mexico for the 90 days before January 22, 2021 (source). The red line is the Rio Grande Basin. I use this map to see check precipitation trends in the headwaters of the Rio Grande in southern Colorado, the main source of water to Elephant Butte Reservoir downstream.

Figure 4c: Reservoir storage in Elephant Butte Reservoir since 2019 with the median, min and max for measurements from 1990 through 2020 (source).

Figure 4d: Reservoir storage in Amistad and Falcon reservoirs since 2019 with the median, min and max for measurements from 1990 through 2020 (source).
A number of river/stream basins in the state have flows over the past seven days that are less than 25 percent of normal with several catchments in severe hydrologic drought with flows less than 5 percent of normal (Figure 5a). Statewide reservoir storage is at 82.3 percent full as of January 22, up from 79.7 percent a month ago, and about normal for this time of year (Figure 5b). Many reservoirs in east and northeast Texas are noticeably fuller than last month (Figure 5c).

Figure 5a: Parts of the state with below-normal seven-day average streamflow as of January 21, 2021 (source).

Figure 5b: Statewide reservoir storage since 2019 compared to statistics (median, min and max) for statewide storage from 1990 through 2020 (source).

Figure 5c: Reservoir storage as January 22, 2021 in the major reservoirs of the state (source).
Sea-surface temperatures in the Central Pacific entered La Niña conditions in August and have continued their cooling trend (Figure 6a). The Climate Prediction Center maintains the chance of La Niña conditions continuing through the winter (through March) at ~95 percent with a ~55 percent chance of neutral conditions for April through June (Figure 6b).

Figure 6a: Forecasts of sea-surface temperature anomalies for the Niño 3.4 Region as of December 19, 2020 (modified from source).

Figure 6b: Probabilistic forecasts of El Niño, La Niña and La Nada conditions (source).
The U.S. Seasonal Drought Outlook through April 30, 2021 projects drought persistence and development for the western half of Texas (Figure 7a). The three-month temperature outlook projects warmer-than-normal conditions statewide with greater warming to the southwest (Figure 7b) while the three-month precipitation slightly favors drier-than-normal conditions for the state with drier conditions in West and Far West Texas (Figure 7c).

Figure 7a: The U.S. Seasonal Drought Outlook for January 21, 2021, through April 30, 2021 (source).

Figure 7b: Three-month temperature outlook from December 17, 2020 (source).

Figure 7c: Three-month precipitation outlook from January 21, 2020 (source).