SUMMARY:
- Drought conditions increased 52 percent across the state with about two thirds of the state now in a drought.
- Sea-surface temperatures are expected to flirt with La Niña conditions through early fall.
- We are seeing more hurricanes over time (and an early projection is for a more-active-than-normal season this year).
I wrote this article on March 19, 2021.
With the Great Ice Storm of ‘21 behind us, is it too early to think about hurricanes? Regardless, the Hurricane Committee of the World Meteorological Organization has been talking about hurricanes. The committee is considering moving the official start of hurricane season from June 1 to May 15 due to more and more storms forming before June. The committee decided against moving the season’s start at the moment until they have more information about the consequences of shifting the date. Regardless, the National Hurricane Center will move its first outlook from June 1 to May 15 this year.
The committee decided to dispense with naming storms after Greek letters once the English alphabet runs dry and will instead loop back to the beginning of the English alphabet (Figure 1). There were fears that the Greek letters sounded too familiar to each other last year, they don’t translate well into other languages and the committee never anticipated having to retire Greek-lettered storms. Speaking of retirements, the committee also retired the names Dorian, Laura, Eta, and Iota from the last two seasons (non-retired tropical storm names are recycled after six years).
Last year was the sixth straight tropical storm season with above-average activity, begging the question: What’s normal anymore? Thirty years ago, the average number of named storms (calculated over the previous 30 years) was 10; 10 years ago, it was 12.1; today, it’s 14.4. Many scientists believe warmer temperatures are leading to warmer oceans, which is leading to a longer and stronger hurricane season. The average season is recalculated every 10 years on the decade, so we’re due for a reset this year.
It’s still too early for many of the usual hurricane prognosticators to prognosticate. For example, the Climate Prediction Center doesn’t release its first hurricane season outlook until May. Tropical Storm Risk, associated with University College London, released an extended outlook in early December that projects a more-active-than-normal season but one not as crazy as 2020. A big reason for an above-normal projection is the expectation of weak La Niña conditions through the end of summer. The authors qualify their projection as having large uncertainties and low forecast skill, but based on the recent past and what’s happening with the El Niño Southern Oscillation, I’d place chips on it!
Sources:
Hurricane Committee discusses record-breaking 2020 season, plans for 2021
WMO Hurricane Committee retires tropical cyclone names and ends the use of Greek alphabet
Bye Alpha, Eta: Greek alphabet ditched for hurricane names

Figure 1: Names and supplemental names for the tropical storms for the 2021 season.
The past 30 days have been drier than previous months, with parts of East Texas receiving more than 6 inches of precipitation and much of the rest of the state receiving less than 1.5 inches (Figure 2a). Far West Texas, the Lower Rio Grande Valley, and the Southern High Plains received less than 0.1 inches of precipitation over the past 30 days (Figure 2a).
Most of the state received less than normal precipitation over the past 30 days with a large part suffering less than 25 percent of normal (Figure 2b). The majority of the state remains with less-than-normal precipitation over the past 90 days with the Lower Rio Grande Valley suffering from 25 to 50 percent less than normal (Figure 2c).

Figure 2a: Inches of precipitation that fell in Texas in the 30 days before March 19, 2021 (source). Note that cooler colors indicate lower values and warmer indicate higher values.

Figure 2b: Rainfall as a percent of normal for the 30 days before March 19, 2021 ( source).

Figure 2c: Rainfall as a percent of normal for the 90 days before March 19, 2021 (source).
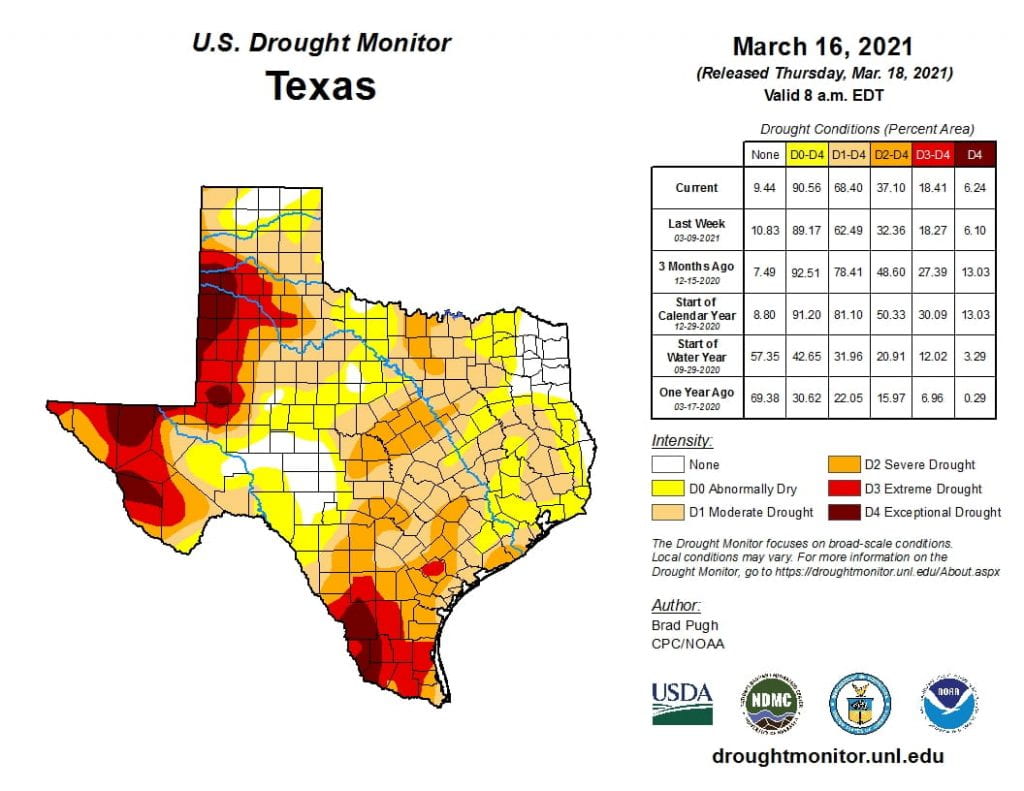
The amount of the state under drought conditions (D1–D4) increased from 44.9 percent four weeks ago to 68.4 percent at present (Figure 3a) with drought fading a wee bit in West and Far West Texas as well as in the Panhandle but drought dramatically expanding across the Gulf Coastal Plains and across North Texas (Figure 3b).
Exceptional Drought—focused in West and Far West Texas and the Lower Rio Grande Valley—increased from 5.2 percent of the state four weeks ago to 6.2 percent at present (Figure 3a). In all, 90.6 percent of the state is abnormally dry or worse (D0–D4; Figure 3a), up from 72.8 percent four weeks ago.

Figure 3a: Drought conditions in Texas according to the U.S. Drought Monitor (as of March 16, 2021; source).

Figure 3b: Changes in the U.S. Drought Monitor for Texas between February 16, 2021 and March 16, 2021 (source).
The North American Drought Monitor for February continues to show a raging drought in much of the western United States with Exceptional Drought entrenched in the American Southwest (Figure 4a). Precipitation in most of the Rio Grande watershed in Colorado and New Mexico over the last 90 days is less than normal but with small parts of southern Colorado receiving more than 1.5 times normal precipitation (Figure 4b). Conservation storage in Elephant Butte Reservoir increased from 8.7 percent full on February 20 to 9.9 percent on March 19 (Figure 4c), at or near historic (since 1990) lows.
The Rio Conchos basin in Mexico, which confluences into the Rio Grande just above Presidio and is an important source of water to the lower part of the Rio Grande in Texas, is in Moderate to Severe drought conditions (Figure 4a). Combined conservation storage in Amistad and Falcon reservoirs decreased over the past month from 45.1 percent on February 20 to 44.1 percent on March 19, about 20 percentage points below normal for this time of year (Figure 4d).

Figure 4a: The North American Drought Monitor for February 28, 2021 (source).

Figure 4b: Percent of normal precipitation for Colorado and New Mexico for the 90 days before March 19, 2021 (source). The red line is the Rio Grande Basin. I use this map to see check precipitation trends in the headwaters of the Rio Grande in southern Colorado, the main source of water to Elephant Butte Reservoir downstream.

Figure 4c: Reservoir storage in Elephant Butte Reservoir since 2019 with the median, min, and max for measurements from 1990 through 2020 (source).

Figure 4d: Reservoir storage in Amistad and Falcon reservoirs since 2019 with the median, min, and max for measurements from 1990 through 2020 (source).
The number of river/stream basins in the state with low flows increased dramatically over the last month, reflecting the expansion of drought conditions across the state (Figure 5a). Statewide reservoir storage is at 82.0 percent full as of March 19, up from 81.5 percent a month ago but now four percentage points below normal for this time of year (Figure 5b). A few reservoirs in East Texas have been topped off since last month (Figure 5c).

Figure 5a: Parts of the state with below-normal seven-day average streamflow as of March 19, 2021 (source).

Figure 5b: Statewide reservoir storage since 2019 compared to statistics (median, min, and max) for statewide storage from 1990 through 2020 (source).

Figure 5c: Reservoir storage as March 19, 2021 in the major reservoirs of the state (source).
Sea-surface temperatures in the Central Pacific that, in part, define the status of the El Niño Southern Oscillation, continued their warming trend (Figure 6a). Projections of sea-surface temperatures are about half a degree cooler than they were last month, now just above La Niña conditions through the late summer/early fall (Figure 6a). The Climate Prediction Center continues to give a ~60 percent chance of neutral conditions developing in the spring (Figure 6b).

Figure 6a. Forecasts of sea-surface temperature anomalies for the Niño 3.4 Region as of February 19, 2021 (modified from source). “Range of model predictions -1” means that I show the range of the various statistical and dynamical models projections minus the most outlying upper and lower simulations.

Figure 6b. Probabilistic forecasts of El Niño, La Niña, and La Nada conditions (source).
The U.S. Seasonal Drought Outlook through June 30, 2021 projects drought persistence and development for almost the entirety of Texas (Figure 7a). The three-month temperature outlook projects warmer-than-normal conditions statewide with greater warming to the southwest (Figure 7b) while the three-month precipitation slightly favors drier-than-normal conditions for the state (Figure 7c).

Figure 7a: The U.S. Seasonal Drought Outlook for March 18, 2021, through June 30, 2021 (source).

Figure 7b: Three-month temperature outlook from March 18, 2021 (source).

Figure 7c: Three-month precipitation outlook from March 18, 2021 (source).