
SUMMARY:
- Two-thirds of the state remain in an intensifying drought expected to continue through at least the end of July.
- Sea-surface temperatures are expected to transition to neutral conditions over the next month and possibly return to La Niña conditions in early fall.
- The average hurricane season now includes two additional named storms and one additional hurricane.
I wrote this article on April 25, 2021.
Average climate conditions are generally defined over 30 years, and those conditions are changing. For example, every ten years, on the decade, the National Oceanic and Atmospheric Administration (NOAA) revisits and revises the average Atlantic hurricane season. As a consequence, the average season now consists of 14 named storms and seven hurricanes, up from 12 named storms and six hurricanes (the number of major hurricanes remains the same at three; Figure 1). NOAA notes that the past 30 years have been active and that the increase in storms may be due to better observing platforms, the warming phase for the Atlantic Multi-decadal Oscillation, and climate change.
The median levels of the state’s more western reservoirs, something the Texas Water Development Board defines as levels since 1990 recalculated every year, are telling. For example, the median storage in Elephant Butte Reservoir is about 25 percent full. For the O.C. Fisher and E.V. Spence reservoirs, it’s about 10 and 15 percent full, respectively. And there’s more and more talk of the drought in the American Southwest, which I believe reaches into West Texas as far east as San Angelo, as a new megadrought, a drought that lasts decades (we’re about halfway through the third decade of this drought).
Part of me wonders and worries about resetting the averages. Are we inadvertently normalizing climate change into what many already call “the new normal”? I understand the need to reset the averages to set expectations and for planning purposes. And in a system with systematic increases, the balance of years will still tilt toward greater than “normal” conditions. But as temperatures continue to rise, there is no “new normal”—there’s simply no normal at all.

Figure 1: Revised average Atlantic hurricane season (source).
The past 30 days have been drier than previous months with the eastern parts of East Texas receiving more than 6 inches of precipitation with much of the rest of the state receiving less than 1.5 inches (Figure 2a). Large parts of Far West Texas, the Rio Grande Valley, and the High Plains received less than 0.25 inches of rain over the past 30 days (Figure 2a). The majority of the state received less than normal precipitation over the past 30 days with a large part continuing to suffer from less than 25 percent of normal (Figure 2b). The vast majority of the state remains with less-than-normal precipitation over the past 90 days with the Lower Rio Grande Valley, the Big Bend area, and parts of the High Plains suffering from 25 percent less than normal (Figure 2c).

Figure 2a: Inches of precipitation that fell in Texas in the 30 days before April 25, 2021 (source). Note that cooler colors indicate lower values and warmer indicate higher values.
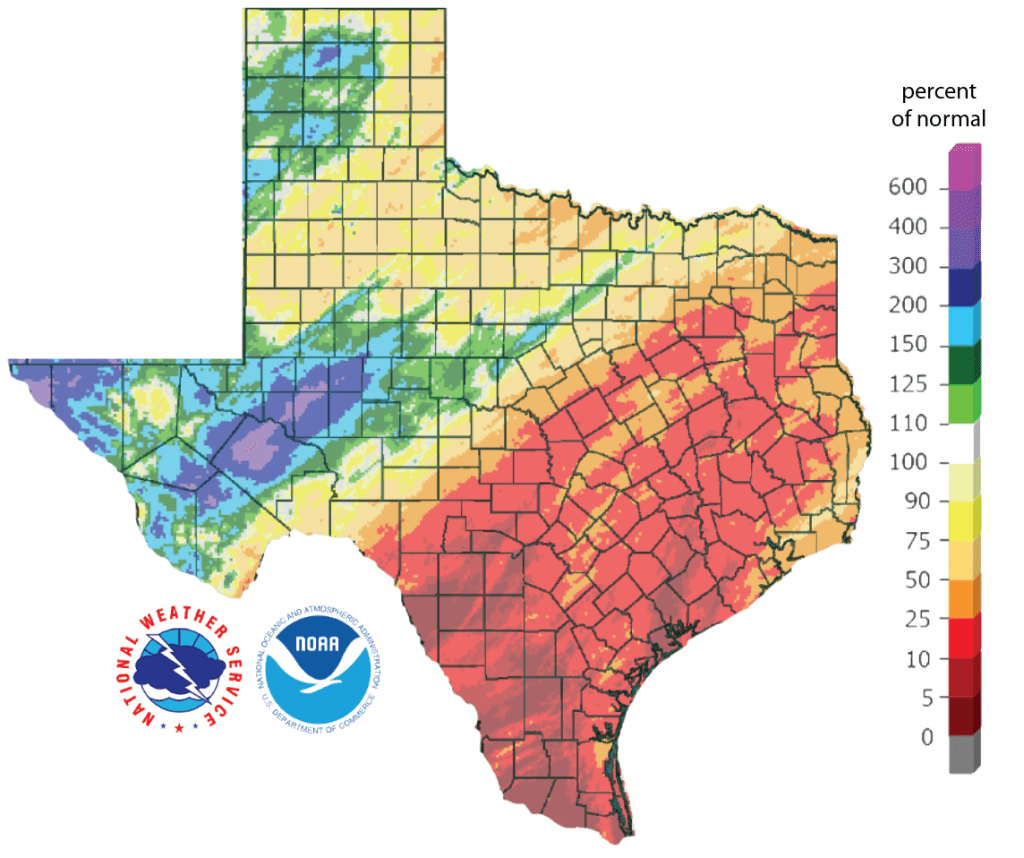
Figure 2b: Rainfall as a percent of normal for the 30 days before April 25, 2021 (source).

Figure 2c: Rainfall as a percent of normal for the 90 days before April 25, 2021 (source).
The amount of the state under drought conditions (D1–D4) decreased slightly from 68.4 percent four weeks ago to 67.1 percent at present (Figure 3a) with drought fading in northern parts of the state but intensifying elsewhere (Figure 3b). Exceptional Drought—focused on Far West Texas, the High Plains, and the Lower Rio Grande Valley—increased from 6.2 percent of the state four weeks ago to 9.0 percent at present (Figure 3a). In all, 87.6 percent of the state is abnormally dry or worse (D0–D4; Figure 3a), down slightly from 90.6 percent four weeks ago.

Figure 3a: Drought conditions in Texas according to the U.S. Drought Monitor (as of April 20, 2021; source).

Figure 3b: Changes in the U.S. Drought Monitor for Texas between March 23, 2021, and April 20, 2021 (source).
The North American Drought Monitor for March continues to show a raging drought in much of the western United States with Exceptional Drought entrenched in the American Southwest (Figure 4a). Precipitation in most of the Rio Grande watershed in Colorado and New Mexico over the last 90 days continues to be predominantly less than normal (Figure 4b). Conservation storage in Elephant Butte Reservoir increased from 9.9 percent full last month to 11.3 percent (Figure 4c), at or near historic (since 1990) lows.
The Rio Conchos basin in Mexico, which confluences into the Rio Grande just above Presidio and is an important source of water to the lower part of the Rio Grande in Texas, is in Moderate to Severe drought conditions (Figure 4a). Combined conservation storage in Amistad and Falcon reservoirs decreased over the past month from 44.1 percent a month ago to 39.8 percent today, about 20 percentage points below normal for this time of year (Figure 4d).

Figure 4a: The North American Drought Monitor for March 31, 2021 (source).

Figure 4b: Percent of normal precipitation for Colorado and New Mexico for the 90 days before April 25, 2021 (source). The red line is the Rio Grande Basin. I use this map to see check precipitation trends in the headwaters of the Rio Grande in southern Colorado, the main source of water to Elephant Butte Reservoir downstream.

Figure 4c: Reservoir storage in Elephant Butte Reservoir since 2019 with the median, min, and max for measurements from 1990 through 2020 (source).

Figure 4d: Reservoir storage in Amistad and Falcon reservoirs since 2019 with the median, min, and max for measurements from 1990 through 2020 (source).
There are a number of river/stream basins in the state with low flows, especially in South-Central Texas down to the Gulf of Mexico (Figure 5a). Statewide reservoir storage is at 82.1 percent full as of today, up ever slightly from 82.0 percent a month ago and about three percentage points below normal for this time of year (Figure 5b). A dozen or so reservoirs are below 90 percent full in north-central Texas, unusual for this time of year (Figure 5c).

Figure 5a: Parts of the state with below-normal seven-day average streamflow as of April 24, 2021 (source).

Figure 5b: Statewide reservoir storage since 2019 compared to statistics (median, min, and max) for statewide storage from 1990 through 2020 (source).

Figure 5c: Reservoir storage as April 25, 2021 in the major reservoirs of the state (source).
Sea-surface temperatures in the Central Pacific that, in part, define the status of the El Niño Southern Oscillation, continued their warming trend (Figure 6a). Projections of sea-surface temperatures remain just above La Niña conditions through the summer with the possible return to La Niña conditions in late summer/early fall (Figure 6a). The jump in temperature projections in late fall and early winter appears to be an artifact reflecting uncertainty in projecting that far in the future, and therefore seemingly defaults to neutral conditions. The Climate Prediction Center projects the transition from La Niña to neutral conditions to occur over the next month with an 80 percent chance of neutral conditions holding through July (Figure 6b).

Figure 6a. Forecasts of sea-surface temperature anomalies for the Niño 3.4 Region as of March 19, 2021 (modified from source). “Range of model predictions -1” is the range of the various statistical and dynamical models’ projections minus the most outlying upper and lower projections.

Figure 6b. Probabilistic forecasts of El Niño, La Niña, and La Nada conditions (source).
The U.S. Seasonal Drought Outlook through July 31, 2021, projects drought persistence and development for almost the entirety of Texas with the removal of drought conditions in the southeastern part of the state (Figure 7a). The three-month temperature outlook projects (surprise, surprise…) warmer-than-normal conditions statewide (Figure 7b) while the three-month precipitation slightly favors drier-than-normal conditions for the state (Figure 7c).

Figure 7a: The U.S. Seasonal Drought Outlook for April 15, 2021, through July 31, 2021 (source).

Figure 7b: Three-month temperature outlook from April 15, 2021 (source).

Figure 7c: Three-month precipitation outlook from April 15, 2021 (source).