SUMMARY:
-
La Niña is here with an 87% chance of staying through February
-
Drought intensified across the state, expanding from about 5% four weeks ago to 19% today
-
Most of the state is expected to be in drought over the next three months
I wrote this article on October 23, 2021.
La Niña officially arrived over the past month. Her arrival portends a tendency toward drier-than-normal and warmer-than-normal conditions for the winter. This is also the second winter in a row we have experienced La Niña conditions, albeit both La Niñas were somewhat weak, with sea-surface temperatures barely dipping below the 0.5 degrees Celsius cooler-than-normal (along with the atmospheric connection) for her existence.
The cooler La Niña sea-surface temps push the jet stream north, generally resulting in fewer weather systems (and therefore fewer precipitation events) in the southern part of the United States (Figure 1a). La Niña taketh and La Niña giveth, with wetter-than-normal-conditions expected in the Pacific Northwest and eastern Midwest and colder temps in the upper western Midwest (Figure 1a).
Note that La Niña does not guarantee drier-than-normal conditions. During some La Niñas, the winter months were wetter than normal (Figure 1b). Nonetheless, in general, La Niña results in drier-than-normal conditions.
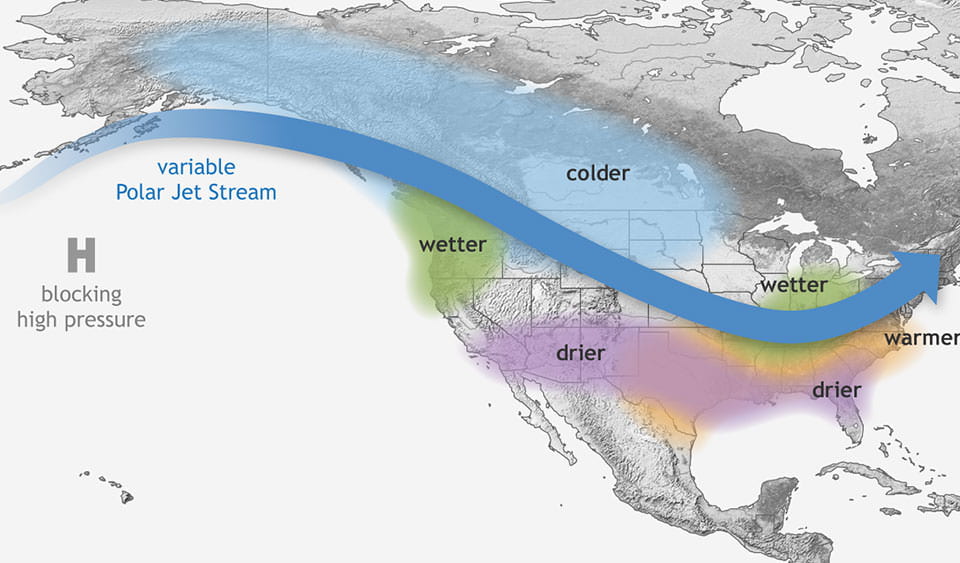
Figure 1a: The jet stream under La Niña conditions (source).
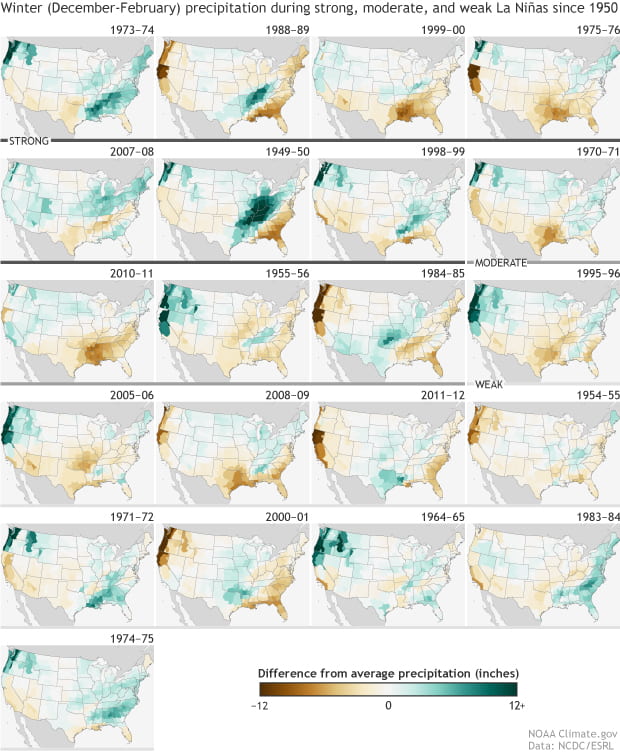
Figure 1b: Winter precipitation patterns during every La Niña between 1950 and 2017 (source).
The remnants of tropical storm Pamela dowsed the central part of the Gulf Coastal Plains with more than 6 to 10 inches of rain, while much of the rest of the state saw less than an inch of rain (Figure 2a). A sizable hunk of the state saw less than normal rainfall over the past month (Figure 2b). Rain over the past 90 days is much less than normal in the Big Bend area with most of the rest of state below normal (Figure 2c).
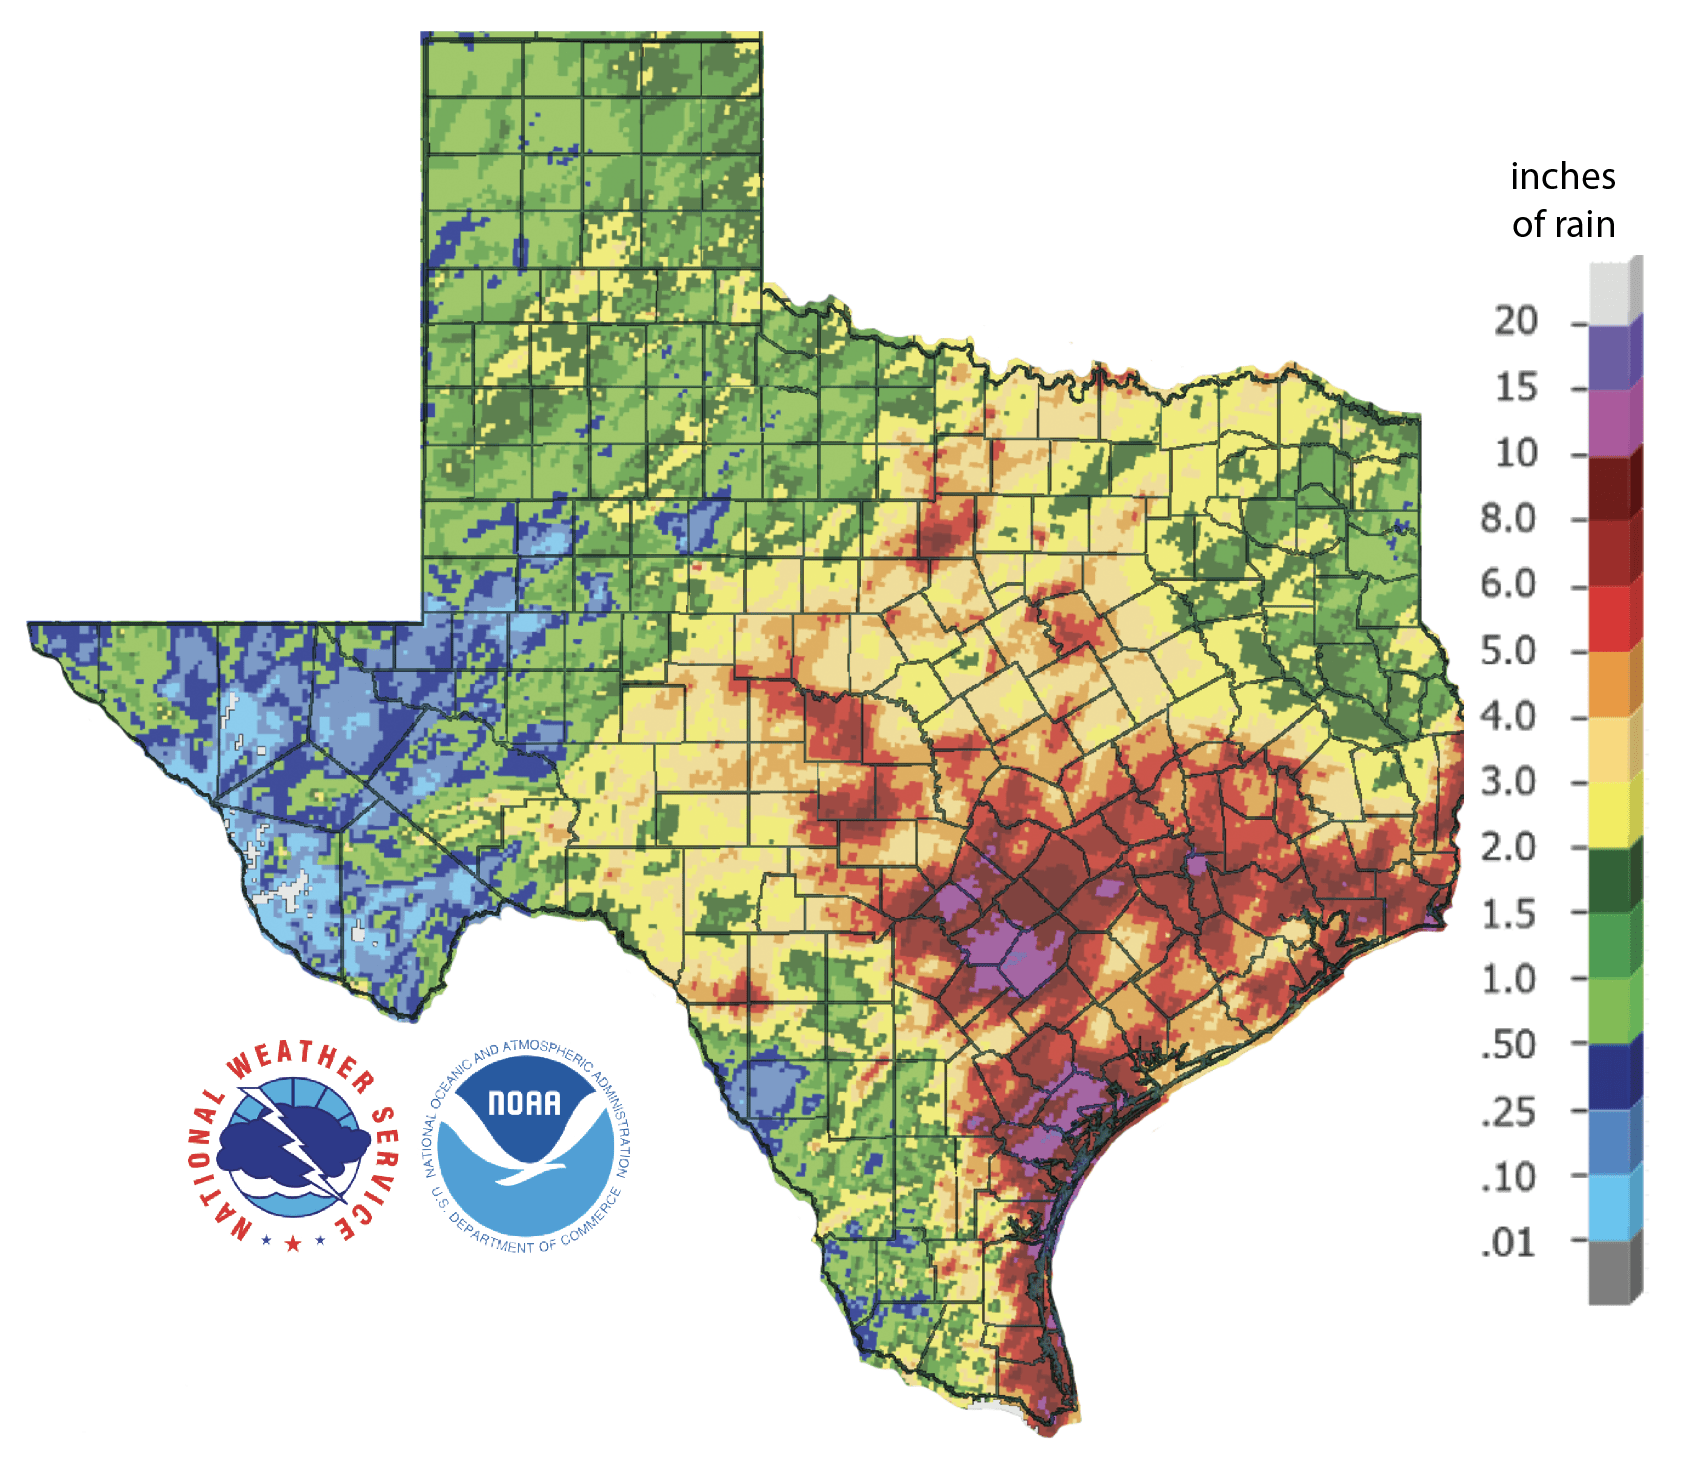
Figure 2a: Inches of precipitation that fell in Texas in the 30 days before October 23, 2021 (source). Note that cooler colors indicate lower values and warmer indicate higher values.
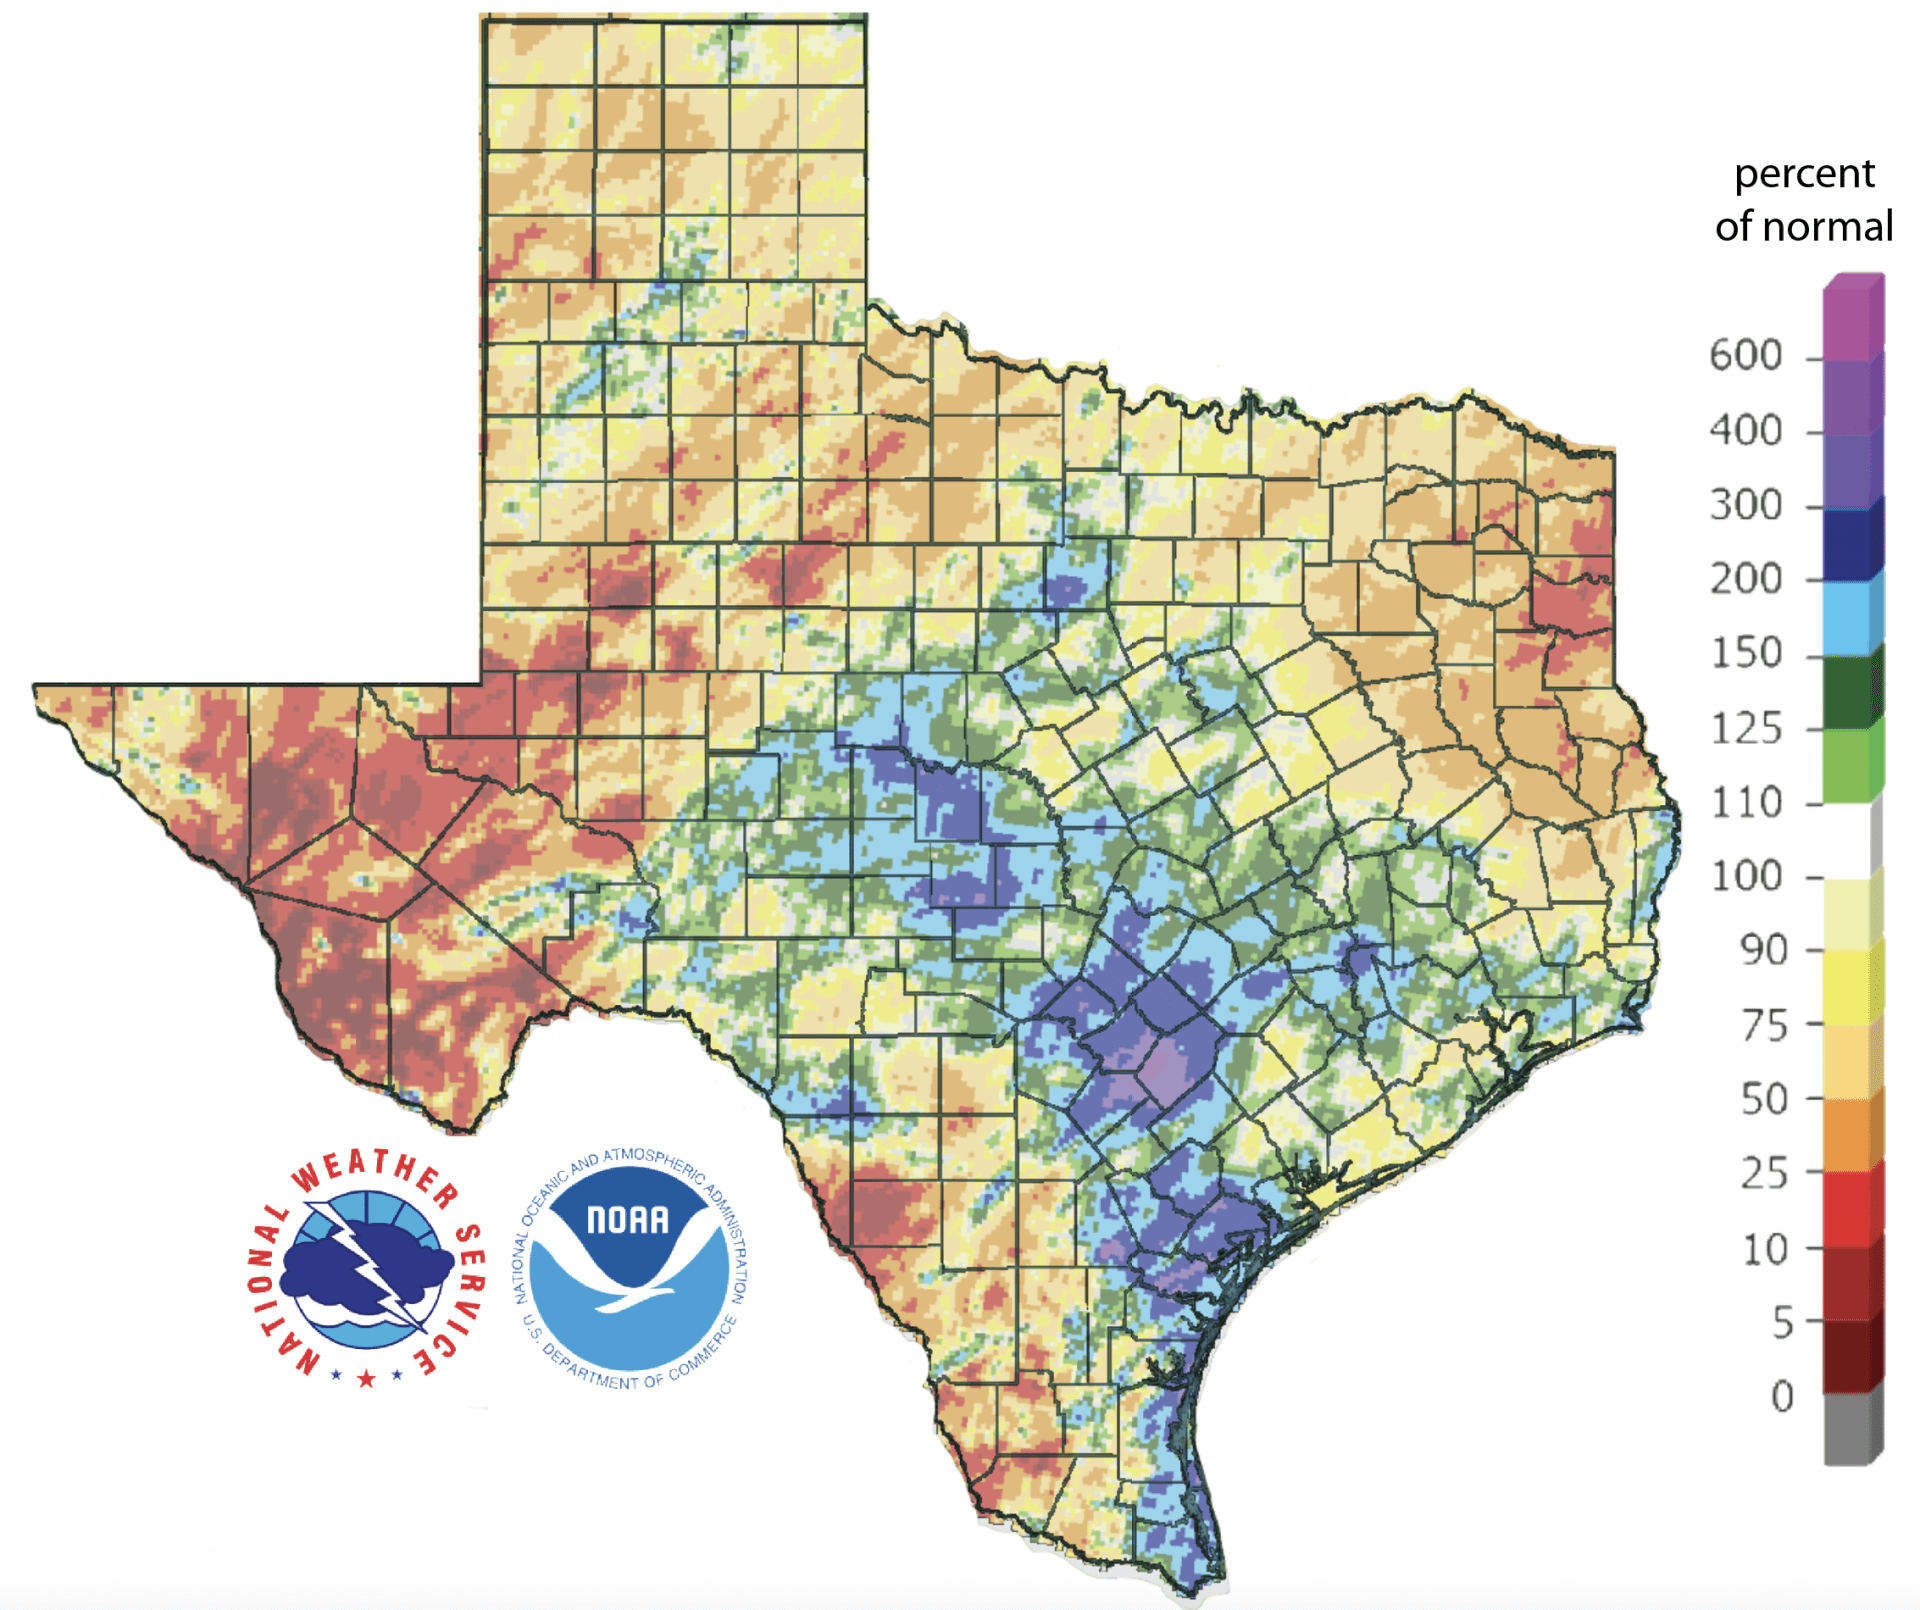
Figure 2b: Rainfall as a percent of normal for the 30 days before October 23, 2021 (source).
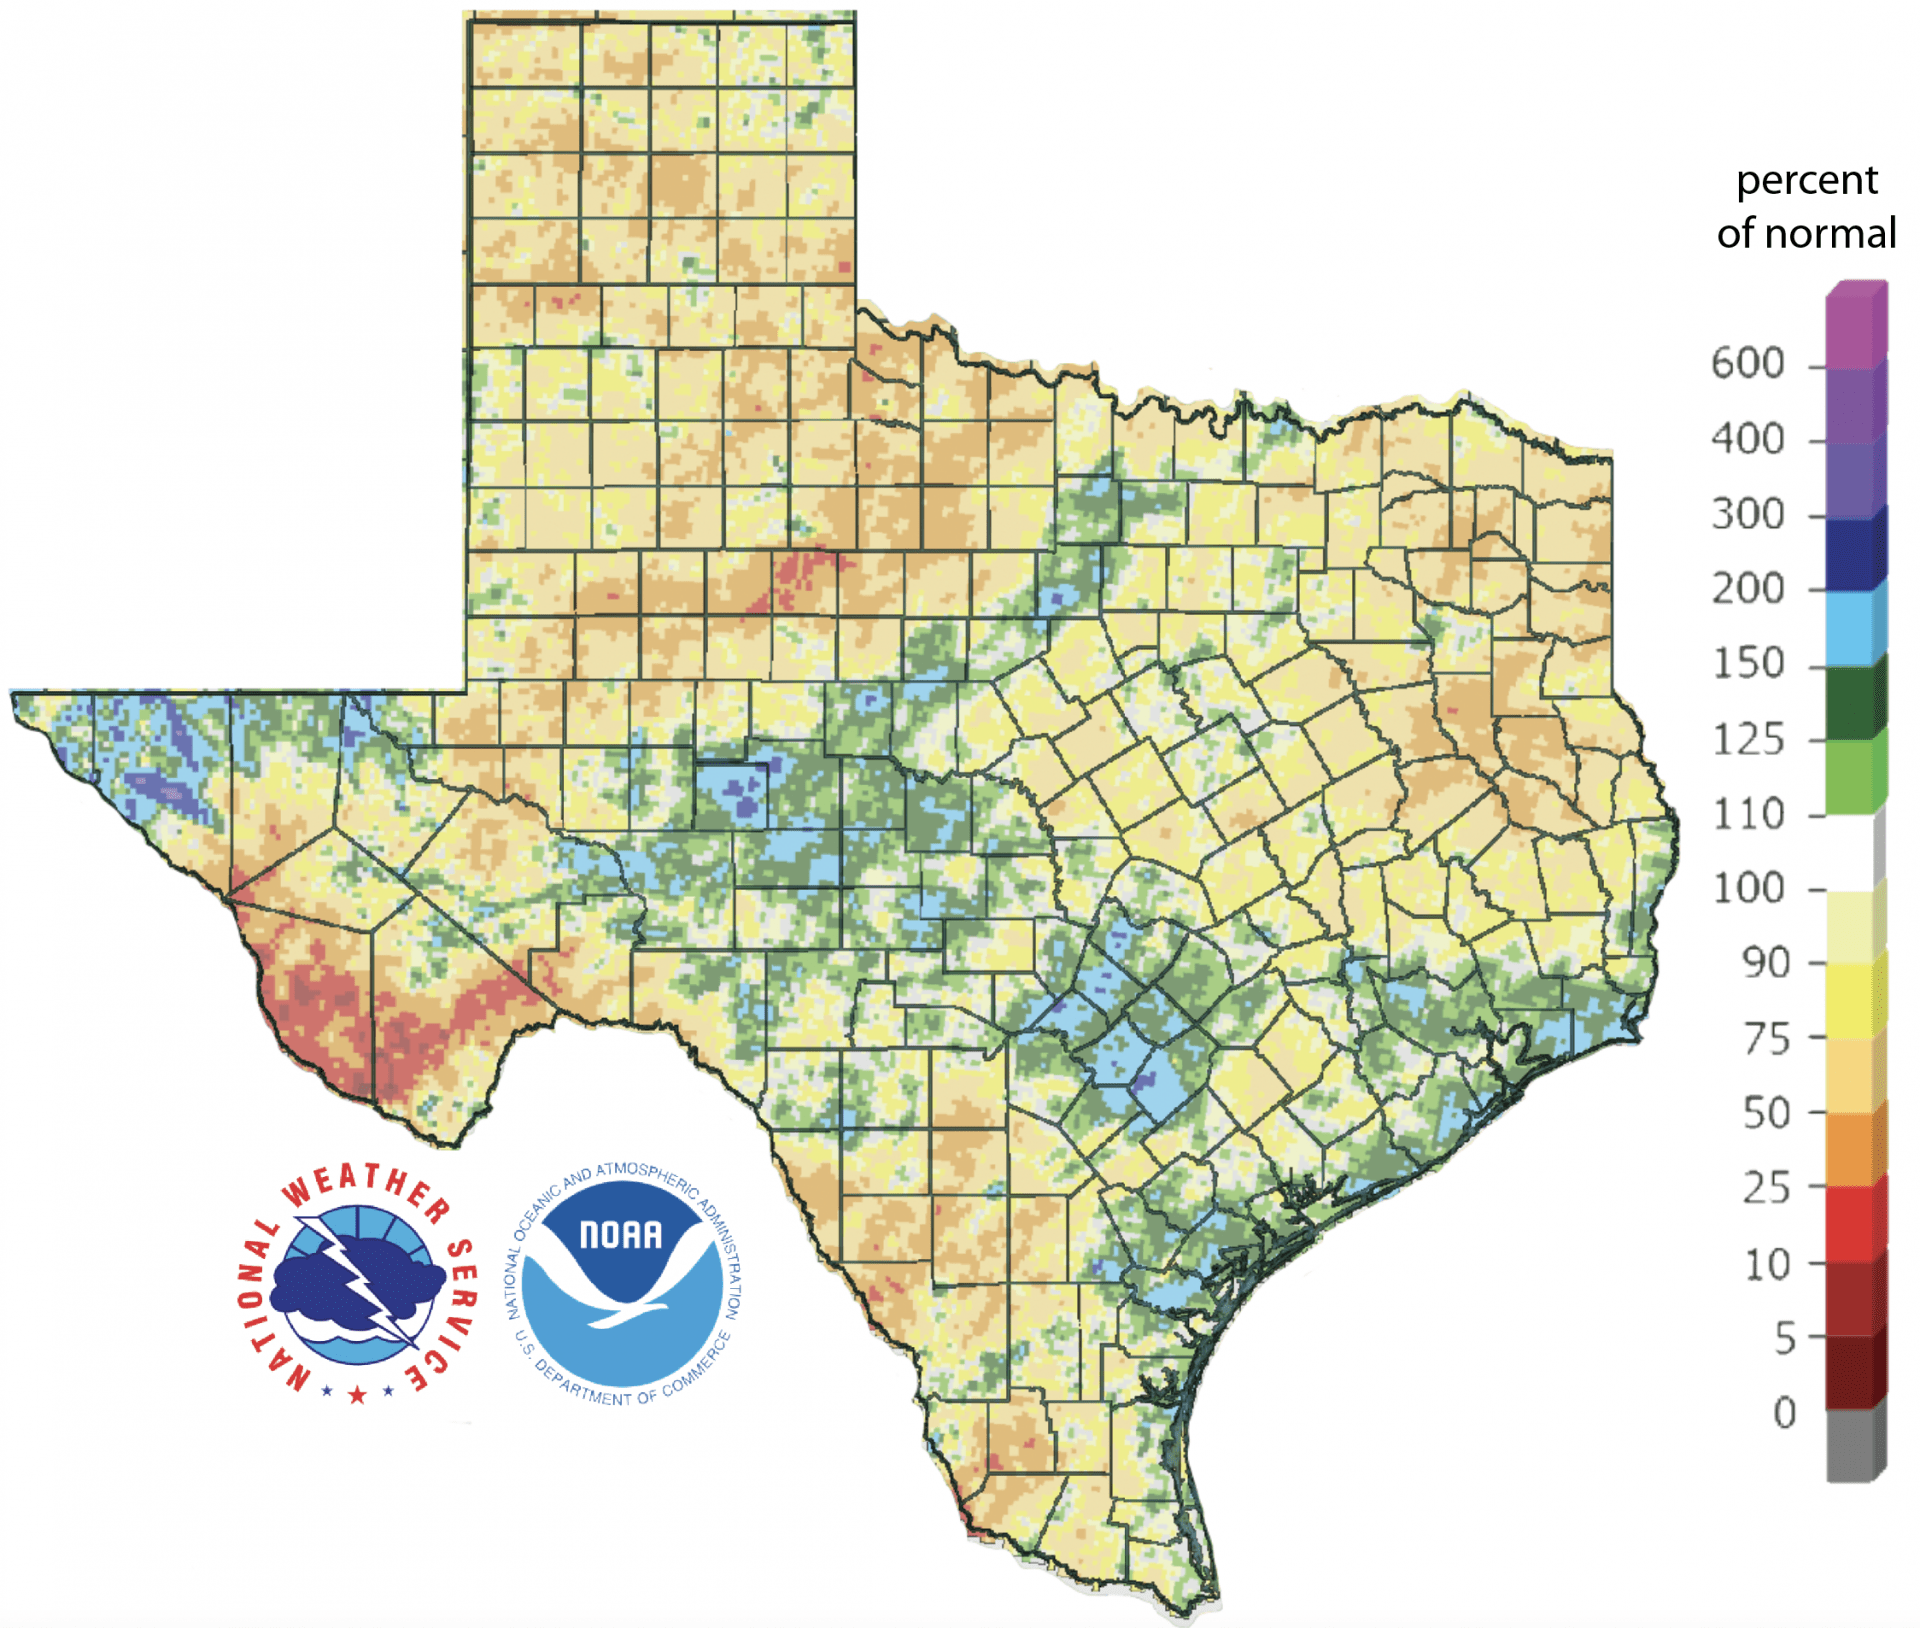
Figure 2c: Rainfall as a percent of normal for the 90 days before October 23, 2021 (source).
The amount of the state under drought conditions (D1–D4) increased from 5.1% four weeks ago to 19.1% today (Figure 3a), with drought developing or intensifying in parts of the High Plains, Big Bend Area, Northeast Texas, and parts of the Lower Rio Grande Valley (Figure 3b). Blotches of severe drought appear in West Texas and the Lower Rio Grande Valley (Figure 3a). In all, 46.6% of the state remains abnormally dry or worse (D0–D4; Figure 3a), up from 30.6% four weeks ago with abnormally dry conditions appearing in scattered areas across the state (Figure 3a).
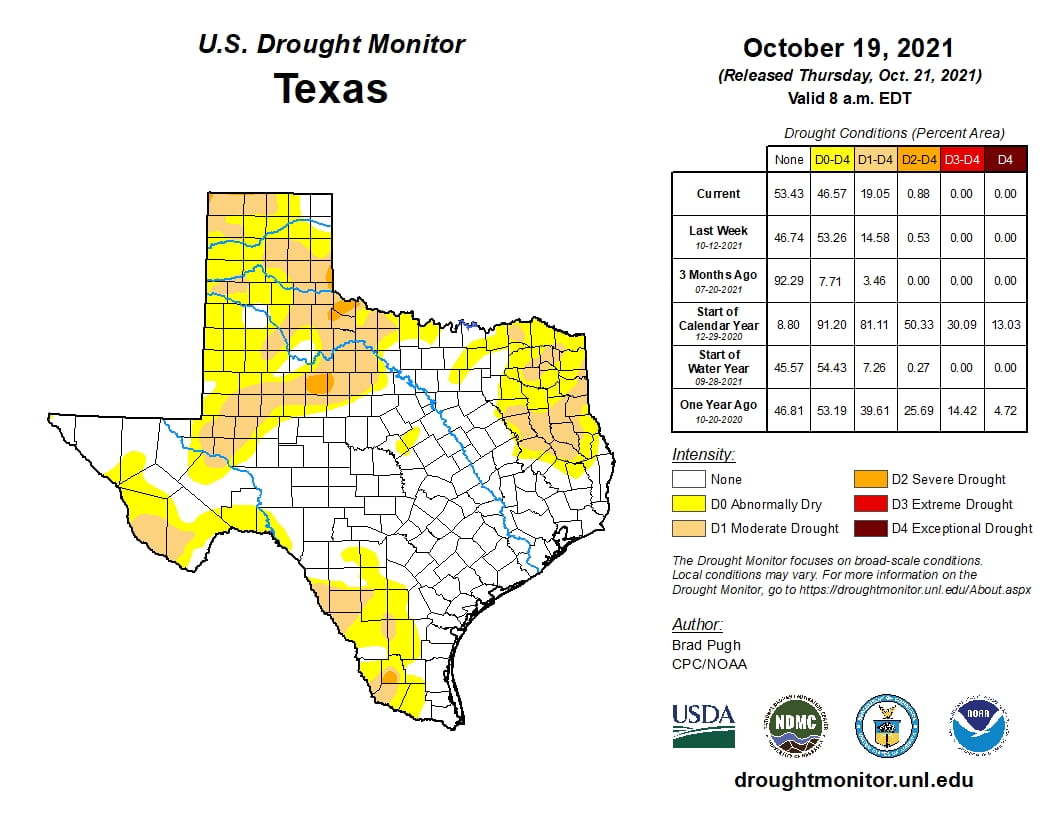
Figure 3a: Drought conditions in Texas according to the U.S. Drought Monitor (as of October 19, 2021; source).
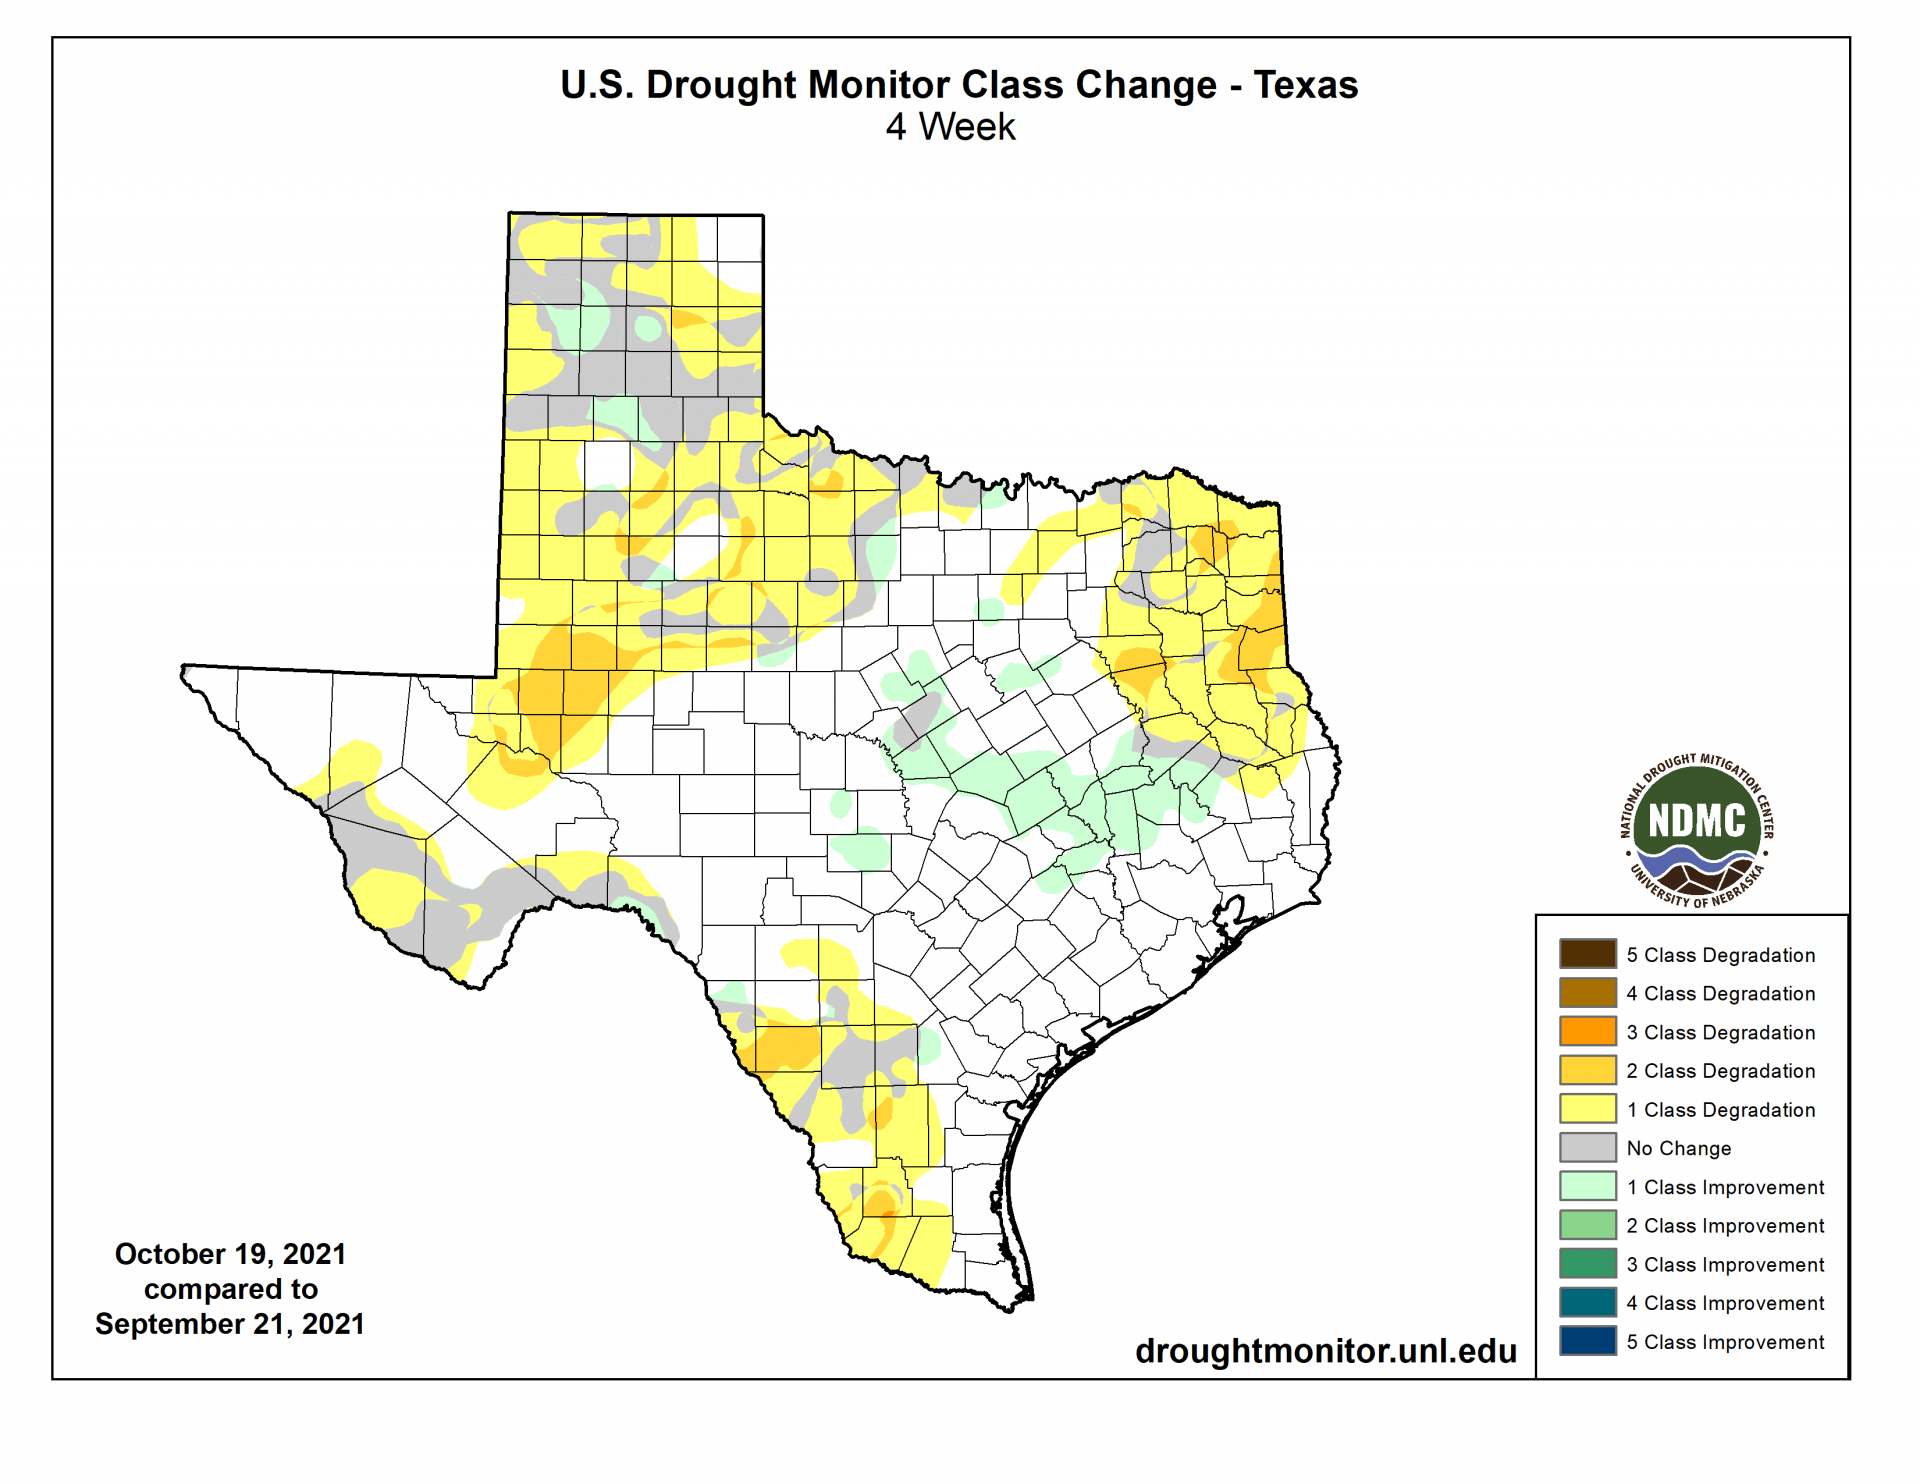
Figure 3b: Changes in the U.S. Drought Monitor for Texas between September 21, 2021, and October 19, 2021 (source).
The North American Drought Monitor, which runs a month behind, continues to show a raging drought in much of the western United States with drought entrenched in the American Southwest (Figure 4a). Precipitation in much of the Rio Grande watershed in southern New Mexico over the last 90 days was less than normal (Figure 4b). Conservation storage in Elephant Butte Reservoir increased slightly from 5.6% full last month to 5.8% (Figure 4c), just above historic (since 1990) lows.
The Rio Conchos Basin in Mexico, which confluences into the Rio Grande just above Presidio and is an important source of water to the lower part of the Rio Grande in Texas, remains out of drought conditions (Figure 4a). Combined conservation storage in Amistad and Falcon reservoirs decreased from 37.8% last month to 37.1% full today, about 18 percentage points below normal for this time of year (Figure 4d).
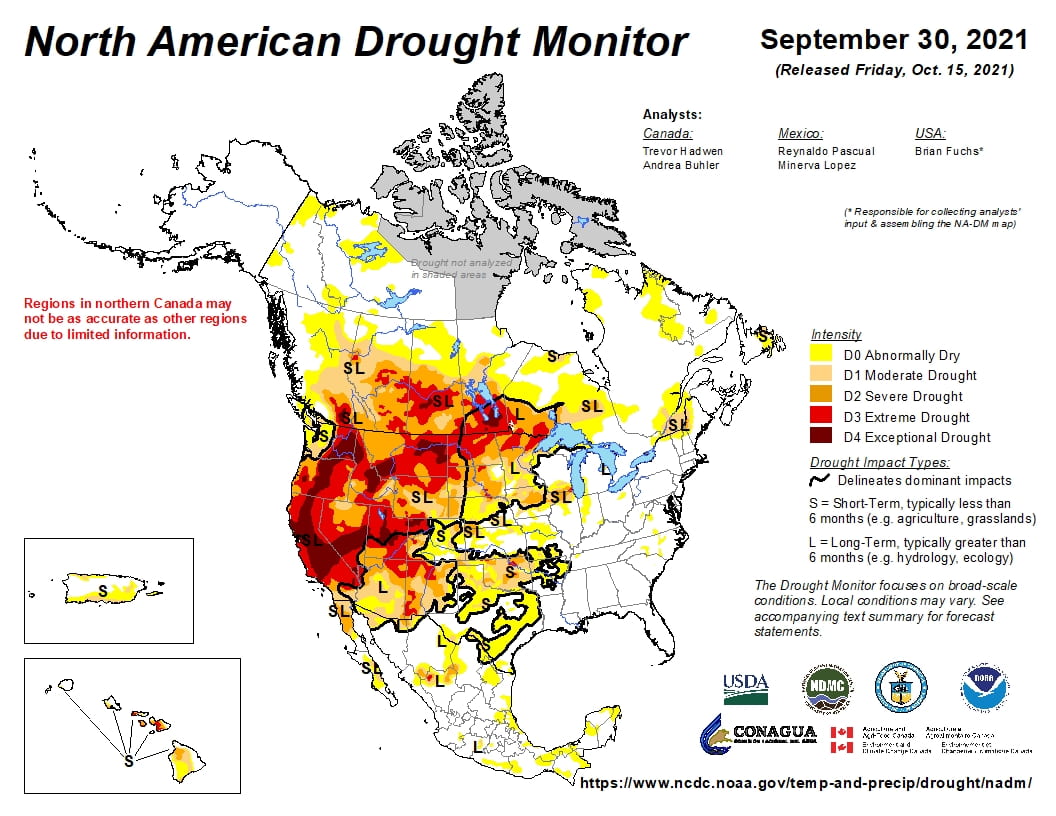
Figure 4a: The North American Drought Monitor for September 30, 2021 (source).
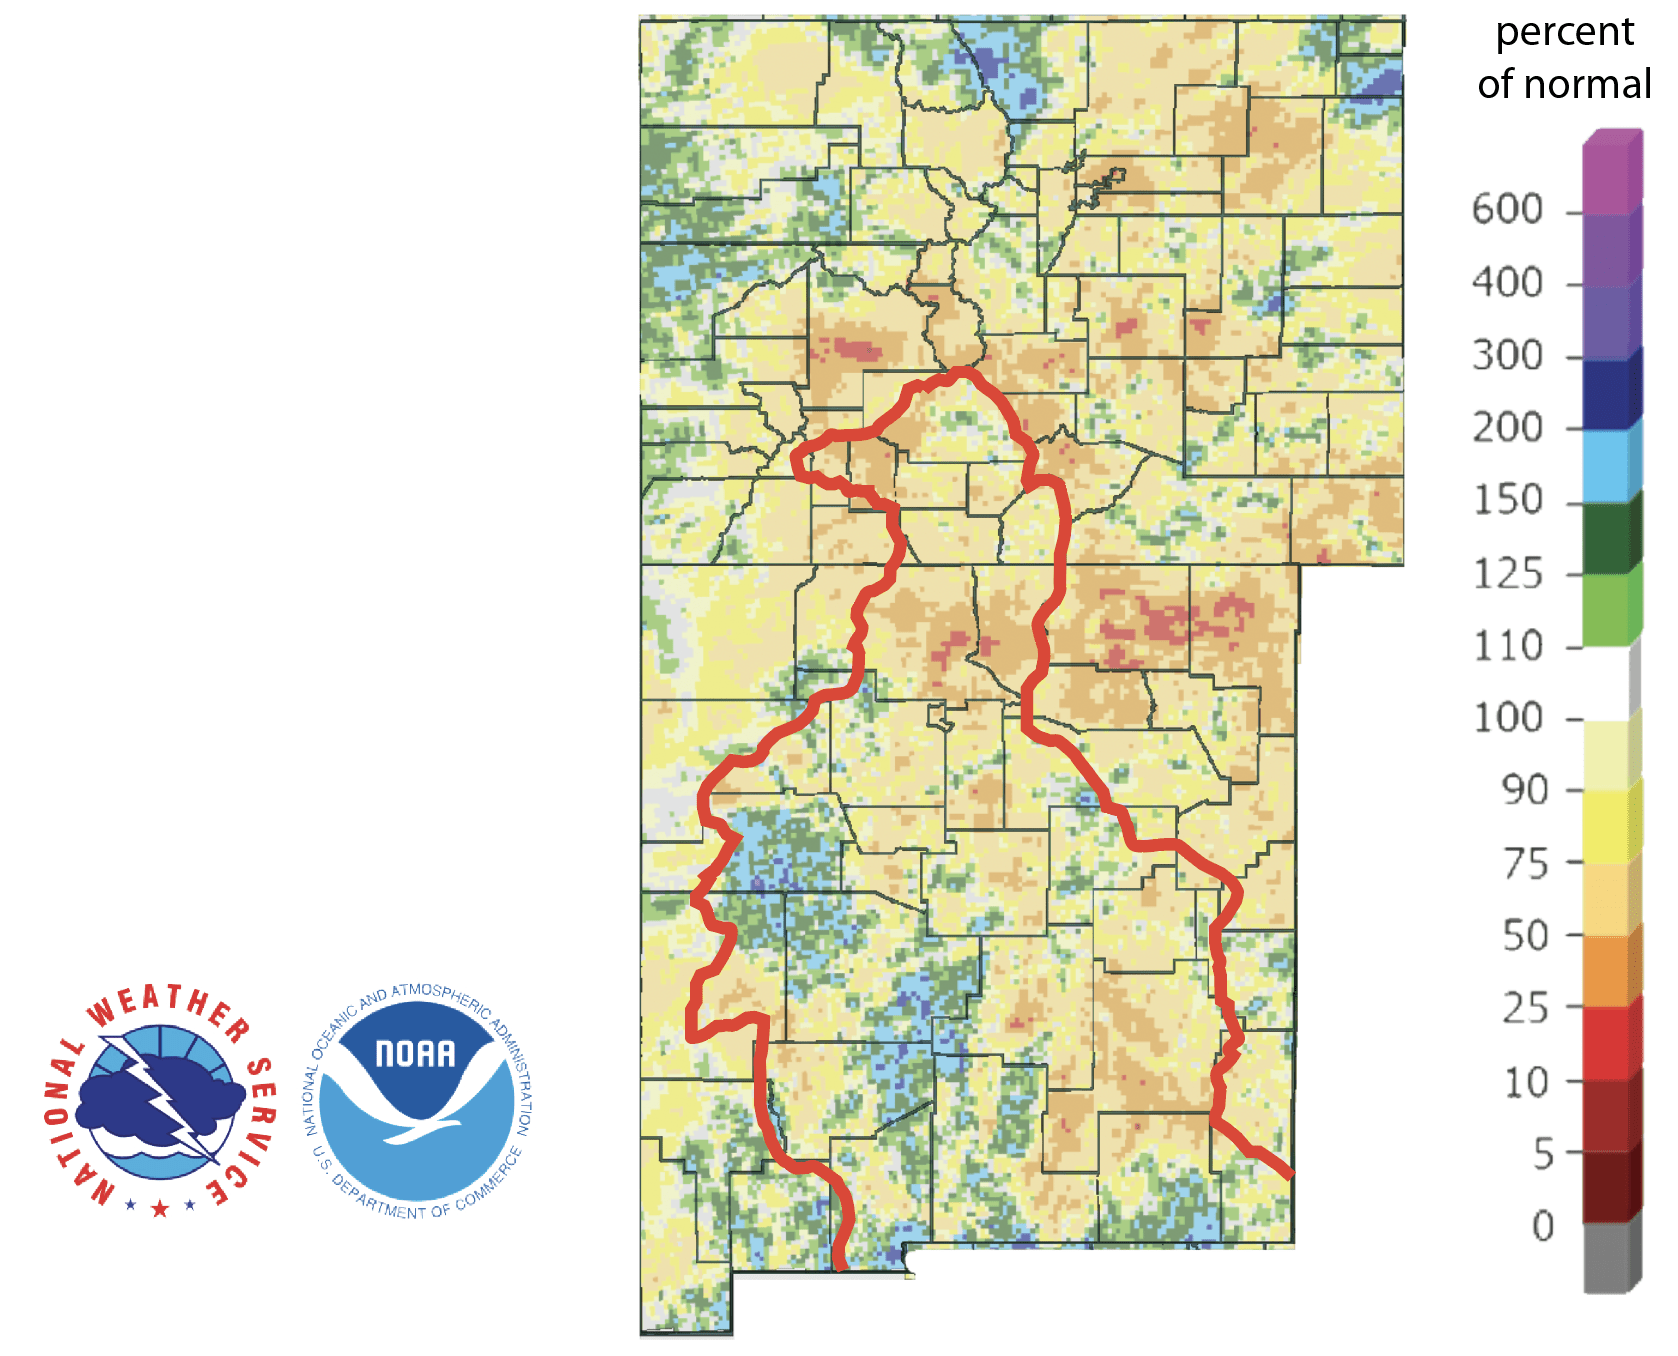
Figure 4b: Percent of normal precipitation for Colorado and New Mexico for the 90 days before October 23, 2021 (source). The red line is the Rio Grande Basin. I use this map to see check precipitation trends in the headwaters of the Rio Grande in southern Colorado, the main source of water to Elephant Butte Reservoir downstream.
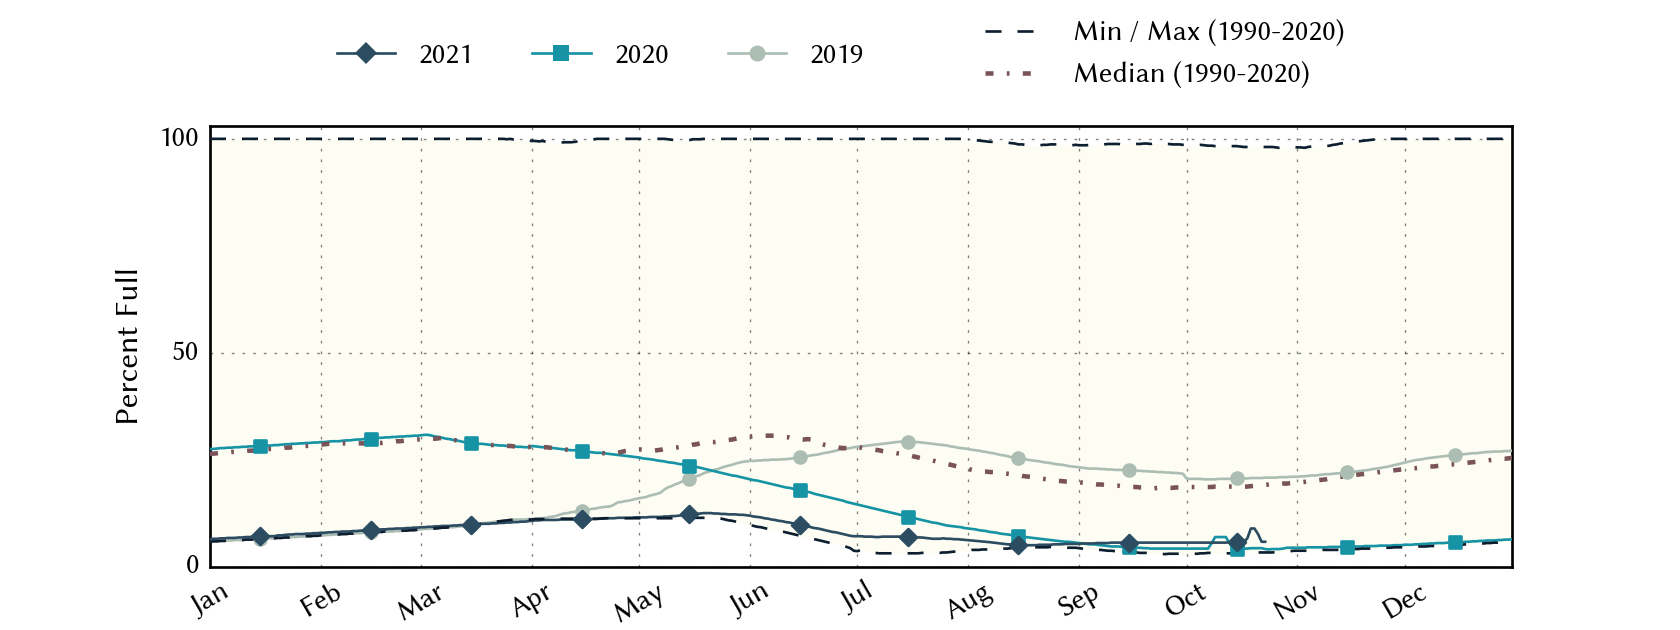
Figure 4c: Reservoir storage in Elephant Butte Reservoir since 2019 with the median, min, and max for measurements from 1990 through 2020 (source).
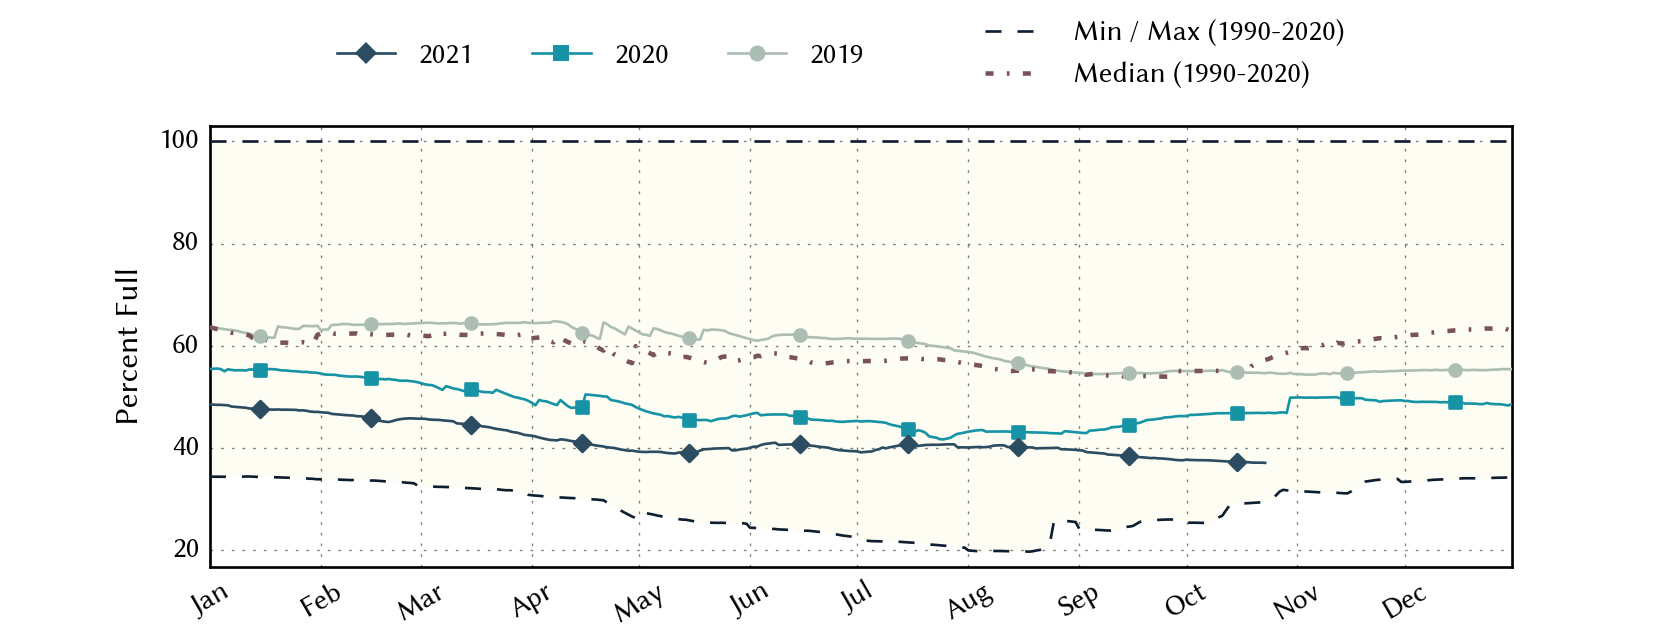
Figure 4d: Reservoir storage in Amistad and Falcon reservoirs since 2019 with the median, min, and max for measurements from 1990 through 2020 (source).
A number of basins continue to have flows below historical 25th, 10th, and 5th flow percentiles (Figure 5a). Statewide reservoir storage is at 80.5% full as of today, down from 81.4% a month ago and about normal for this time of year (Figure 5b). Most reservoirs in the eastern part of the state are above 90% full, although several have sunk below 90% and 80% full (Figure 5c).
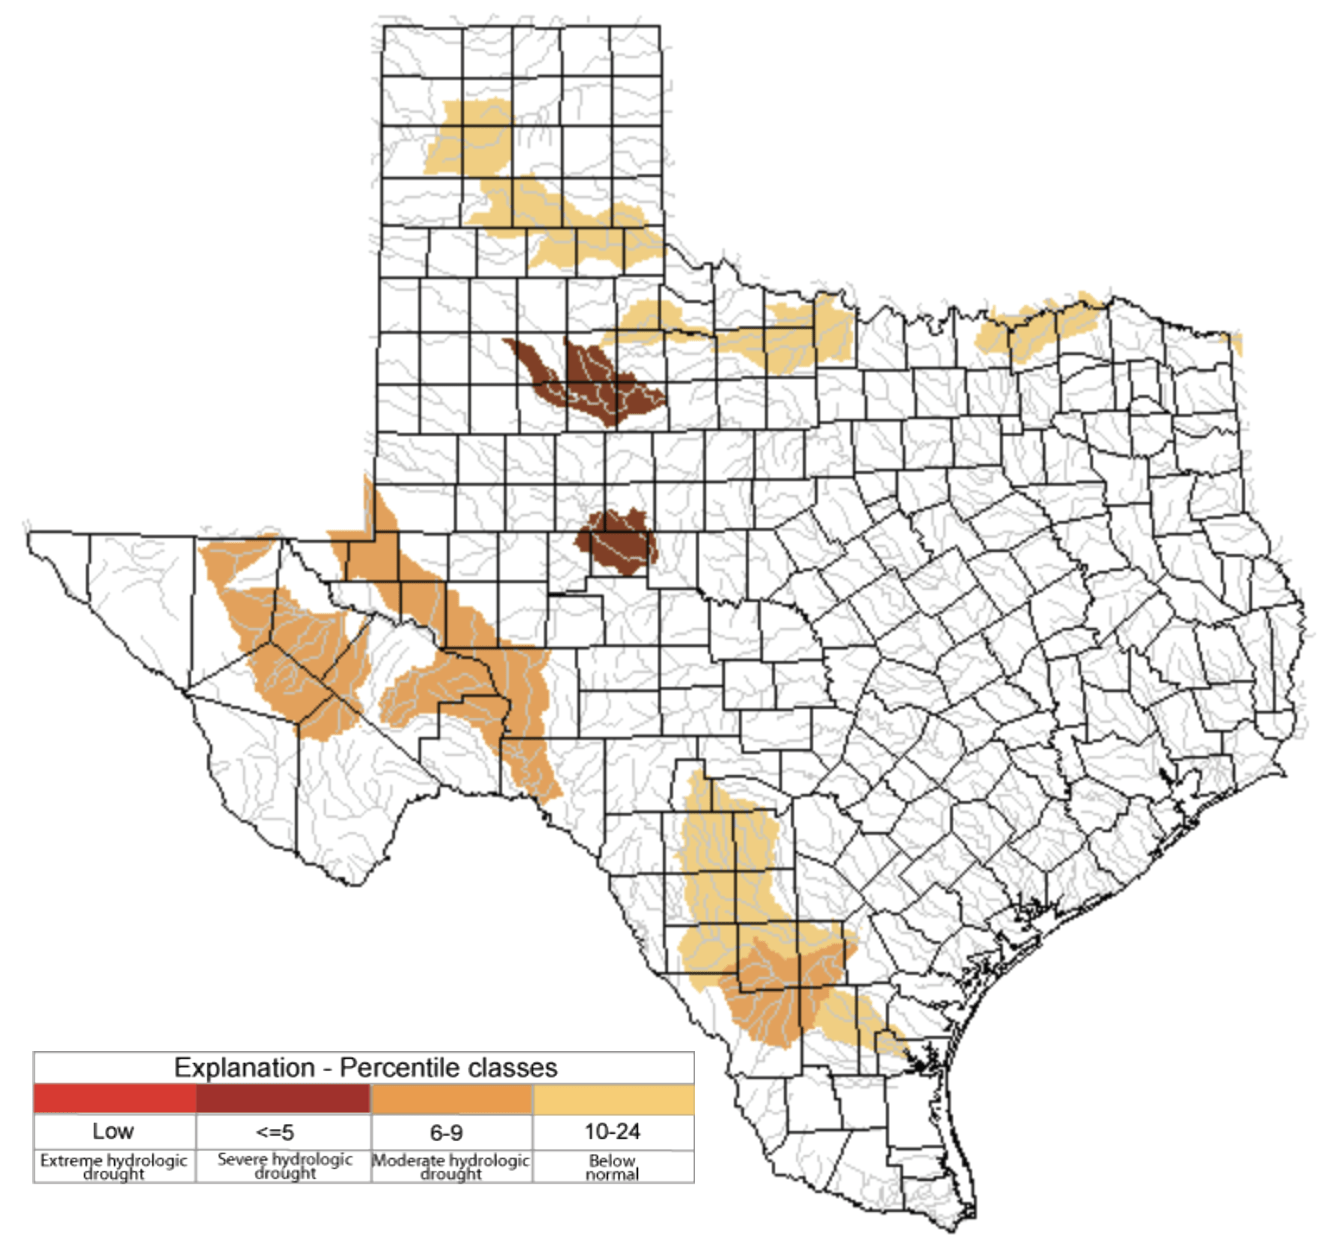
Figure 5a: Parts of the state with below-25th-percentile seven-day average streamflow as of October 23, 2021 (source).
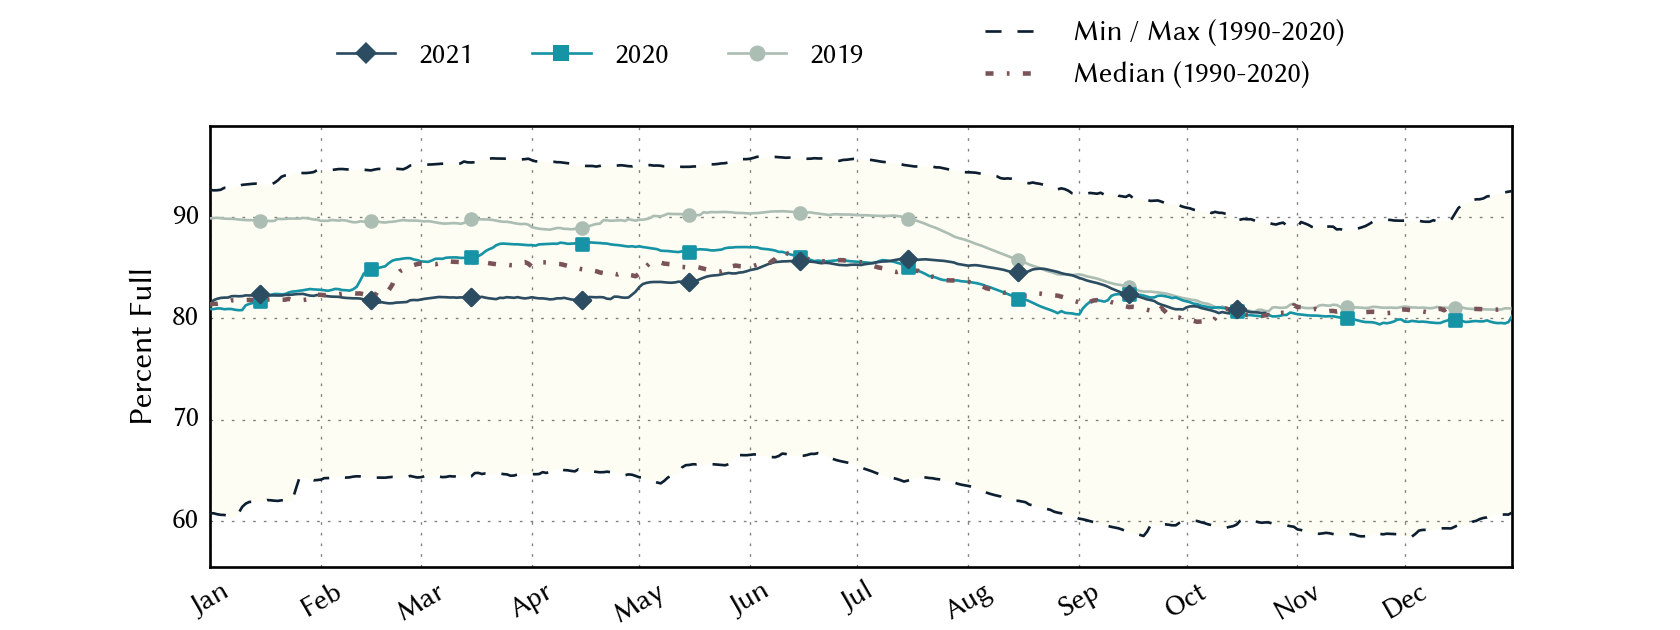
Figure 5b: Statewide reservoir storage since 2019 compared to statistics (median, min, and max) for statewide storage from 1990 through 2020 (source).
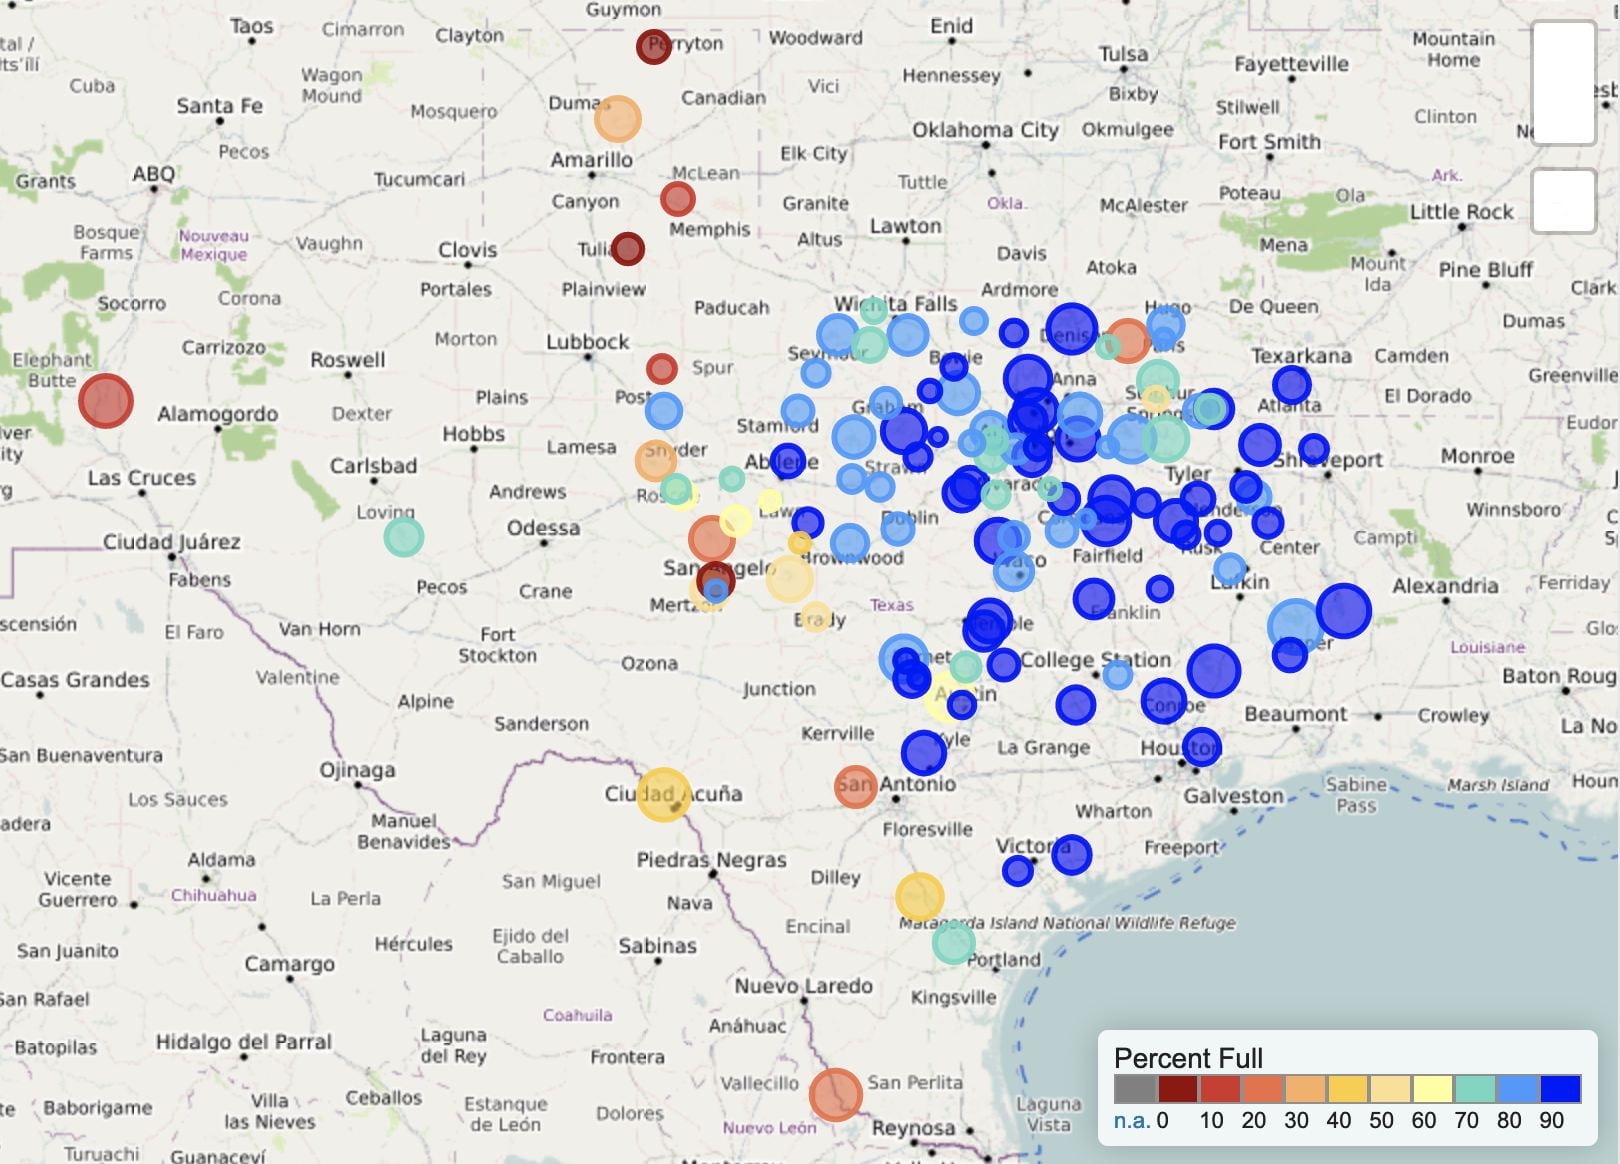
Figure 5c: Reservoir storage as October 23, 2021 in the major reservoirs of the state (source).
Sea-surface temperatures in the Central Pacific that, in part, define the status of the El Niño Southern Oscillation, have cooled, and we are now officially in La Niña conditions (Figure 6a). Projections of sea-surface temperatures have an 87% chance of remaining in La Niña conditions through February (Figure 6b). Projections suggest a return to neutral conditions in the spring of next year.
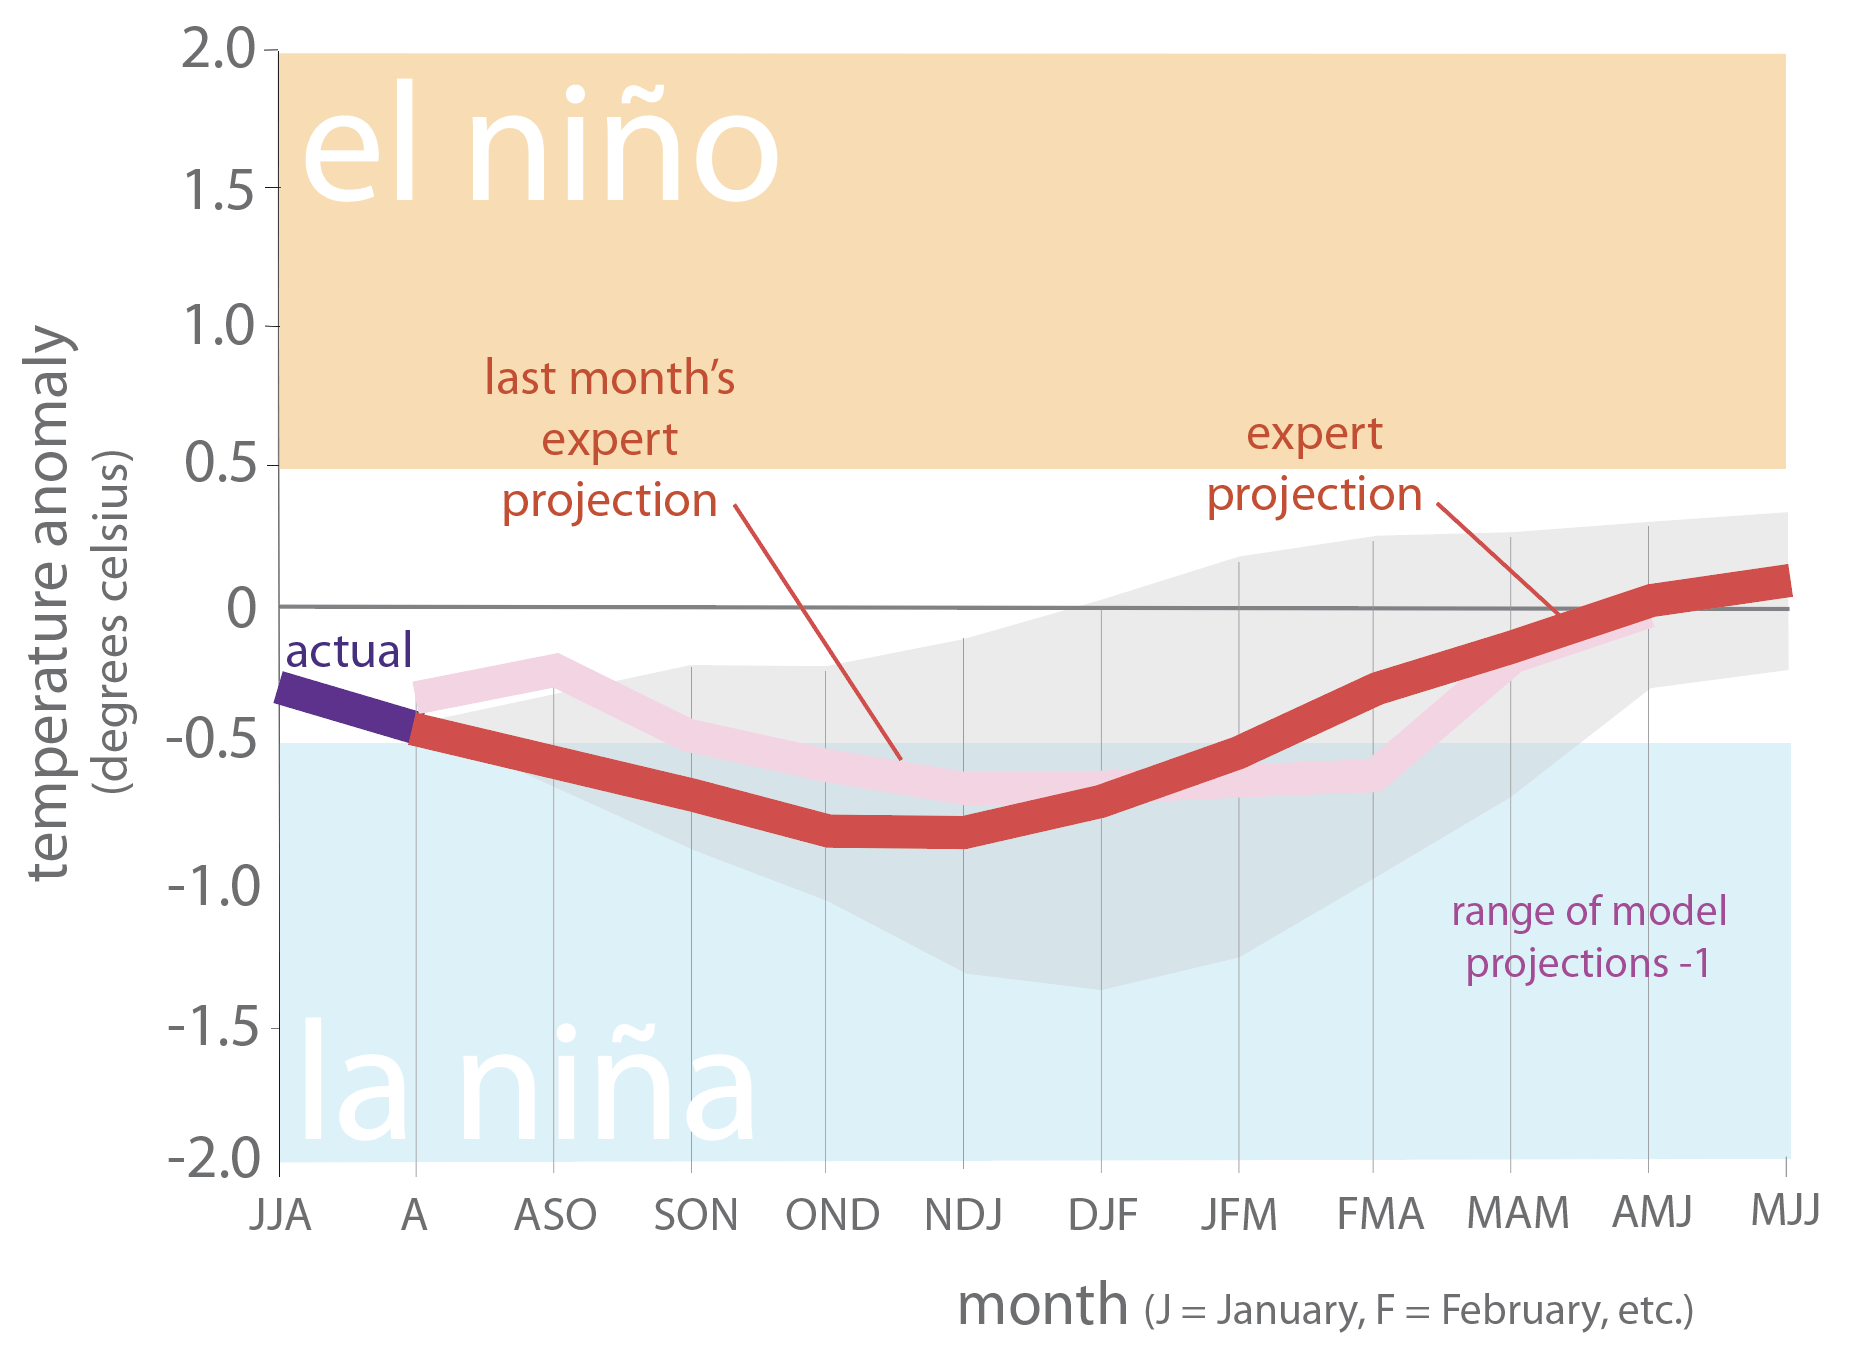
Figure 6a. Forecasts of sea-surface temperature anomalies for the Niño 3.4 Region as of September 20, 2021 (modified from source). “Range of model predictions -1” is the range of the various statistical and dynamical models’ projections minus the most outlying upper and lower projections.
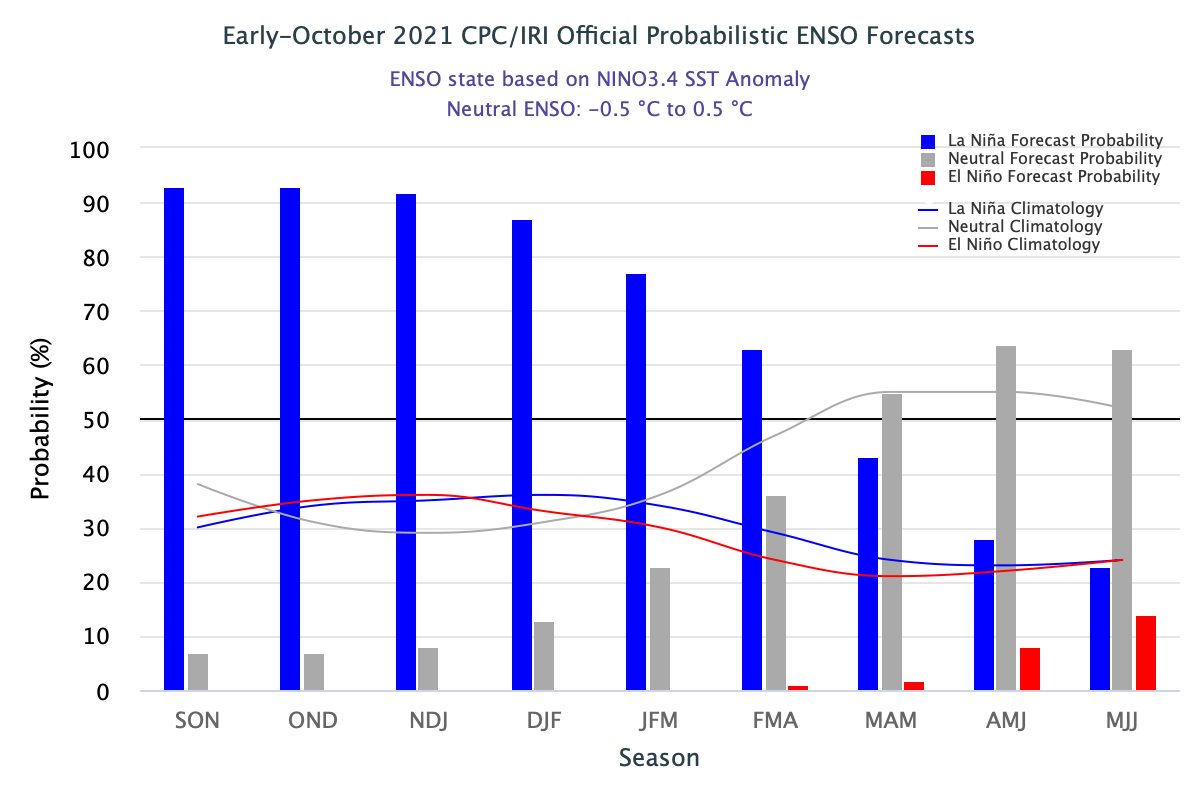
Figure 6b. Probabilistic forecasts of El Niño, La Niña, and La Nada (neutral) conditions (source).
The U.S. Seasonal Drought Outlook through January 31, 2021, continues to project drought development over most of the state (Figure 7a). The three-month temperature outlook projects warmer-than-normal conditions for the entire state (Figure 7b) while the three-month precipitation favors drier-than-normal conditions for the entire state as well (Figure 7c).
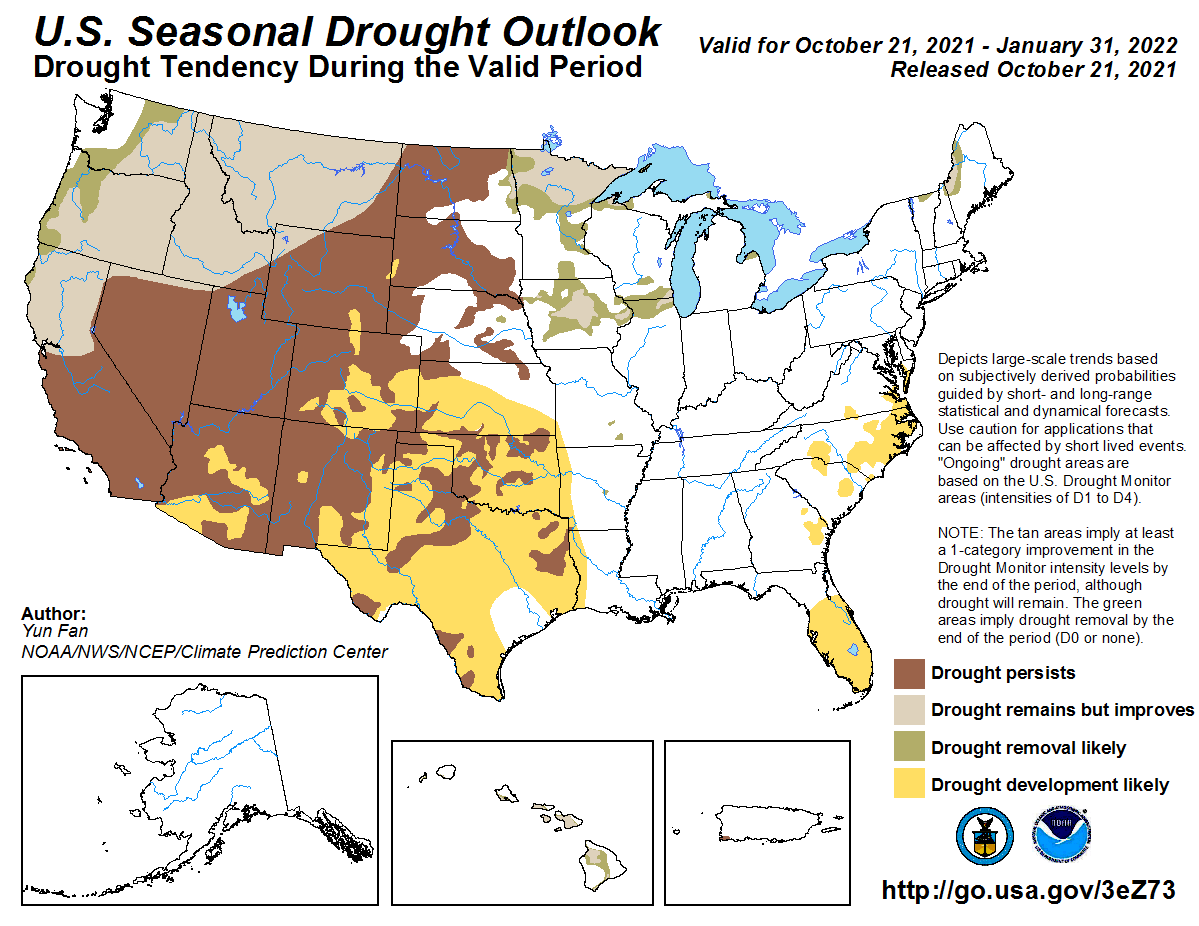
Figure 7a: The U.S. Seasonal Drought Outlook for October 21, 2021, through January 31, 2021 (source).
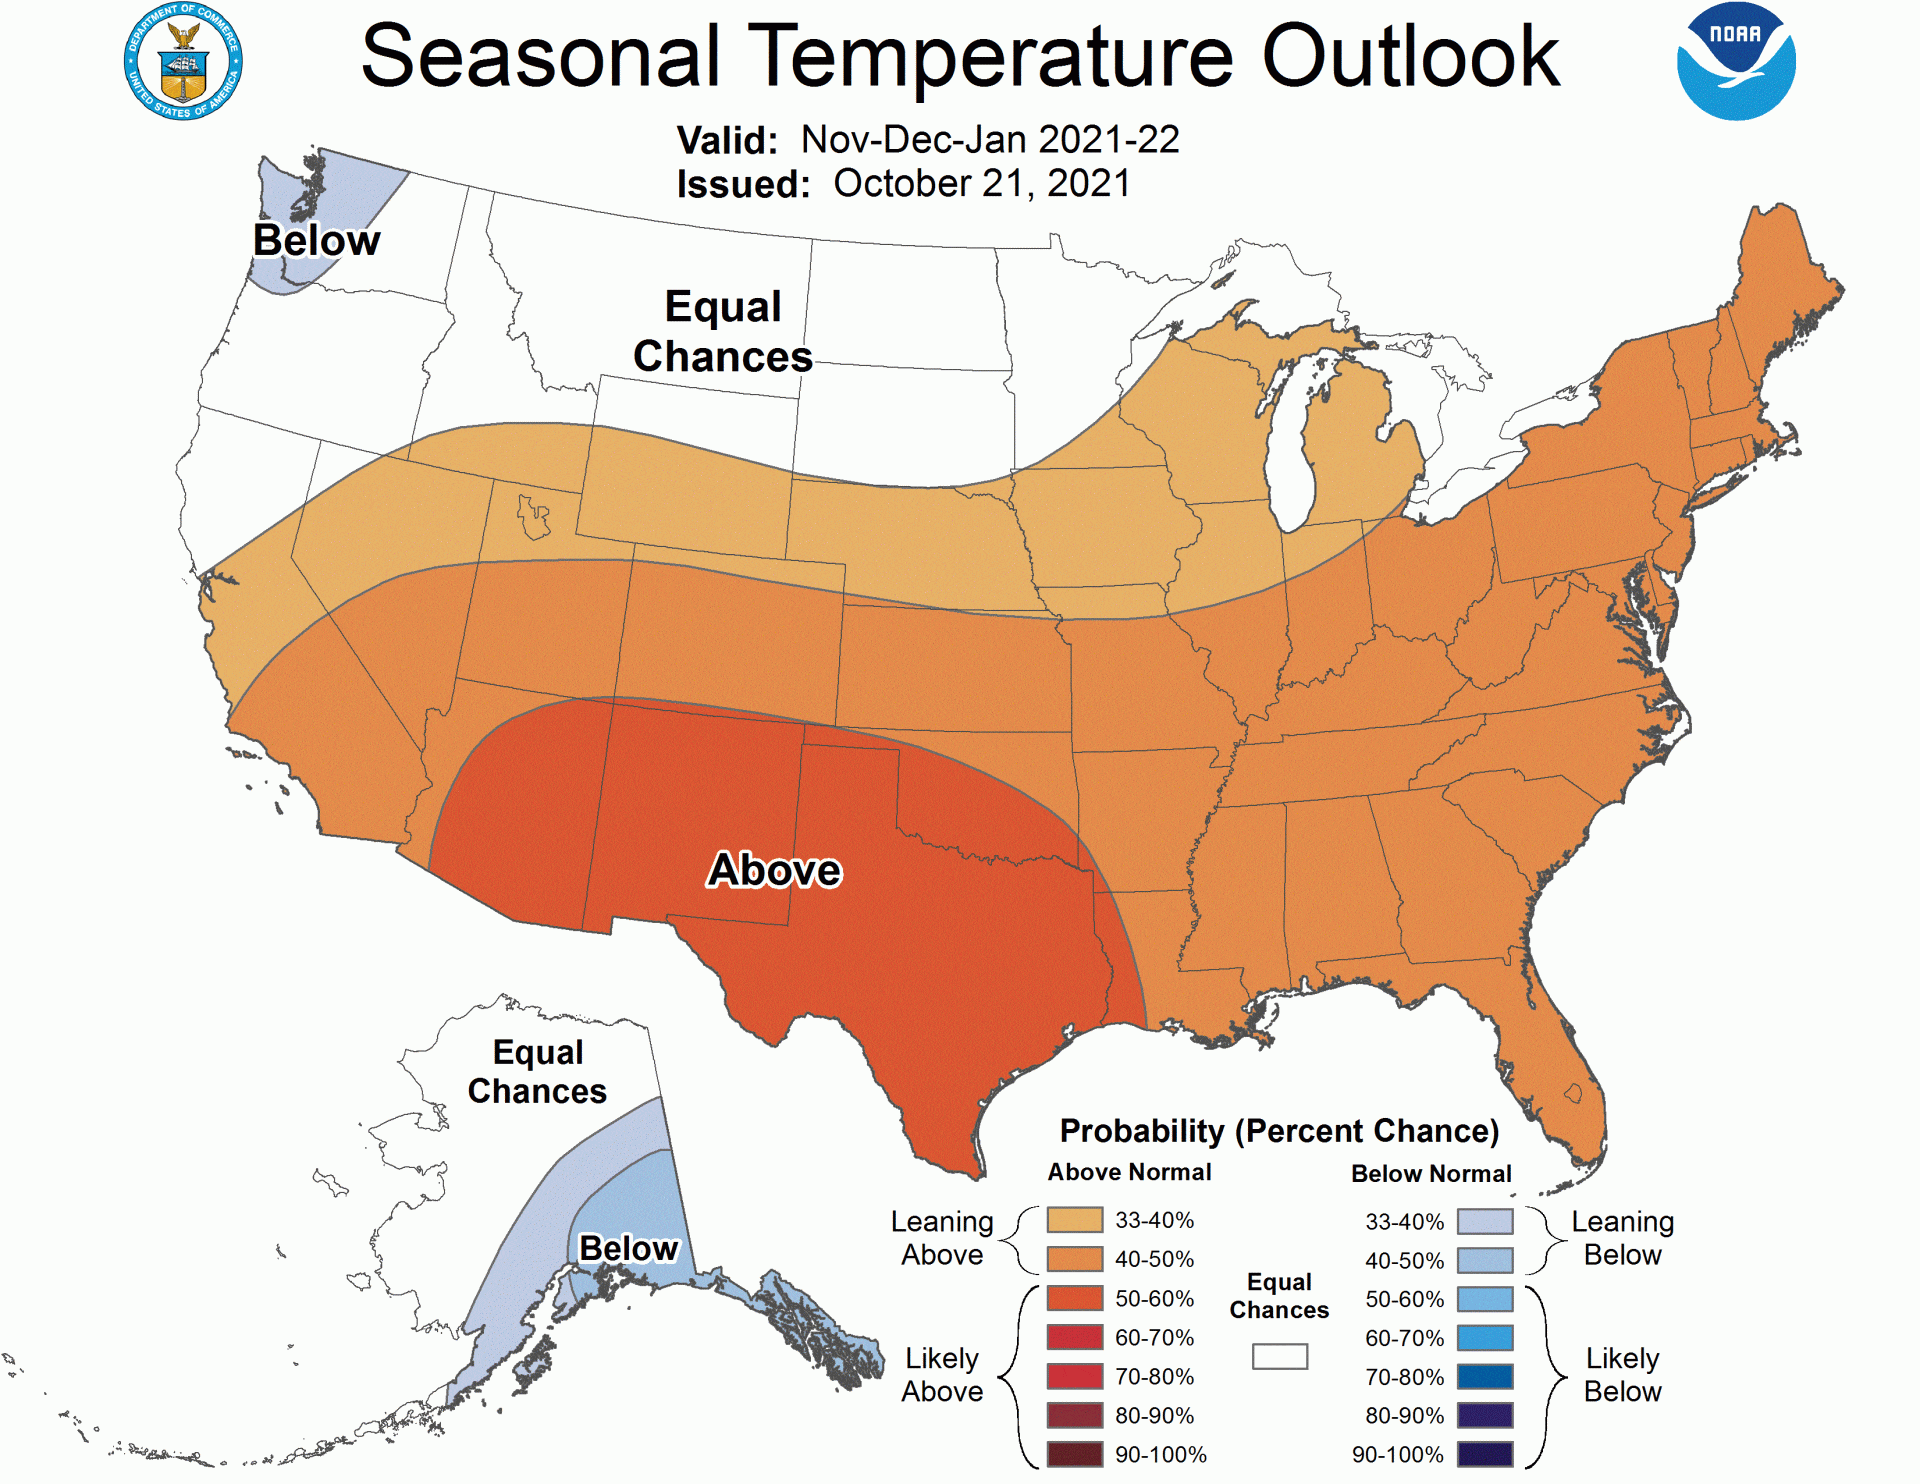
Figure 7b: Three-month temperature outlook from October 21, 2021 (source).
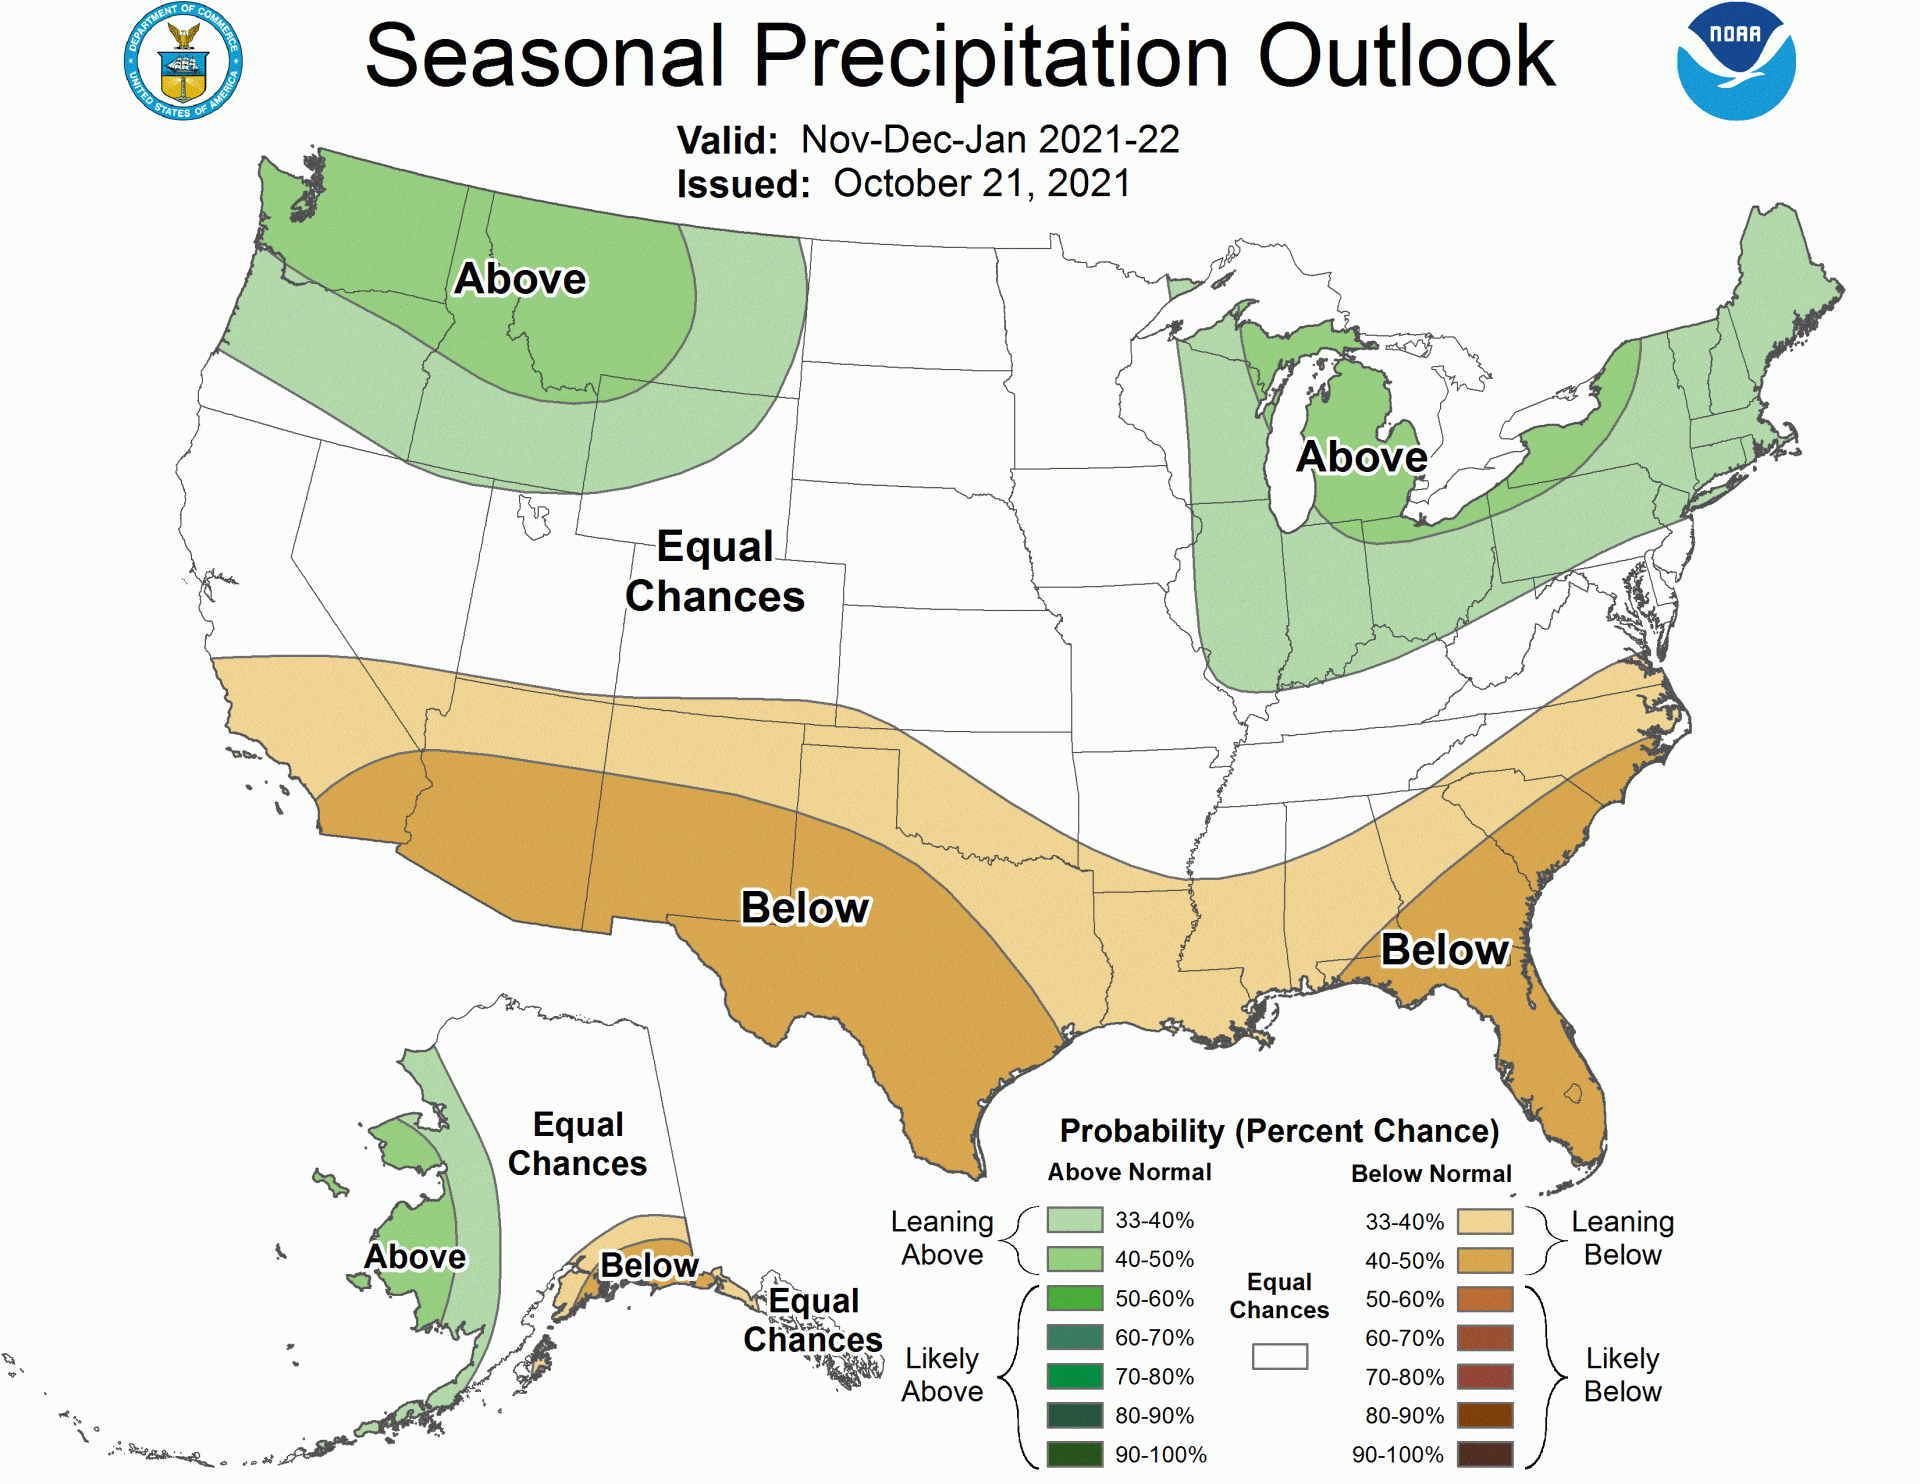
Figure 7c: Three-month precipitation outlook from October 21, 2021 (source).

