SUMMARY:
- Much of the High Plains and Far West Texas did not see a single. drop. of rain.
- Drought intensified across the state, expanding from about 19% four weeks ago to 36% today
- Most of the state is expected to be in drought over the next three months
I wrote this article on November 19, 2021.
As we head into the cooler weather of winter — at least for what passes as winter ‘round these parts — bad memories of Winter Storm Uri lead to questions of: Will we have another Uri? And if we do, will the electric grid be ready?
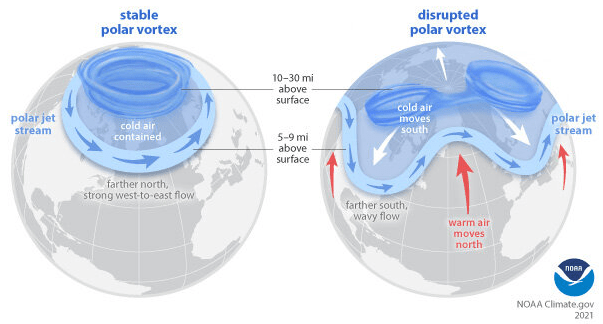
On the Uri question, the answer is: Who knows? It is thought that a sudden stratospheric warming event in the polar vortex that occurred in early January of this year ultimately led to bitterly cold air rushing down the Great Plains and deep into Texas. But it’s difficult to know when one might happen and similarly affect our weather. Ironically, climate change may be making cold snaps like this more likely with time as winters, overall, get warmer and warmer. But the link between global warming, the polar vortex, and its connection to weather still needs study. Already, there has been an unusually early stratospheric warming event this season, but it’s unclear what that means for the polar vortex and weather.
Will the grid be ready? The governor tapped Peter Lake, the aptly named chairman of the Texas Water Development Board, to chair the Public Utility Commission of Texas (he needs to rename himself Peter Volt). In an interview with KXAN on how the state has responded, Lake described winterization requirements, power reserves, generator inspections, and changes at the Electric Reliability Council of Texas (ERCOT). As someone who led an agency that plans for the infrequent drought-of-record, here’s hoping that Lake can get the Public Utility Commission, ERCOT, and energy providers to prepare (and stay prepared) for the Uris of the future.
The Public Utility Commission is involved with power generation, not natural gas production and distribution, which is in the wheelhouse of the Texas Railroad Commission. There’s been recent controversy over a proposed weatherization rule by the Commission that would allow a gas provider to pay $150 to avoid weatherization requirements, something the ERCOT CEO has expressed concerns about with respect to the resiliency of the grid. A recent Federal Energy Regulatory Commission report concluded that 87% of unplanned outages were due to natural gas production and processing issues. A study commissioned by the Texas Oil and Gas Association concluded that power outages along the natural gas supply chain caused issues with the gas supply.
With Texans having to pay for Uri over the next several decades with electricity and gas surcharges (as this editorial notes, Texas is “a state where you can freeze in your own home and pay for the privilege of doing so.”), here’s hoping that the Public Utility Commission and the Texas Railroad Commission get it right before the next storm gallops down the plains.

Figure 1: Understanding the polar vortex (source).
The eastern third of the state and parts of the Lower Rio Grande Valley received at least 2 (and as much as 6) inches of rain while the western third received zip-zilch-zero-zed rainfall over the past four weeks (Figure 2a). Except for the Lower Rio Grande Valley, the state received less than normal rainfall over the past four weeks with the High Plains and Far West Texas suffering from less than 10% of normal rainfall (Figure 2b). Rain over the past 90 days — a big driver for drought conditions — is below normal for almost the entire state (Figure 2c).

Figure 2a: Inches of precipitation that fell in Texas in the 30 days before November 19, 2021 (source). Note that cooler colors indicate lower values and warmer indicate higher values.

Figure 2b: Rainfall as a percent of normal for the 30 days before November 19, 2021 (source).

Figure 2c: Rainfall as a percent of normal for the 90 days before November 19, 2021 (source).
The amount of the state under drought conditions (D1–D4) increased from 19.1% four weeks ago to 35.9% today (Figure 3a) with drought developing or intensifying in the High Plains, Far West Texas, Northeast Texas, and part of South-Central Texas (Figure 3b). Only the Lower Rio Grande Valley showed improvement in drought conditions. Blotches of severe drought appear in the High Plains, the Big Bend Area, South-Central Texas, and North-East Texas (Figure 3a). In all, 63.9% of the state remains abnormally dry or worse (D0–D4; Figure 3a), up from 46.6% four weeks ago with abnormally dry conditions appearing in scattered areas across the state (Figure 3a).

Figure 3a: Drought conditions in Texas according to the U.S. Drought Monitor (as of November 19, 2021; source).

Figure 3b: Changes in the U.S. Drought Monitor for Texas between October 19, 2021, and November 16, 2021 (source).
The North American Drought Monitor, which runs a month behind, continues to show a raging drought in much of the western United States with drought entrenched in the American Southwest (Figure 4a). Precipitation in much of the Rio Grande watershed in Colorado and New Mexico over the last 90 days was less than normal (Figure 4b). Conservation storage in Elephant Butte Reservoir — an important source of water for the El Paso area — increased slightly from 5.8% full last month to 6.3% today (Figure 4c), just above historic (since 1990) lows.
The Rio Conchos Basin in Mexico, which confluences into the Rio Grande just above Presidio and is an important source of water to the lower part of the Rio Grande in Texas, remains out of drought but is now abnormally dry (Figure 4a). Combined conservation storage in the Amistad and Falcon reservoirs decreased from 37.1% last month to 36.8% full today, about 22 percentage points below normal for this time of year (Figure 4d).

Figure 4a: The North American Drought Monitor for October 31, 2021 (source).

Figure 4b: Percent of normal precipitation for Colorado and New Mexico for the 90 days before November 19, 2021 (source). The red line is the Rio Grande Basin. I use this map to see check precipitation trends in the headwaters of the Rio Grande in southern Colorado, the main source of water to Elephant Butte Reservoir downstream.

Figure 4c: Reservoir storage in Elephant Butte Reservoir since 2019 with the median, min, and max for measurements from 1990 through 2020 (source).

Figure 4d: Reservoir storage in Amistad and Falcon reservoirs since 2019 with the median, min, and max for measurements from 1990 through 2020 (source).
A number of basins continue to have flows below historical 25th, 10th, and 5th flow percentiles (Figure 5a). Statewide reservoir storage is at 79.6% full as of today, down from 80.5% a month ago, just below normal for this time of year (Figure 5b). More reservoirs in the eastern part of the state have fallen below 90% full (Figure 5c) with one, Lake Sulphur Springs, now at 61% full (Figure 5d).

Figure 5a: Parts of the state with below-25th-percentile seven-day average streamflow as of November 19, 2021 (source).

Figure 5b: Statewide reservoir storage since 2019 compared to statistics (median, min, and max) for statewide storage from 1990 through 2020 (source).

Figure 5c: Reservoir storage as of November 19, 2021 in the major reservoirs of the state (source).

Figure 5d: Reservoir storage since 2019 in Lake Sulphur Springs compared to statistics (median, min, and max) for statewide storage from 1990 through 2020 (source).
Sea-surface temperatures in the Central Pacific that in part define the status of the El Niño Southern Oscillation actually warmed a wee bit, but we remain in La Niña conditions (Figure 6a). Projections of sea-surface temperatures suggest a 90% chance of remaining in La Niña conditions through February with a 50% chance of La Niña conditions in March through May (Figure 6b).

Figure 6a. Forecasts of sea-surface temperature anomalies for the Niño 3.4 Region as of October 19, 2021 (modified from source). “Range of model predictions -1” is the range of the various statistical and dynamical models’ projections minus the most outlying upper and lower projections.

Figure 6b. Probabilistic forecasts of El Niño, La Niña, and La Nada (neutral) conditions (source).
The U.S. Seasonal Drought Outlook through February 28, 2022, projects drought development over most of the state (Figure 7a), although drought development has retreated somewhat from East Texas. The three-month temperature outlook projects warmer-than-normal conditions for the entire state (Figure 7b), while the three-month precipitation outlook favors drier-than-normal conditions for most of state (Figure 7c).

Figure 7a: The U.S. Seasonal Drought Outlook for November 18, 2021, through February 28, 2021 (source).

Figure 7b: Three-month temperature outlook from November 18, 2021 (source).

Figure 7c: Three-month precipitation outlook from November 18, 2021 (source).