SUMMARY:
- About 55% if the state is now in drought with 81% at least abnormally dry.
- It has been drier than Bill Murray’s humor in the Panhandle with two months of no rainfall.
- There is a 60% chance of La Nada conditions returning in the April through June season.
I wrote this article on December 10, 2021.
One of my Facebook friends posted a photo of a sandstorm in the Amarillo area, inducing memories of the Dust Bowl. Indeed, the Amarillo area is dry with the Panhandle getting less than half an inch of rain and much of it getting nothing at all (Figure 1a). With more of the state going into drought over the past month, La Niña seems to be working her dark magic of drying up the state. The good news is that (1) this is a relatively weak La Niña, and (2) there is a growing chance of La Nada (neutral conditions) appearing in late spring. Maybe Santa will bring clouds the color of coal to the Panhandle.
The governor made the news by guaranteeing that the electric grid won’t fail this winter. While I won’t say anything about whether the grid is ready for another Uri, this guarantee seems to be low risk because the odds of two Uri-like events occurring two years in a row seems low. This paper notes that Winter Storm Uri was the “most intense in 30 years,” but that several other storms since 1950 would have produced similar heating demand today. Along with Uri, there have been five severe cold events since 1950 (Figure 1b), so that’s a severe cold snap roughly every 14 years, leading to a 7% chance in any given year (or on the flipside, a 93% chance of a Uri-less year). Those are pretty good odds to make a statement that the grid won’t fail this winter regardless of what has been implemented to weather-proof the grid. Those stats assume stationarity (the statistics are the same with time), but even with a hypothesized increased chance due to climate change, the odds favor a winter full of power versus one with a failing grid.

Figure 1a: Rainfall over the past 60 days in the Panhandle and Far West Texas (source).

Figure 1b: Inferred heating demand in Texas with today’s population and winter storms since 1950 (Doss-Gollin and others, pre-print).
The eastern part of the state and parts of the Gulf Coast received at least 2 (and as much as 6) inches of rain, while the western two-thirds received less than half an inch, with the entirety of the Panhandle getting nothing (Figure 2a). Except for the Lower Rio Grande Valley, the state received less than normal rainfall over the past four weeks with the western half of the state, suffering from less than 10% of normal rainfall (Figure 2b). Rain over the past 90 days — a big driver for drought conditions — remains below normal for almost the entire state (Figure 2c).

Figure 2a: Inches of precipitation that fell in Texas in the 30 days before December 9, 2021 (source). Note that cooler colors indicate lower values and warmer indicate higher values.

Figure 2b: Rainfall as a percent of normal for the 30 days before December 9, 2021 (source).

Figure 2c: Rainfall as a percent of normal for the 90 days before December 19, 2021 (source).
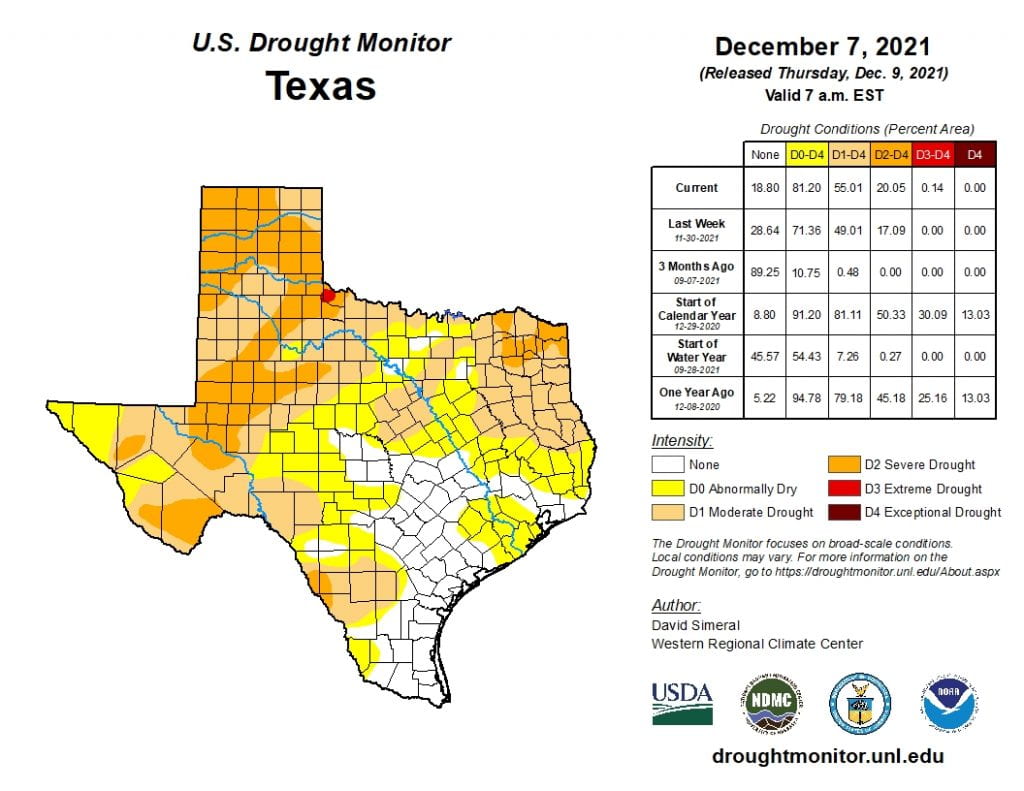
The amount of the state under drought conditions (D1–D4) increased from 35.9% four weeks ago to 55.0% today (Figure 3a) with drought developing or intensifying over most of the state (Figure 3b). A dot of Extreme Drought has appeared in Hardeman County with ganglia of severe drought across the state (Figure 3a). In all, 81.2% of the state remains abnormally dry or worse (D0–D4; Figure 3a), up from 63.9% four weeks ago with abnormally dry conditions appearing in scattered areas across the state (Figure 3a).

Figure 3a: Drought conditions in Texas according to the U.S. Drought Monitor (as of December 7, 2021; source).

Figure 3b: Changes in the U.S. Drought Monitor for Texas between November 9, 2021, and December 7, 2021 (source).
The North American Drought Monitor, which runs a month behind (and is the same for this report as last month’s because we are getting it out before the holidays), continues to show a raging drought in much of the western United States with drought entrenched in the American Southwest (Figure 4a). Precipitation in much of the Rio Grande watershed in Colorado and New Mexico over the last 90 days was less than 50% of normal (Figure 4b). Conservation storage in Elephant Butte Reservoir — an important source of water for the El Paso area — increased slightly from 6.3% full last month to 7.5% today (Figure 4c), just above historic (since 1990) lows.
The Rio Conchos Basin in Mexico, which confluences into the Rio Grande just above Presidio and is an important source of water to the lower part of the Rio Grande in Texas, remains out of drought but remains abnormally dry (Figure 4a). Combined conservation storage in the Amistad and Falcon reservoirs decreased slightly from 36.8% last month to 36.7% full today, about 22 percentage points below normal for this time of year (Figure 4d).

Figure 4a: The North American Drought Monitor for October 31, 2021 (source).

Figure 4b: Percent of normal precipitation for Colorado and New Mexico for the 90 days before December 9, 2021 (source). The red line is the Rio Grande Basin. I use this map to see check precipitation trends in the headwaters of the Rio Grande in southern Colorado, the main source of water to Elephant Butte Reservoir downstream.

Figure 4c: Reservoir storage in Elephant Butte Reservoir since 2019 with the median, min, and max for measurements from 1990 through 2020 (source).

Figure 4d: Reservoir storage in Amistad and Falcon reservoirs since 2019 with the median, min, and max for measurements from 1990 through 2020 (source).
A number of basins continue to have flows below historical 25th, 10th, and 5th flow percentiles (Figure 5a). Statewide reservoir storage is at 79.1% full as of today, down from 79.6% a month ago and just below normal for this time of year (Figure 5b). More reservoirs in the eastern part of the state have fallen below 90% full (Figure 5c) with one, Lake Sulphur Springs, now at 61% full (Figure 5d).

Figure 5a: Parts of the state with below-25th-percentile seven-day average streamflow as of December 9, 2021 (source).

Figure 5b: Statewide reservoir storage since 2019 compared to statistics (median, min, and max) for statewide storage from 1990 through 2020 (source).

Figure 5c: Reservoir storage as of December 9, 2021 in the major reservoirs of the state (source).

Figure 5d: Reservoir storage since 2019 in Lake Falcon compared to statistics (median, min, and max) for statewide storage from 1990 through 2020 (source).
Sea-surface temperatures in the Central Pacific that in part define the status of the El Niño Southern Oscillation cooled into La Niña conditions (Figure 6a), and we remain in a La Niña Advisory. Projections of sea-surface temperatures suggest a 95% chance of remaining in La Niña conditions through February with a 60% chance of La Nada (neutral) in April-June (Figure 6b).

Figure 6a. Forecasts of sea-surface temperature anomalies for the Niño 3.4 Region as of November 19, 2021 (modified from source). “Range of model predictions -1” is the range of the various statistical and dynamical models’ projections minus the most outlying upper and lower projections.

Figure 6b. Probabilistic forecasts of El Niño, La Niña, and La Nada (neutral) conditions (source).
The U.S. Seasonal Drought Outlook through February 28, 2022, projects drought development over much of the state (Figure 7a), although drought development has retreated somewhat from East Texas. The three-month temperature outlook projects warmer-than-normal conditions for the entire state (Figure 7b), while the three-month precipitation outlook favors drier-than-normal conditions for most of state (Figure 7c).

Figure 7a: The U.S. Seasonal Drought Outlook for November 18, 2021, through February 28, 2021 (source).

Figure 7b: Three-month temperature outlook from November 18, 2021 (source).

Figure 7c: Three-month precipitation outlook from November 18, 2021 (source).