SUMMARY:
- 85% of the state is in drought with 96% at least abnormally dry.
- Drought expected to expand to the entire state over the next three months.
- December 2021 was the warmest on record, beating 1933, the previous recordholder, by 5.7 degrees Fahrenheit.
I wrote this article on January 21, 2022.
It was so warm in December that I half expected Santa Claus to arrive at our house Christmas Eve in a Speedo with an entourage of hairless reindeer. If last month seemed warmer than usual, you were, indeed, correct —it was 12.1 degrees Fahrenheit warmer than normal. And not only that, but it was the warmest December on record, beating the previous recordholder — in 1933 — by 5.7 degrees Fahrenheit. That’s right: five freaking point seven degrees! To obscurely reference the title from an early-1980s trivia show that only pre-Millennials will relate to: That’s Incredible!
The state climatologist, John Nielsen-Gammon, in an interview with the Texas Standard, suggests that December 2021 may tie with December 1889 in toastiness, which is in the “pre-record” for statewide averages (and a December that was similarly unburdened by strong cold fronts). He also notes that climate change, in general, has added two degrees to the baseline temperatures of Texas, but that it’s difficult to assess if climate change caused the unseasonably warm temperatures. Regardless, Nielsen-Gammon summed it up: “…it was a ridiculously warm month.”
Although December was record-settingly/unsettlingly warm, the average annual temperature for 2021 came in as the 15th warmest in the 127-year record (since 1895), continuing the trend toward a warmer Texas (Figure 1b). Annual precipitation came in a nudge above normal for the year (Figure 1c).
Looking deep into this year, we’ll continue to suffer at the warm and dry hands of La Niña through the spring before entering La Nada (neutral) conditions. It’s too early to predict what will happen this winter for Niña/Niño/Nada conditions, although at the moment it looks like we’ll enter the fall/winter months under La Nada. The longer-term outlooks suggest warmer-than-normal conditions (about as risky these days as predicting the sun will come up tomorrow…) and equal chances for normal, wetter-than, or drier-than conditions (the same as saying “We don’t know.”).

Figure 1a: Average December temperature in Texas from 1895 through 2021 (source).

Figure 1b: Average annual temperature in Texas from 1895 through 2021 (source).

Figure 1c: Precipitation in Texas (averaged over the state) from 1895 through 2021 (source).
Over the past 30 days, the eastern part of the state, parts of the Gulf Coast, the El Paso area, and small parts of the High Plains received at least 0.5 inches of rain (and more than 10 inches in part of southeast Texas), while the rest of the state received less than half an inch, with the Big Bend area and South-Central Texas getting nothing (Figure 2a). Except for those wet spots in southeast Texas and the El Paso area, the state received less than normal rainfall over the past four weeks, with large parts of the state suffering from less than 10% of normal rainfall (Figure 2b). Rain over the past 90 days — a big driver for drought conditions — remains below normal for almost the entire state except for the Lower Rio Grande Valley, a small area in southeast Texas, and a blip between Fort Stockton and Imperial (they must have paid their taxes on time last year) (Figure 2c).

Figure 2a: Inches of precipitation that fell in Texas in the 30 days before January 21, 2022 (modified from source). Note that cooler colors indicate lower values and warmer indicate higher values. Light grey is no detectable precipitation.

Figure 2b: Rainfall as a percent of normal for the 30 days before January 21, 2022 (modified from source).

Figure 2c: Rainfall as a percent of normal for the 90 days before January 21, 2022 (modified from source).
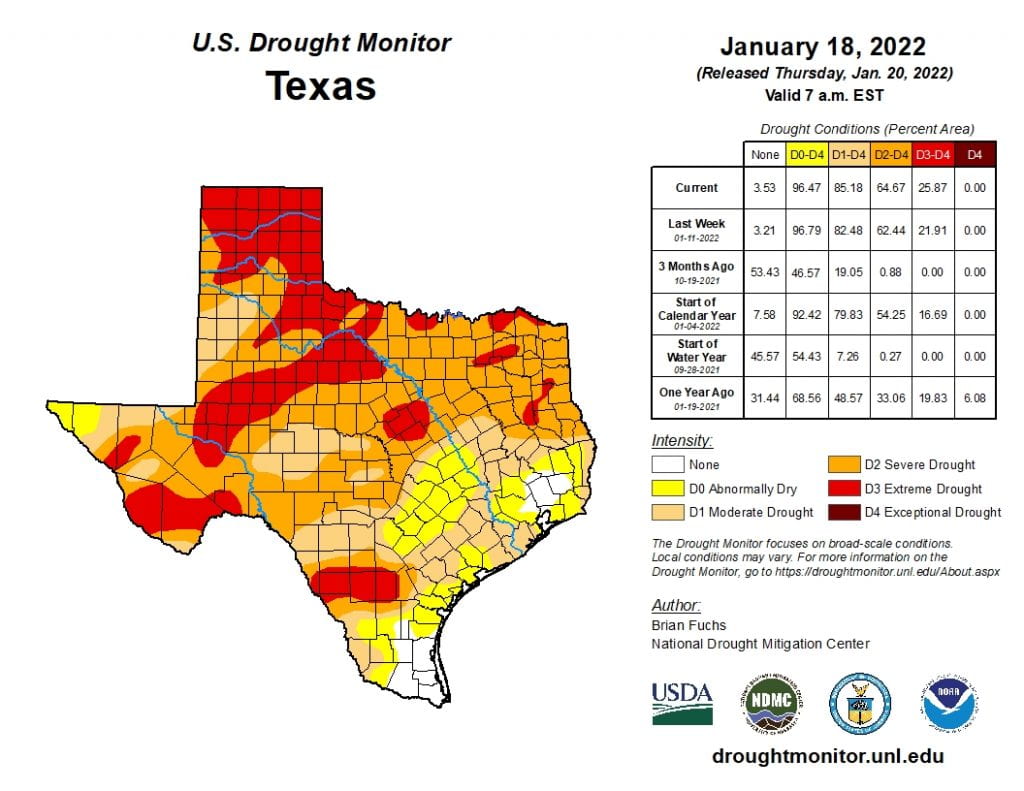
The amount of the state under drought conditions (D1–D4) increased from 55.0% four weeks ago to 85.2% today (Figure 3a) with drought developing or intensifying over most of the state (Figure 3b). Extreme Drought is blotching the state more than the Dallas Cowboys’ recent record in playoff games with pockets in all regions (Figure 3a). In all, 96.5% of the state remains abnormally dry or worse (D0–D4; Figure 3a), up from 81.2% four weeks ago, with only part of southeast Texas and the Lower Rio Grande Valley escaping abnormally dry or worse conditions (Figure 3a).

Figure 3a: Drought conditions in Texas according to the U.S. Drought Monitor (as of January 18, 2022; source).

Figure 3b: Changes in the U.S. Drought Monitor for Texas between December 21, 2021, and January 18, 2022 (source).
The North American Drought Monitor, which runs a month behind, continues to show drought over much of the western United States with drought conditions expanding eastward (Figure 4a). Precipitation in much of the Rio Grande watershed in Colorado and New Mexico over the last 90 days was less than 50% of normal (Figure 4b).
Conservation storage in Elephant Butte Reservoir — an important source of water for the El Paso area — increased from 7.5% full last month to 9.4% today (Figure 4c), just above historic (since 1990) lows (the blip is, I presume, just a blip — if that was real, it would have made international news!).
The Rio Conchos Basin in Mexico, which confluences into the Rio Grande just above Presidio and is an important source of water to the lower part of the Rio Grande in Texas, remains partially abnormally dry (Figure 4a). Combined conservation storage in the Amistad and Falcon reservoirs decreased slightly from 36.7% last month to 36.5% full today, about 22 percentage points below normal for this time of year (Figure 4d).

Figure 4a: The North American Drought Monitor for December 31, 2021 (source).

Figure 4b: Percent of normal precipitation for Colorado and New Mexico for the 90 days before January 21, 2022 (modified from source). The red line is the Rio Grande Basin. I use this map to see check precipitation trends in the headwaters of the Rio Grande in southern Colorado, the main source of water to Elephant Butte Reservoir downstream.

Figure 4c: Reservoir storage in Elephant Butte Reservoir since 2020 with the median, min, and max for measurements from 1990 through 2021 (graph from Texas Water Development Board).

Figure 4d: Reservoir storage in Amistad and Falcon reservoirs since 2020 with the median, min, and max for measurements from 1990 through 2021 (graph from Texas Water Development Board).
A number of basins across the state have flows over the past week below historical 25th, 10th, and 5th flow percentiles (Figure 5a). Statewide reservoir storage is at 78.3% full as of today, down from 79.1% a month ago, about four percentage points below normal for this time of year (Figure 5b). Unusual for this time of year, more reservoirs in the eastern part of the state have fallen below 90%, and now 80%, full, (Figure 5c) with one, Lake Sulphur Springs, now at 56% full (Figure 5d).

Figure 5a: Parts of the state with below-25th-percentile seven-day average streamflow as of December 9, 2022 (map modified from U.S. Geological Survey).

Figure 5b: Statewide reservoir storage since 2020 compared to statistics (median, min, and max) for statewide storage from 1990 through 2021 (graph from Texas Water Development Board).

Figure 5c: Reservoir storage as of January 21, 2022 in the major reservoirs of the state (modified from Texas Water Development Board).

Figure 5d: Hydrograph of the month — reservoir storage since ~1997 in Lake Sulphur Springs (graph from Texas Water Development Board).
Sea-surface temperatures in the Central Pacific, which in part define the status of the El Niño Southern Oscillation, continue to cool deeper into La Niña conditions (Figure 6a), and we remain under a La Niña Advisory. Projections of sea-surface temperatures suggest a 67% chance of remaining in La Niña conditions through the March-May season with a 51% chance of La Nada (neutral) conditions returning in the April-June season (Figure 6b).

Figure 6a. Forecasts of sea-surface temperature anomalies for the Niño 3.4 Region as of December 20, 2021 (modified from Climate Prediction Center and others). “Range of model predictions -1” is the range of the various statistical and dynamical models’ projections minus the most outlying upper and lower projections.

Figure 6b. Probabilistic forecasts of El Niño, La Niña, and La Nada (neutral) conditions (graph from the Climate Prediction Center and International Research Institute).
The U.S. Seasonal Drought Outlook through April 2022 is much worse than the one I showed last month (which was through February 2022), with drought persistence and development now capturing the entire state (Figure 7a). The three-month temperature outlook projects warmer-than-normal conditions for the entire state (Figure 7b), while the three-month precipitation outlook favors drier-than-normal conditions for most of state (Figure 7c).

Figure 7a: The U.S. Seasonal Drought Outlook for January 20, 2022, through April 30, 2022 (source).

Figure 7b: Three-month temperature outlook from January 20, 2022 (source).

Figure 7c: Three-month precipitation outlook from January 20, 2022 (source).