With 38 public universities and 35 private colleges and universities in the state and many more across the country (and the world) interested in Texas, there’s a great deal of academic scholarship focused on water in the Lone Star State. In this column, I provide brief summaries to several recent academic publications on water in Texas.

Let’s start thinking about water!
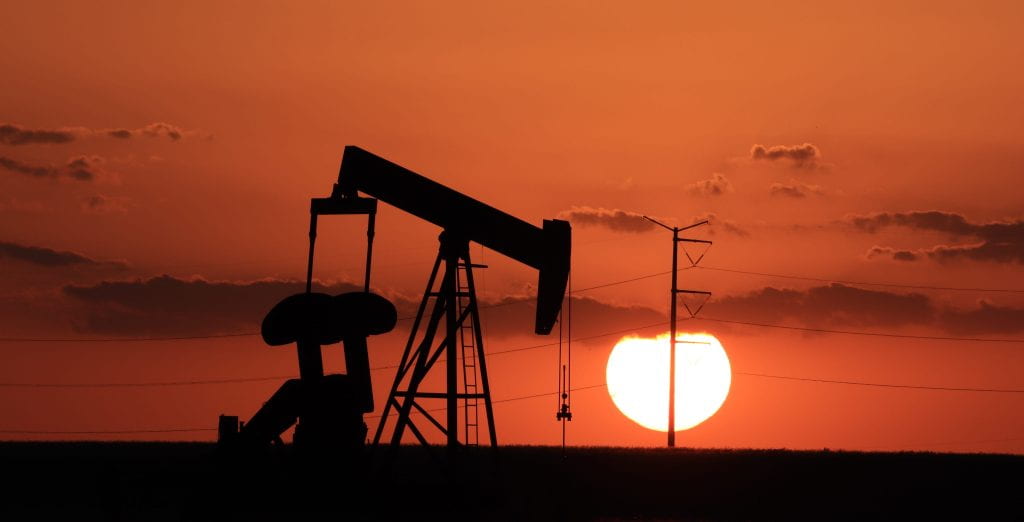
Assessing Cumulative Water Impacts From Shale Oil and Gas Production—Permian Basin Case Study

Pump jack silhouette in the Texas oilfield. Photo credit: Gary Hart
First off, this paper — and Scanlon’s papers in general — is a masterclass on how to write an abstract. It’s got everything: the context, the purpose, and, most importantly, the results. Oddly, many abstracts only inform you of what the authors did rather than what they discovered. I call those “teaser abstracts” (as well as “a waste of time”). Tell your readers your primary conclusions in the abstract, fer cry eye! The bad thing about well-written abstracts is that, given the limited words I have for describing papers here, it can appear that I’ve plagiarized the authors. C’est la vie!
This paper summarizes the effects of oil and gas production on groundwater and surface water in the Permian Basin of Texas and New Mexico. The authors note that water demand for fracking peaked in 2019 and represented about 35% of non-oil and gas industry water use. Most of the water for fracking came from aquifers with about 12,900 water wells drilled over the past decade in Texas, about 46% of all new wells drilled in the region. Most of the wells drilled to support fracking were in the Ogallala (~5,000 wells), with about 4,000 wells drilled in the Dockum, about 1,400 in the Edwards-Trinity (Plateau), about 1,400 in the Permian, about 910 in the Pecos Valley, and about 290 in the Rustler aquifers. About 70 to 80% of produced water is injected into “shallow” geologic units. With about 70,000 abandoned oil wells, it’s possible that injected produced water could return to the surface. There were also about 11,000 oil spills in the Permian Basin between 2009 and 2018. The authors suggest reusing the water to minimize contamination potential as well as reduce injection-induced earthquakes.
Citation
Scanlon, B.R., Reedy, R.C., and Wolaver, B.D., 2022, Assessing cumulative water impacts from shale oil and gas production—Permian Basin case study: Science of the Total Environment, 811 (2022) 152306 http://dx.doi.org/10.1016/j.scitotenv.2021.152306
Characterization of Produced Water and Surrounding Surface Water in the Permian Basin
The 2021 Texas Legislature created the Texas Produced Water Consortium at Texas Tech University to investigate reusing produced water from oil and gas operations for a variety of purposes up to and including municipal use (full disclosure: I am a member of the stakeholder advisory council for the consortium). One of the key questions for the consortium is what treatments should be employed to achieve water qualities needed for various uses. And to answer that question, one needs to know what the water quality of produced waters looks like.
Enter Jiang and others, who collected 46 samples of produced water in Texas and New Mexico from the Permian Basin as well as 10 samples from the Pecos River (a potential receiving body) and analyzed them for more than 300 inorganic and organic chemical constituents. They found that the produced water had total dissolved solids ranging from 100,800 to 201,500 milligrams per liter (for comparison, freshwater has total dissolved solids of less than 1,000 milligrams per liter, while seawater has about 35,000 milligrams per liters).
The authors also found various mineral salts, metals, oil and grease, volatile and semi-volatile organic compounds, radionuclides, ammonia, hydraulic fracturing additives, per- and polyfluoroalkyl substances, and naturally occurring radioactive material in the produced water. The Pecos River had mean total dissolved solids of 4,591 milligrams per liter with no evidence of produced water contamination. The authors note that the total dissolved solids limits of reverse osmosis range between 30,000 and 45,000 milligrams per liter, meaning that thermal techniques such as thermal distillation or solar stills would be needed to clean up the water.
Citation
Jiang, W., Xu, X.,Hall, R., Zhang, Y., Carroll, K.C., Ramos, F., Engle, M.E., Lin, L., Wang, H., Sayer, M., and Xu, P., 2022, Characterization of produced water and surrounding surface water in the Permian Basin, the United States: Journal of Hazardous Materials 430 (2022) 128409 https://doi.org/10.1016/j.jhazmat.2022.128409
Using the Change Point Model Framework To Identify Windows for Water Resource Management Action in the Lower Colorado River Basin of Texas
A change point model is a statistical analysis of a time series that identifies a change in the trend. Lavy and others used this approach to identify changes in various water-related time series and then attempt to correlate them to changes resulting from or resulting in managerial interventions. The authors found three categories of change points: (1) increasing urban water use and changes in local climate conditions; (2) declines in agriculture water use and crop production; and (3) declining lake levels, declining river flows, and extended droughts. One change point was for mean annual maximum temperature in 1997 with warmer temperatures since that time. They also found change points for lake levels in 2005 and 2007, depending on the metric. Change points for urban water use in Travis and Bastrop counties occurred in 1994, 1996, and 1997, depending on the metric. Agricultural water use revealed change points between 1996 and 2001, depending on the metric. Rice production had various change points with the more recent ones between 1995 and 2002 for various metrics.
The authors then attempt to compare the change points to “documented managerial events” such as the passage of legislation, water deals, water curtailments, and management plans. In some cases, the change points relate to each other. The drought of 1996–1997 led to the passage of Senate Bill 1 (and that drought certainly proved to be a climatic change point because the climate since then is considerably different than the climate 30 years before that drought). Subsequent droughts, including the second worst statewide drought of record for the state and a new drought-of-record for the Lower Colorado River, combined with rapid growth have certainly led to many changes in the region.
The authors highlight the passage of Senate Bill 2 in 2001, which resulted in the reworking of groundwater management areas, as “an important moment for water planning and conservation across the state,” but those areas were simply lines on a map until the passage of House Bill 1763 in 2005 (and even that seems to have had limited impact on the ground). Both of those bills are responding to the policy change point caused by the passage of Senate Bill 1, which resulted in an explosion of groundwater conservation district creation and dissatisfaction in some quarters of the Balkanization of groundwater management. Regardless, their observation that they don’t see change points related to Senate Bill 2 (a cat vomit of a bill) is almost certainly correct.
I’ve always seen Senate Bill 3 as the result of the San Marcos River Foundation’s application for the remaining water in the Guadalupe River for environmental purposes. However, this paper made me think about what probable change points caused the foundation to apply for this permit (which, according to its web page, was increased population and thus anticipated demand for water from the river).
Well, anyways: so much for meeting my arbitrary word count on this one… The chicken-and-egg thinking this paper induced is kinda fun! The authors point out that the change points sometimes precede managerial decisions but also sometimes occur after them, and that looking for change points may help identify times that managerial action is needed or is expected to occur.
Citation
Lavy, B.L., Weaver, R.C., and Hagelman III, R.R., 2022, Using the change point model (CPM) framework to identify windows for water resource management action in the Lower Colorado River Basin of Texas, USA: Water, v. 14, no. 18 https://doi.org/10.3390/w14010018
Join Our Mailing List
Subscribe to Texas+Water and stay updated on the spectrum of Texas water issues including science, policy, and law.