SUMMARY:
- 87% of the state is abnormally dry or worse, and 63% of the state is in drought
- 76% chance of La Niña conditions remaining December–February with a 57% chance of neutral conditions arriving in February–April
- Warmer and drier than normal conditions projected for most of Texas for December-January-February
I wrote this article on November 28 and 29, 2022.
The Bride, Mr. P.S. Church the Ditch Cat, and I spent Thanksgiving up in Cloudcroft, New Mexico, where we got a lesson on how quickly the weather (and weather forecasts) can change. Originally, projections showed that our trip would be dry and cold. The cold was correct, but we did not expect six inches of snow. I hadn’t shoveled snow since 1985 when I lived in Northern Illinois! I learned about the value of four-wheel drive, tire chains, and waterproof boots after we progressed all of 10 feet during the first two hours of the drive home. Is it me, or do the large temperatures swings and weather this fall seem wackier than usual?
The World Meteorological Society just released its first State of Global Water Resources report looking back on 2021. The Society already publishes a State of the Global Climate report each year and has decided to do the same for water resources. La Niña and climate change dominate impacts on water resources, but the Society also concluded that there is a need for more information on the world’s water resources. We are fortunate in Texas to have monitoring networks and accessible data to assess our water situation with relative ease and accuracy. So a big thank you to the Texas Water Development Board, the U.S. Geological Survey, NOAA, the river authorities, groundwater managers, and many, many others for collecting this critical data and making it available.
River discharge across the planet was a mixed bag in 2021, although most showed lower-than-normal flow conditions (Figure 1a). Many mid-latitude basins suffered from drought conditions. Using GRACE data (gravity-measuring satellites) to measure changes in terrestrial water (all water, including groundwater, surface water, soil water, and snow and ice) shows a similar pattern but with differences, such as in Central Africa (Figure 1b).
We do not worry too much about glaciers in Texas (at least not for local water resources [at least not for the time being]), but the report also presents information on glacial trends, and they ain’t pretty (Figure 1c). Reference glaciers in western Canada and the U.S., Central Europe, Alaska, and the Southern Andes have decreased by 30% to 40% since 1976. Yikes! Given how fast those changes are, we may need to reconsider the meaning of ‘moving at a glacial pace.’ Although the glaciers are a long ways away from Texas, their melting indirectly impacts water resources in the state, such as through sea level rise and impacts to weather and climate. The same climatic issues affecting the glaciers are also affecting rainfall in the upper reaches of the Rio Grande Valley in Colorado, thus affecting reservoir levels in Elephant Butte Reservoir.

Figure 1a: River discharge in 2021 as compared to 1991 to 2020 conditions (graph from WMO).

Figure 1b: Trends in terrestrial water storage anomaly per year calculated for 2002 to 2021. Terrestrial water storage includes all water including groundwater, surface water, soil water, and snow and ice (graph from WMO). Greenland losses not shown since they are HUGE and wreck the range.

Figure 1c: Cumulative glacier mass change relative to 1976 for regional and global means based on data from reference glaciers (graph from WMO).
Over the past 30 days, we saw “normal Texas,” with more rain in the eastern parts and less in the western and southern parts. Parts of East Texas in the Houston area saw more than 10 inches of rain while the El Paso region saw less than 0.1 inches (Figure 2a). As far as normality goes, there were dry and wet extremes with hot spots of two-three times more than average in the Upper Pecos River region, the northeastern Edwards Plateau Region, the Corpus Christi area, and the Lower Rio Grande Valley (Figure 2b). Rain over the past 90 days—a big driver for drought conditions—remains below normal for almost the entire state except for the Edwards Plateau and a few other spots (Figure 2c).

Figure 2a: Inches of precipitation that fell in Texas in the 30 days before November 28, 2022 (modified from source). Note that cooler colors indicate lower values and warmer indicate higher values. Light grey is no detectable precipitation.

Figure 2b: Rainfall as a percent of normal for the 30 days before November 28, 2022 (modified from source).

Figure 2c: Rainfall as a percent of normal for the 90 days before November 28, 2022 (modified from source).
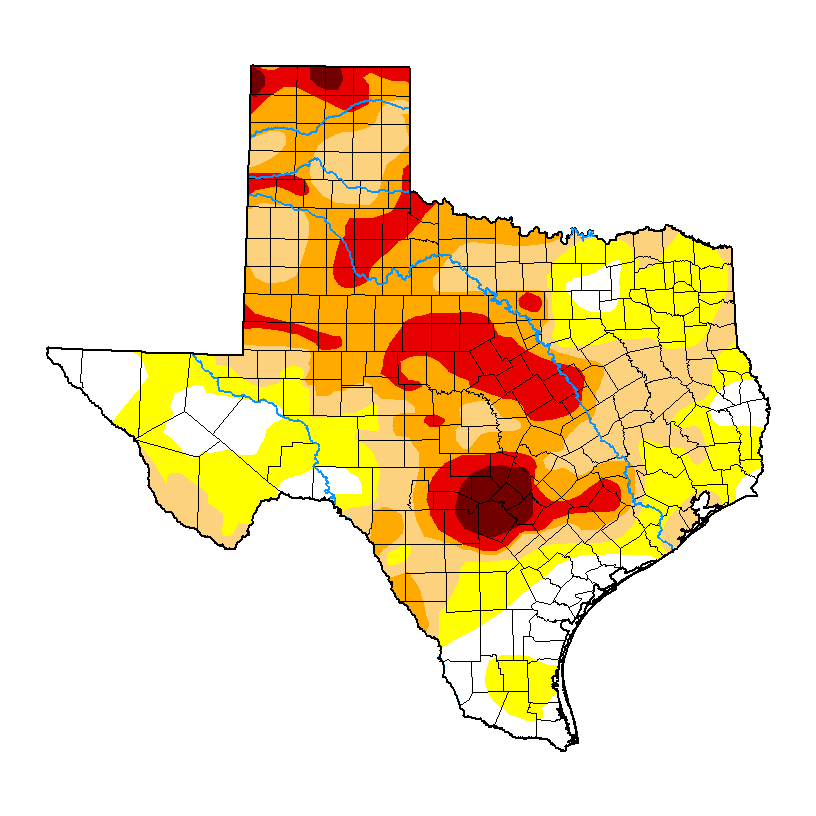
The amount of the state under drought conditions (D1–D4) decreased from 72% five weeks ago to 63% today (Figure 3a), with drought decreasing in the eastern parts of the state (Figure 3b). Extreme drought, or worse, has increased from 13% of the state five weeks ago to 15%, with exceptional drought increasing slightly from 1.4% to 2.4% (Figure 3a). In all, 87% of the state remains abnormally dry or worse (D0–D4; Figure 3a), down a bit from 93% four weeks ago.

Figure 3a: Drought conditions in Texas according to the U.S. Drought Monitor (as of November 22, 2022; source).

Figure 3b: Changes in the U.S. Drought Monitor for Texas between October 25, 2022, and November 22, 2022 (source).
The North American Drought Monitor, which runs a month behind, shows drought over much of the lower 48 (Figure 4a). Precipitation over much of the Rio Grande watershed in Colorado and New Mexico over the last 90 days was lower than normal except for the western part of the basin in mid-New Mexico (Figure 4b).
Conservation storage in Elephant Butte Reservoir—an important source of water for the El Paso area—increased to 8.8% full compared to 6.7% last month (Figure 4c), slightly above historic (since 1990) lows.
The Rio Conchos Basin in Mexico, which confluences with the Rio Grande just above Presidio and is the largest tributary to the Lower Rio Grande, remains out of drought (Figure 4a). Combined conservation storage in the Amistad and Falcon reservoirs remained the same at 31.8 full, about 22 percentage points below normal for this time of year and below the lowest low recorded since 1990 (Figure 4d).

Figure 4a: The North American Drought Monitor for October 31, 2022 (source).

Figure 4b: Percent of normal precipitation for Colorado and New Mexico for the 90 days before November 29, 2022 (modified from source). The red line is the Rio Grande Basin. I use this map to see check precipitation trends in the headwaters of the Rio Grande in southern Colorado, the main source of water to Elephant Butte Reservoir downstream.

Figure 4c: Reservoir storage in Elephant Butte Reservoir since 2020 with the median, min, and max for measurements from 1990 through 2021 (graph from Texas Water Development Board).

Figure 4d: Reservoir storage in Amistad and Falcon reservoirs since 2020 with the median, min, and max for measurements from 1990 through 2021 (graph from Texas Water Development Board).
Basins across the state continue to have flows over the past week below historical 25th, 10th, and 5th flow percentiles (Figure 5a). Statewide reservoir storage is at 69.7% full as of today, up about 730,000 acre-feet from 67.4% a month ago and now about 11 percentage points below normal for this time of year (Figure 5b).
Many reservoirs in the eastern part of the state remain less than 90% full, with many reservoirs less than 80% full and some even less than 70% full (Figure 5c). The reservoir marked in orange northeast of Dallas (between 50% and 60% full) is accurate but perhaps unfairly orange since it, Bois D’Arc Lake, is a newborn and just started its initial inundation earlier this year (Figure 5c). Recent rains benefited the Waco reservoir but it remains below normal by 37 percentage points for this time of year and has been below historic (since 1990) lows for the past four months (Figure 5d).

Figure 5a: Parts of the state with below-25th-percentile seven-day average streamflow as of November 28, 2022 (map modified from U.S. Geological Survey).

Figure 5b: Statewide reservoir storage since 2020 compared to statistics (median, min, and max) for statewide storage from 1990 through 2021 (graph from Texas Water Development Board).

Figure 5c: Reservoir storage as of November 29, 2022, in the major reservoirs of the state (modified from Texas Water Development Board).

Figure 5d: Hydrograph Of The Month—Reservoir storage for the Waco area reservoir (Waco; graph from Texas Water Development Board).
Sea-surface temperatures in the Central Pacific that, in part, define the status of the El Niño Southern Oscillation continue to reside in La Niña conditions and cooled deeper into those conditions over the last month (Figure 6a). This month’s projection is slightly warmer than last month’s and suggests that La Niña conditions will remain through the winter (Figure 6a). Accordingly, we remain under a La Niña Advisory. Projections of sea-surface temperatures suggest a 76% chance of remaining in La Niña conditions for December-February, with a 57% chance (54% last month) of neutral conditions reigning in February-April (Figure 6b).

Figure 6a. Forecasts of sea-surface temperature anomalies for the Niño 3.4 Region as of September 19, 2022 (modified from Climate Prediction Center and others). “Range of model predictions -1” is the range of the various statistical and dynamical models’ projections minus the most outlying upper and lower projections. Sometimes those predictive models get a little craycray.

Figure 6b. Probabilistic forecasts of El Niño, La Niña, and La Nada (neutral) conditions (graph from Climate Prediction Center and others).
The U.S. Seasonal Drought Outlook through February 2023 shows drought remaining in much of the state, returning in areas that received recent relief, and Far West Texas staying out of drought (Figure 7a). In a bit of good news, drought seems to be breaking up to the west of us; however, in a bit of bad news, drought continues to our north and has expanded to our east (Figure 7a). In my experience, these super-regional droughts have more persistence than regional and subregional droughts. Like a broken record, the three-month temperature outlook projects warmer-than-normal conditions for the entire state (Figure 7b), while the three-month precipitation outlook favors drier-than-normal conditions for the entire state (Figure 7c).

Figure 7a: The U.S. Seasonal Drought Outlook for November 17, 2022, through February 28, 2023 (source).

Figure 7b: Three-month temperature outlook for December-January-February 2022-2023 (source).

Figure 7c: Three-month precipitation outlook for December-January-February 2022-2023 (source).