SUMMARY:
- 2022 was the 11th warmest, 13th driest, and 10th drouthiest on record for Texas
- the next three months are expected to be warmer and drier than normal
- La Niña is still expected to transition to neutral conditions between February and April, with an 82% chance of neutral conditions existing for the March to May season
I wrote this article on January 20, 2023.
With New Year’s comes reflection on the previous year and an outlook to the coming year. For the most part, 2022 was hot and dry for Texas, with a rare third-year La Niña certainly not helping things. All in all, 2022 was the 11th warmest year on record (since 1895) for the state, supporting the continued trend of warming temperatures in Texas (Figure 1a).
Unsurprisingly, precipitation came in lower than average for 2022 with a 5.85-inch deficit as compared with the long-term average (Figure 1b), coming in as the 13th driest year since 1895 and the third driest year since 1956 (2011 is the driest and 1988 the second driest). As far as drought is concerned, 2022 was the 10th drouthiest since 1895 (Figure 1c) and the 3rd since 1956 (with 2011 and 2012 as the 1st and second since 1956).
The 2022 Atlantic Hurricane Season, projected to be more active than normal, was a whimper for Texas, with no tropical systems landfalling on our shores (Figure 1d). Tropical storms are double-edged swords for us: we don’t want a strong one that threatens life and property, but a “mellow” storm can refill reservoirs and aquifers. The Lower Rio Grande Valley did benefit from an unnamed tropical wave that bumped up storage in Lake Amistad. Despite the season providing fewer tropical storms and major hurricanes than expected, the 2022 season was the third costliest on record, driven largely by Hurricane Fiona. Interestingly, Fiona was the costliest hurricane to hit Canada.
Looking forward, this year (in my honest opinion…) mostly hinges on what happens with rainfall in the spring before we enter our typical hot and dry summer. Overall, statewide reservoir storage is starting about 10 percentage points below that of 2011, so hot and dry from now through summer would not be good. We’re still in La Nina conditions with a transition expected during the spring, so our rainfall status in the springs may depend on the timing of that transition. Although California has been getting firehosed lately with atmospheric rivers—perhaps a hint of the Nina transition—Texas has been oddly suffering from a rain hole (Figure 1e). If we don’t get substantial rainfall in the spring, we’ll see even lower reservoir levels, lower levels in the Edwards Aquifer, and more communities struggling with water supplies.

Figure 1a: Average annual temperature in Texas since 1895 (source).

Figure 1b: Statewide precipitation in Texas since 1895 (source).

Figure 1c: Statewide Palmer Drought Severity Index in Texas since 1895 (source).

Figure 1d: Paths of tropical storms for the 2022 Hurricane Season (source).

Figure 1e: The Rain Hole: Inches of precipitation that fell over the United States in the 30 days before January 20, 2023 (modified from source). Note that cooler colors indicate lower values and warmer indicate higher values.
Over the past 14 days, much of East Texas saw more than 3 inches of rain, while the rest of the state saw less than a quarter of an inch (Figure 2a). Rainfall over the past 30 days has been only 10% of normal for most of the state (Figure 2b). Rain over the past 90 days—a big driver for drought conditions—remains below normal for almost the entire state except for parts of East Texas, the Blackland Prairies, much of the coast, and the Upper Pecos in Texas (Figure 2c).

Figure 2a: Inches of precipitation that fell in Texas in the 30 days before January 20, 2023 (modified from source). Note that cooler colors indicate lower values and warmer indicate higher values. Light grey is no detectable precipitation.

Figure 2b: Rainfall as a percent of normal for the 30 days before January 20, 2023 (modified from source).

Figure 2c: Rainfall as a percent of normal for the 90 days before January 20, 2023 (modified from source).
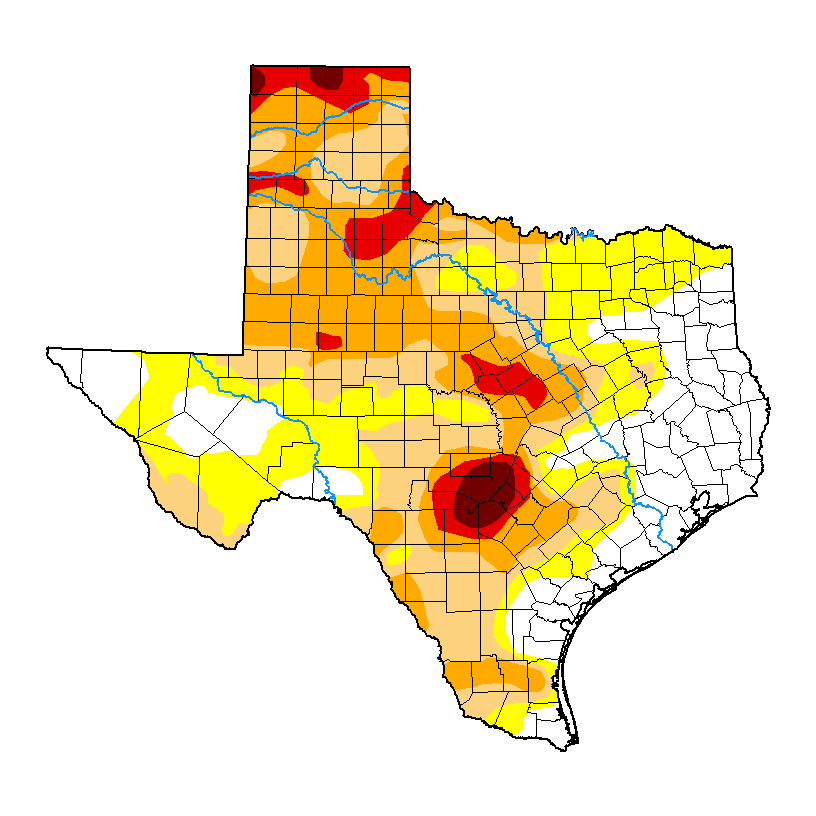
The amount of the state under drought conditions (D1–D4) increased from 52% six weeks ago to 55% today (Figure 3a), with drought decreasing in a small part of northeast Texas but increasing in parts of the eastern half of the state (Figure 3b). Extreme drought, or worse, has increased from 7% of the state six weeks ago to 8%, with exceptional drought increasing from 1.4% to 1.8% (Figure 3a). In all, 78% of the state remains abnormally dry or worse (D0–D4; Figure 3a), up from 75% six weeks ago.

Figure 3a: Drought conditions in Texas according to the U.S. Drought Monitor (as of January 20, 2023; source).

Figure 3b: Changes in the U.S. Drought Monitor for Texas between December 20, 2022, and January 17, 2023 (source).
The North American Drought Monitor, which runs a month behind, continues to show drought over much of the lower 48 (Figure 4a), although we now know that California is out of drought, at least locally. Precipitation over much of the Rio Grande watershed in Colorado and New Mexico over the last 90 days was lower than normal except for a small part in the central basin in mid-New Mexico (Figure 4b).
Conservation storage in Elephant Butte Reservoir—an important source of water for the El Paso area—increased to 12.5% full from 10.3% six weeks ago (Figure 4c), slightly above historic (since 1990) lows.
The Rio Conchos basin in Mexico, which confluences with the Rio Grande just above Presidio and is the largest tributary to the Lower Rio Grande, remains out of drought but with abnormally dry conditions developing in the highlands (Figure 4a). Combined conservation storage in the Amistad and Falcon reservoirs decreased slightly to 32.1% full from 32.2% two weeks ago, about 22 percentage points below normal for this time of year and below the lowest low recorded since 1990 (Figure 4d).

Figure 4a: The North American Drought Monitor for December 31, 2022 source).

Figure 4b: Percent of normal precipitation for Colorado and New Mexico for the 90 days before January 20, 2023 (modified from source). The red line is the Rio Grande Basin. I use this map to see check precipitation trends in the headwaters of the Rio Grande in southern Colorado, the main source of water to Elephant Butte Reservoir downstream.

Figure 4c: Reservoir storage in Elephant Butte Reservoir since 2021 with the median, min, and max for measurements from 1990 through 2022 (graph from Texas Water Development Board).

Figure 4d: Reservoir storage in Amistad and Falcon reservoirs since 2021 with the median, min, and max for measurements from 1990 through 2022 (graph from Texas Water Development Board).
Basins across the state continue to have flows over the past week below historical 25th, 10th, and 5th flow percentiles (Figure 5a). Statewide reservoir storage is at 71.5% full as of January 20, up about 220,000 acre-feet from 70.8% two weeks ago and about 10 percentage points below normal for this time of year (Figure 5b).
Several reservoirs in the eastern part of the state remain less than 90% full, with some reservoirs less than 80% full and some even less than 70% full (Figure 5c). The reservoir marked in orange northeast of Dallas (between 50 and 60% full) is accurately but perhaps unfairly orange since it, Bois D’Arc Lake, is a newborn and just started its initial inundation earlier this year (Figure 5c). Medina Lake is in the news again with near-historic lows and storage that’s 6.1% full (Figure 5d).

Figure 5a: Parts of the state with below-25th-percentile seven-day average streamflow as of January 19, 2023 (map modified from U.S. Geological Survey).

Figure 5b: Statewide reservoir storage since 2021 compared to statistics (median, min, and max) for statewide storage from 1990 through 2022 (graph from Texas Water Development Board).

Figure 5c: Reservoir storage as of January 20, 2023, in the major reservoirs of the state (modified from Texas Water Development Board).

Figure 5d: Hydrograph of the Month—Reservoir storage for Medina Lake (graph from Texas Water Development Board).
Sea-surface temperatures in the Central Pacific that, in part, define the status of the El Niño Southern Oscillation, continue to reside in La Niña conditions with stable temperatures (August-October) (Figure 6a). This month’s expert (consolidated) projection is slightly warmer than last month’s but suggests that La Niña conditions will remain through the winter (Figure 6a). Accordingly, we remain under a La Niña Advisory. Sea-surface temperature projections show a continuation of La Niña until a transition to neutral conditions in the February to April season, with an 82% chance of neutral conditions during the March to May season (Figure 6b). The expert (consolidated) projection (released in December) suggests neutral conditions for the Summer-Fall (Figure 6a), while the official probabilities (released this month) slightly favor El Niño conditions (Figure 6b).

Figure 6a. Forecasts of sea-surface temperature anomalies for the Niño 3.4 Region as of December 19, 2022 (modified from Climate Prediction Center and others). “Range of model predictions -1” is the range of the various statistical and dynamical models’ projections minus the most outlying upper and lower projections. Sometimes those predictive models get a little craycray.

Figure 6b. Probabilistic forecasts of El Niño, La Niña, and La Nada (neutral) conditions (graph from Climate Prediction Center and others).
The U.S. Seasonal Drought Outlook through April 2023 shows drought persisting and developing over much of the state (Figure 7a). Like a broken record, the three-month temperature outlook projects warmer-than-normal conditions for all of the state (Figure 7b), while the three-month precipitation outlook favors drier-than-normal conditions for most of the state (Figure 7c).

Figure 7a: The U.S. Seasonal Drought Outlook for January 19, 2023, through April 30, 2023 (source).

Figure 7b: Three-month temperature outlook for February-March-April 2023 (source).

Figure 7c: Three-month precipitation outlook for February-March-April 2023 (source).