SUMMARY:
- Drought conditions have grown to encompass 58% of the state, with extreme or worse drought conditions intensifying to include 10% of the state.
- Statewide reservoir storage increased by 1.2 million acre-feet to 75% full.
- La Niña is expected to transition to neutral conditions over the next couple of months (with a possible El Niño in the fall).
I wrote this article on February 26, 2023.
My weather bud (not weatherbug…) Victor Murphy from the National Weather Service, upon seeing last month’s year-in-review write-up, sent me a link that provides a county-by-county map showing the severity of last year’s drought as compared with the 128-year record.
The map shows that most of the state suffered precipitation deficits that were in the lower third of the 128-year record and that many of those were among the lower 10% (Figure 1). Two counties, Bexar and Erath, experienced their driest years (Figure 1a). Bexar County received only 12.9 inches of precipitation in 2022 compared to a long-term average of 27.1 inches. Erath County received only 16.3 inches of precipitation in 2022 compared to a long-term average of 29.7 inches.
A total of 251 counties (out of the 254 counties in Texas) had annual average temperatures among the warmest upper third of the 128-year record, with about half of those among the warmest 10% (Figure 1b). Two counties, Erath and its neighbor Comanche, had their warmest years on record.
Thank you, Victor! I will add these charts to my repertoire! Victor also has a personal Twitter account (@wxmanvic) that is a wealth of weather (and football) information. Because Vic is stationed out of the Dallas area, his feed is rich with info about that part of the state.

Figure 1a: County precipitation rank for 2022 (modified from here).

Figure 1b: County average temperature rank for 2022 (modified from here).
Over the past 30 days, much of upper East Texas saw more than 5 inches of rain while much of the rest of the sloped down from 5 to less than 0.1 inches toward the west and southwest, with the Big Bend area getting a good dousing of 1 to 2 inches (Figure 2a). Most of the state saw less than normal rainfall over the past 30 days, with the Big Bend area seeing four to six times normal (Figure 2b). Rain over the past 90 days—a big driver for drought conditions—remains below normal for almost the entire state, with large areas receiving less than 25% of normal (Figure 2c).

Figure 2a: Inches of precipitation that fell in Texas in the 30 days before February 26, 2023 (modified from source). Note that cooler colors indicate lower values and warmer indicate higher values. Light grey is no detectable precipitation.

Figure 2b: Rainfall as a percent of normal for the 30 days before February 26, 2023 (modified from source).

Figure 2c: Rainfall as a percent of normal for the 90 days before February 26, 2023 (modified from source).
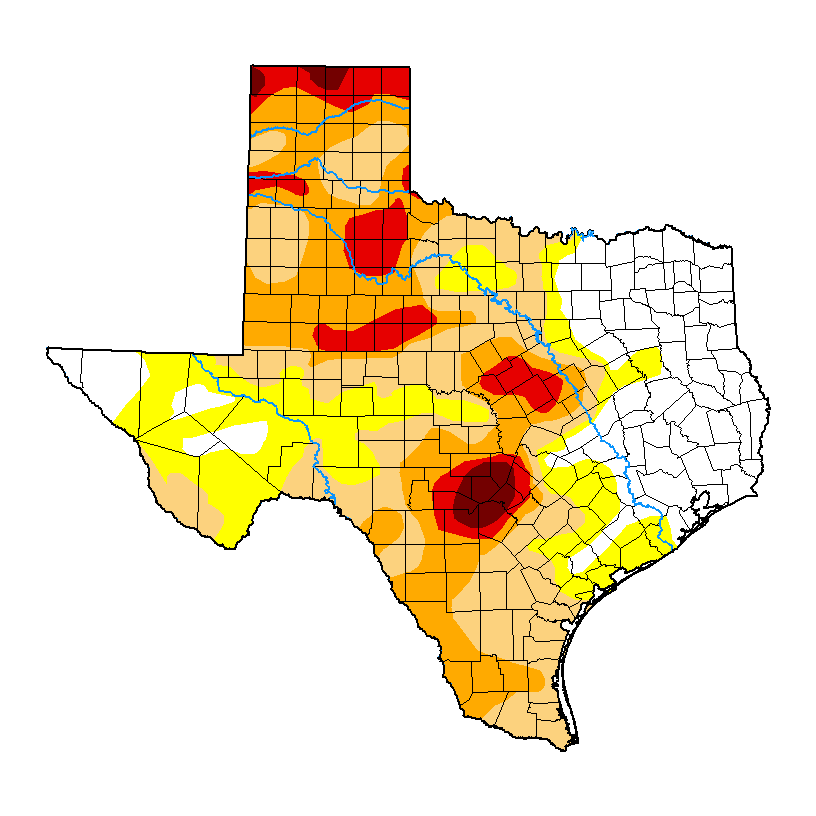
The amount of the state under drought conditions (D1–D4) increased from 55% four weeks ago to 58% today (Figure 3a), with drought decreasing toward the east but intensifying in parts along the Lower Rio Grande Valley (Figure 3b). Extreme drought or worse has increased from 8% of the state four weeks ago to 10%, with exceptional drought remaining the same at 1.8% (Figure 3a). In all, 77% of the state remains abnormally dry or worse (D0–D4; Figure 3a), down slightly from 78% four weeks ago.

Figure 3a: Drought conditions in Texas according to the U.S. Drought Monitor (as of February 21, 2023; source).

Figure 3b: Changes in the U.S. Drought Monitor for Texas between January 24, 2023, and February 21, 2023 (source).
The North American Drought Monitor, which runs a month behind, shows drought over much of the western United States and Mexico (Figure 4a). Precipitation over much of the Rio Grande watershed in Colorado and New Mexico over the last 90 days was lower than normal, and missed out on major precipitation events in the northeastern part of Colorado (Figure 4b).
Conservation storage in Elephant Butte Reservoir—an important source of water for the El Paso area—increased to 14.3% full from 12.5% four weeks ago (Figure 4c), slightly above historic (since 1990) lows.
The Rio Conchos basin in Mexico, which confluences with the Rio Grande just above Presidio and is the largest tributary to the Lower Rio Grande, is abnormally dry (Figure 4a). Combined conservation storage in the Amistad and Falcon reservoirs decreased slightly from 32.1% four weeks ago to 30.6% full today, about 28 percentage points below normal for this time of year and below the lowest low for this time of year recorded since 1990 (Figure 4d).

Figure 4a: The North American Drought Monitor for January 31, 2022 (source).

Figure 4b: Percent of normal precipitation for Colorado and New Mexico for the 90 days before February 26, 2023 (modified from source). The red line is the Rio Grande Basin. I use this map to see check precipitation trends in the headwaters of the Rio Grande in southern Colorado, the main source of water to Elephant Butte Reservoir downstream.

Figure 4c: Reservoir storage in Elephant Butte Reservoir since 2021 with the median, min, and max for measurements from 1990 through 2022 (graph from Texas Water Development Board).

Figure 4d: Reservoir storage in Amistad and Falcon reservoirs since 2021 with the median, min, and max for measurements from 1990 through 2022 (graph from Texas Water Development Board).
Basins across the state continue to have flows over the past week below historical 25th, 10th, and 5th flow percentiles (Figure 5a). Statewide reservoir storage is at 75.2% full as of February 26, up about 1.2 million acre-feet from 71.5% four weeks ago and about ten percentage points below normal for this time of year (Figure 5b).
A number of reservoirs in the eastern part of the state have recovered to more than 90% ful,l with just a few less than 90% full (Figure 5c). The reservoir marked in yellow northeast of Dallas (between 60 and 70% full) is accurately but perhaps unfairly yellow since it, Bois D’Arc Lake, is a newborn and just started its initial inundation last year (Figure 5c). Choke Canyon Reservoir is down to 30.6% full, part of its recent (since 2015) seesawing (Figure 5d).

Figure 5a: Parts of the state with below-25th-percentile seven-day average streamflow as of February 25, 2023 (map modified from U.S. Geological Survey).

Figure 5b: Statewide reservoir storage since 2021 compared to statistics (median, min, and max) for statewide storage from 1990 through 2022 (graph from Texas Water Development Board).

Figure 5c: Reservoir storage as of February 26, 2023, in the major reservoirs of the state (modified from Texas Water Development Board).

Figure 5d: Hydrograph Of The Month—Reservoir storage for Choke Canyon Reservoir (graph from Texas Water Development Board).
Sea-surface temperatures in the Central Pacific that, in part, define the status of the El Niño Southern Oscillation, continue to reside in La Niña conditions but now with warming temperatures toward neutral conditions (Figure 6a). This month’s expert (consolidated) projection is considerably warmer than last month’s and suggests that neutral conditions may develop over the next couple of months (Figure 6a). We remain under a La Niña Advisory, but La Nada is expected to develop soon and remain through spring and early summer.
Sea-surface temperature projections show a continuation of La Niña with an 85% chance of neutral conditions for the February to April season and a 95% chance of neutral conditions for the March to May season (Figure 6b). The expert (consolidated) projection (released in December) suggests neutral conditions for the Summer-Fall (Figure 6a), while the official probabilities (released this month) favor El Niño conditions (Figure 6b).

Figure 6a. Forecasts of sea-surface temperature anomalies for the Niño 3.4 Region as of January 19, 2023 (modified from Climate Prediction Center and others). “Range of model predictions -1” is the range of the various statistical and dynamical models’ projections minus the most outlying upper and lower projections. Sometimes those predictive models get a little craycray.

Figure 6b. Probabilistic forecasts of El Niño, La Niña, and La Nada (neutral) conditions (graph from Climate Prediction Center and others).
The U.S. Seasonal Drought Outlook through May 2023 shows drought persisting and developing over much of the western two-thirds of the state (Figure 7a). Like a broken record, the three-month temperature outlook projects warmer-than-normal conditions for all of the state (Figure 7b), while the three-month precipitation outlook favors drier-than-normal conditions for the westernmost part of the state (Figure 7c).

Figure 7a: The U.S. Seasonal Drought Outlook for February 16, 2023, through May 31, 2023 (source).

Figure 7b: Three-month temperature outlook for March-April-May 2023 (source).

Figure 7c: Three-month precipitation outlook for March-April-May 2023 (source).