SUMMARY:
- El Niño is here and is expected to stay with us through the year.
- Less than a quarter of the state remains in drought.
- Reservoirs are now 77.2% full but still 7 to 8% below normal.
I wrote this article on June 23 and 24, 2023.
It’s already turning out to be an active tropical season in the Atlantic, with three named storms so far and one, Cindy, developing into a hurricane. Three storms in June (so far) ties the record for the most storms in June. And for the first time, two storms (Bret and Cindy) were active at the same time in June.
I’ve mentioned in earlier posts that El Niños tend to suppress tropical storm development in the Atlantic due to wind shear but that an average season was expected this year due to high temperatures in the Atlantic. Not only are those temperatures high, they are off the charts.
Worldwide, ocean temperatures hit a new record high on April 1st (not a joke) and have stayed in the warmest-on-record territory since. Much of the Atlantic, including almost all of the northern Atlantic, is considerably warmer than the 1971 to 2000 baseline (Figure 1a). Temperatures in the Northern Atlantic are considerably warmer, about one degree Celsius (1.8 degrees Fahrenheit), than in the past, and a full step out from past history (Figure 1b).
Climate change is part of the reason for these record high ocean temps (warmer planet, warmer ocean), but a lack of Saharan dust and the quick switcheroo from La Niña to El Niño conditions also plays a part in a perfect heat storm in the Atlantic. Given these unprecedented temperatures, we’ll see what they mean for our weather. But more heat equals more evaporation and more energy in the atmosphere, so that could mean more tropical systems than normal (or at least compared to a normal El Niño year).
Accordingly, Colorado State University has revised its Atlantic hurricane season outlook from a fewer-than-normal season to a normal season, anticipating that high sea-surface temps will counteract El Niño’s typical suppressive winds.

Figure 1a: Observed sea surface temperature anomaly compared to 1970 to 2000 (from Climate Reanalyzer, units in Celsius).

Figure 1b: Observed sea surface temperature in the North Atlantic (from Climate Reanalyzer).
Over the past 30 days, the Panhandle, northeast Texas, and random splotches elsewhere saw more than 5 inches of rain (Figure 2a). These same areas saw three to four times the usual amount of precipitation, with Pecos, Terrel, and Brewster counties in West Texas and Starr County in the Lower Rio Grande Valley also seeing three to four times normal rainfall (Figure 2b). Most of the state has seen rain over the past 90 days meeting or surpassing normal conditions, but north-central Texas is still 25 to 50% below normal and much of Far West Texas is less than 50% of normal, with some areas less than 25% of normal (Figure 2c).

Figure 2a: Inches of precipitation that fell in Texas 30 days before June 23, 2023 (modified from the National Weather Service). Note that cooler colors indicate lower values and warmer indicate higher values. Light grey is no detectable precipitation.

Figure 2b: Rainfall as a percent of normal for the 30 days before June 23, 2023 (modified from the National Weather Service).

Figure 2c: Rainfall as a percent of normal for the 90 days before June 23, 2023 (modified from the National Weather Service).
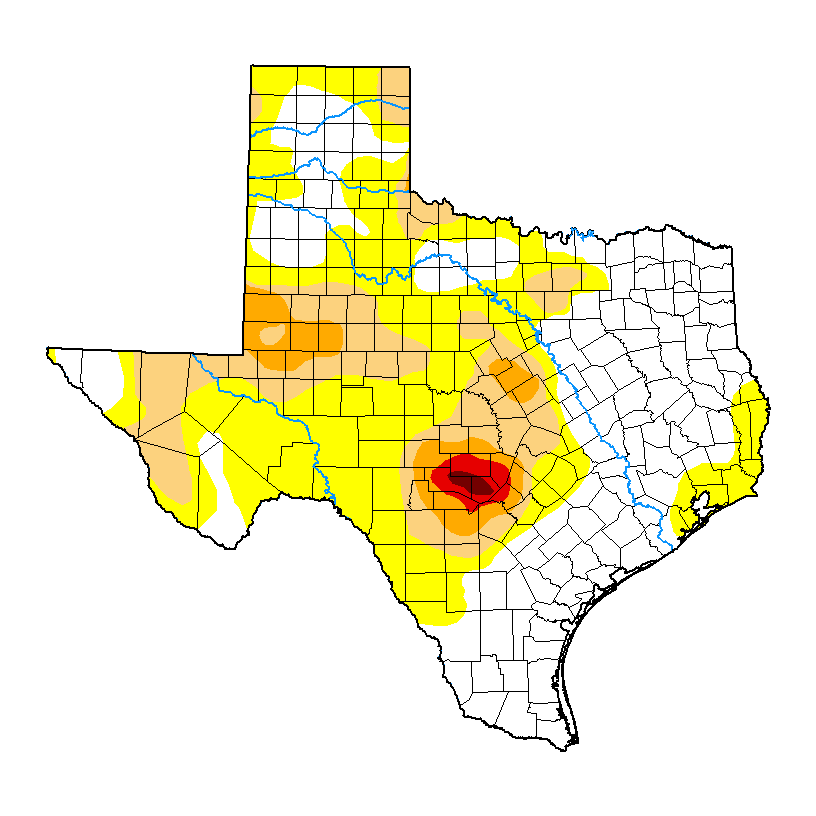
The amount of the state under drought conditions (D1–D4) dropped considerably from four weeks ago at 42% to 23% this week (Figure 3a) with drought intensity decreasing substantially in the Panhandle region (Figure 3b). Despite those welcome improvements, drought expanded and deepened in several areas across the state (Figure 3b). Extreme drought or worse has decreased from 9% of the state four weeks ago to 1.4%, with exceptional drought decreasing from 0.5% to 0.3% (Figure 3a). In all, 58% of the state remains abnormally dry or worse (D0–D4; Figure 3a), down a wee bit from 61% four weeks ago.

Figure 3a: Drought conditions in Texas according to the U.S. Drought Monitor (as of June 20, 2023; from the U.S. Drought Monitor).

Figure 3b: Changes in the U.S. Drought Monitor for Texas between May 23, 2023, and June 23, 2023 (from the U.S. Drought Monitor).
The North American Drought Monitor, which runs a month behind, shows drought focused over the Great Plains and much of central to southern Mexico (Figure 4a). Precipitation over much of the Rio Grande watershed in Colorado and New Mexico over the last 90 days was lower than normal, but there were small areas with normal to above normal precipitation (Figure 4b).
Conservation storage in Elephant Butte Reservoir—an important source of water for the El Paso area—increased to 28.8% full from 26.2% four weeks ago (Figure 4c), now a nudge above median storage since 1990.
The Rio Conchos basin in Mexico, which confluences with the Rio Grande just above Presidio and is the largest tributary to the Lower Rio Grande, is now mostly out of drought (Figure 4a). Combined conservation storage in the Amistad and Falcon reservoirs increased slightly to 30.5% full from 30.2% four weeks ago, still about 30 percentage points below normal for this time of year but now above record lows and recent years (Figure 4d

Figure 4a: The North American Drought Monitor for May 31, 2023 (from the U.S. Drought Monitor).

Figure 4b: Percent of normal precipitation for Colorado and New Mexico for the 90 days before June 23, 2023 (modified from the National Weather Service). The red line is the Rio Grande Basin. I use this map to see check precipitation trends in the headwaters of the Rio Grande in southern Colorado, the main source of water to Elephant Butte Reservoir downstream.

Figure 4c: Reservoir storage in Elephant Butte Reservoir since 2021 with the median, min, and max for measurements from 1990 through 2022 (graph from Texas Water Development Board).

Figure 4d: Reservoir storage in Amistad and Falcon reservoirs since 2021 with the median, min, and max for measurements from 1990 through 2022 (graph from Texas Water Development Board).
Basins across the state continue to have flows over the past week below historical 25th, 10th, and 5th flow percentiles (Figure 5a). Statewide reservoir storage is at 77.2% full, up about 130 thousand acre-feet from 76.8% four weeks ago and about 7 to 8 percentage points below normal for this time of year (Figure 5b). Most reservoirs in the eastern part of the state are more than 90% full, with just a few less than 90% full (Figure 5c). The reservoir marked in light blue northeast of Dallas (between 70 and 80% full) is accurately but perhaps unfairly that color since it, Bois D’Arc Lake, is a relative newborn and just started its initial inundation last year (Figure 5c).
The reservoir marked in red in the Dallas-Fort Worth (the raspberry in a sea of blueberries) is New Terrell City Lake and has dropped from full in early March to about 25% today (Figure 5c). I couldn’t discern the cause, but I suspect it’s for work on the reservoir and/or dam.
My (drumroll please) “Hydrograph of the Month” is Lake Meredith due to its remarkable 20 percentage point leap in storage to nearly half full, a level it hasn’t been at in more than 20 years (Figure 5d).

Figure 5a: Parts of the state with below-25th-percentile seven-day average streamflow as of June 22, 2023 (map modified from U.S. Geological Survey).

Figure 5b: Statewide reservoir storage since 2021 compared to statistics (median, min, and max) for statewide storage from 1990 through 2022 (graph from Texas Water Development Board).

Figure 5c: Reservoir storage as of June 23, 2023, in the major reservoirs of the state (modified from Texas Water Development Board).

Figure 5d: Hydrograph of the month—Reservoir storage for Lake Meredith (graph from Texas Water Development Board).
Sea-surface temperatures in the Central Pacific that, in part, define the status of the El Niño Southern Oscillation reside in neutral conditions. However, this graph is about a month behind reality (Figure 6a). On June 8, the Climate Prediction Center declared that we’ve formally entered El Niño conditions which are expected to strengthen into the winter months. The graph shows what appears to be a return to neutral conditions, but I think this is more of a reflection of expert uncertainty than anything (Figure 6a). However, the official probabilities, a month newer than the projections, give El Niño conditions more than a 90% chance throughout the year and into the beginning of next year (Figure 6b).

Figure 6a. Forecasts of sea-surface temperature anomalies for the Niño 3.4 Region as of May 19, 2023 (modified from Climate Prediction Center and others). “Range of model predictions -1” is the range of the various statistical and dynamical models’ projections minus the most outlying upper and lower projections. Sometimes those predictive models get a little craycray.

Figure 6b. Probabilistic forecasts of El Niño, La Niña, and La Nada (neutral) conditions (graph from Climate Prediction Center and others).
The U.S. Seasonal Drought Outlook through August 2023 shows a blotchy persistence of drought, some development in Central Texas, and a few spots of removal and improvement (Figure 7a). Like a wind-up doll, the three-month temperature outlook projects warmer-than-normal conditions for the entire state (Figure 7b), while the three-month precipitation outlook favors wetter-than-normal conditions in north and northeast Texas (Figure 7c).

Figure 7a: The U.S. Seasonal Drought Outlook for June 15, 2023, through September 30, 2023 (from NOAA).

Figure 7b: Three-month temperature outlook for July-August-September 2023 (from the National Weather Service).

Figure 7c: Three-month precipitation outlook for July-August-September 2023 (from the National Weather Service).