SUMMARY:
- The amount of the state under drought conditions (D1–D4) increased slightly from five weeks ago at 79% to 81% this week.
- The seasonal projection suggests wetter-than-normal conditions are on the way!
- The odds of a Super El Niño look slim, but the odds of a strong El Nino are at 71%.
I wrote this article on September 29, 2023.
With three years of La Niñas, there’s some chatter out there of a possible Super El Niño with an emphasis on “possible.” A weasel-worded article titled “One of the most intense El Niños ever observed could be forming,” published by the Washington Post, posits that we could see the second-strongest El Niño on record this winter along with all the associated mayhem. However, the article is littered with words and phrases like could, experimental, maybe, and might. Given that there is always hedging on these things, the issue isn’t might; it’s the probability of the event occurring.
The Climate Prediction Center and partners publish a monthly report on the El Niño Southern Oscillation, assessing the current status and future likelihood of El Niño, La Niña, and neutral (La Nada) conditions. Accordingly, they quantify the likelihood. For example, in their recent release, they project a 71% chance of a strong El Niño developing (defined as a sea-surface temperature anomaly greater than or equal to 1.5° Celsius). A strong El Niño is not a Super El Niño, the latter of which isn’t scientifically quantified. Previous “Super El Niños” in ~1983, ~1997, and ~2015 reached (or almost reached) 2.5° Celsius of warming. Is that where we’re headed?
The El Niño Southern Oscillation outlooks include three lines with a spaghetti of different numerical and statistical models (Figure 1a). The three lines are (1) the mid-point of the dynamical (numerical) models, (2) the mid-point of the statistical models, and (3) the CPC Consolidated projection, a projection informed by human experts (as opposed to feline experts which, quite frankly, don’t give a damn).
The Humans project a moderate El Niño (thick blue line) while The Robots (technically the average robot) favor a 2.0° Celsius peak (the thick purple line; Figure 1a). The Robots as a whole favor a much warmer El Niño than the statistical models, while The Humans seem to trust the statistical models more than The Robots (cue Terminator). Several of The Robots project temperatures near or above 2.5° Celsius at the aforementioned Super El Niño levels.
Is it possible that we will see a Super El Niño? The short answer is “Yes.” Anything is possible (and we have seen them in the past). Is it likely? No. If I’m wrong, please force me to eat a Birds-Aren’t-Real crow. You can bring the salt.

Figure 1a: Forecasts of sea-surface temperature anomalies for the Niño 3.4 Region as of August 19, 2023 (from Climate Prediction Center and others).

Figure 1b. Forecasts of sea-surface temperature anomalies for the Niño 3.4 Region as of August 19, 2023 (modified from Climate Prediction Center and others). “Range of model predictions -1” is the range of the various statistical and dynamical models’ projections minus the most outlying upper and lower projections. Sometimes those predictive models get a little craycray.
We’ve had some storms and (slightly) cooler weather march down from the north into the center of the state, dropping more than 2 inches of rainfall from the east to the west (Figure 2a). However, Far West and South-Central Texas didn’t benefit much, receiving less than half an inch (Figure 2a). Except for the heart of the Edwards Plateau and a few lucky devils in the Panhandle, most of the state received less than normal rainfall over the past 30 days (Figure 2b). Most of the state has gotten less than normal rainfall over the past 90 days (Figure 2c).

Figure 2a: Inches of precipitation that fell in Texas in the 30 days before September 29, 2023 (modified from NOAA). Note that cooler colors indicate lower values, and warmer indicate higher values. Light grey is no detectable precipitation.

Figure 2b: Rainfall as a percent of normal for the 30 days before September 29, 2023 (modified from NOAA).

Figure 2c: Rainfall as a percent of normal for the 90 days before September 29, 2023 (modified from NOAA).
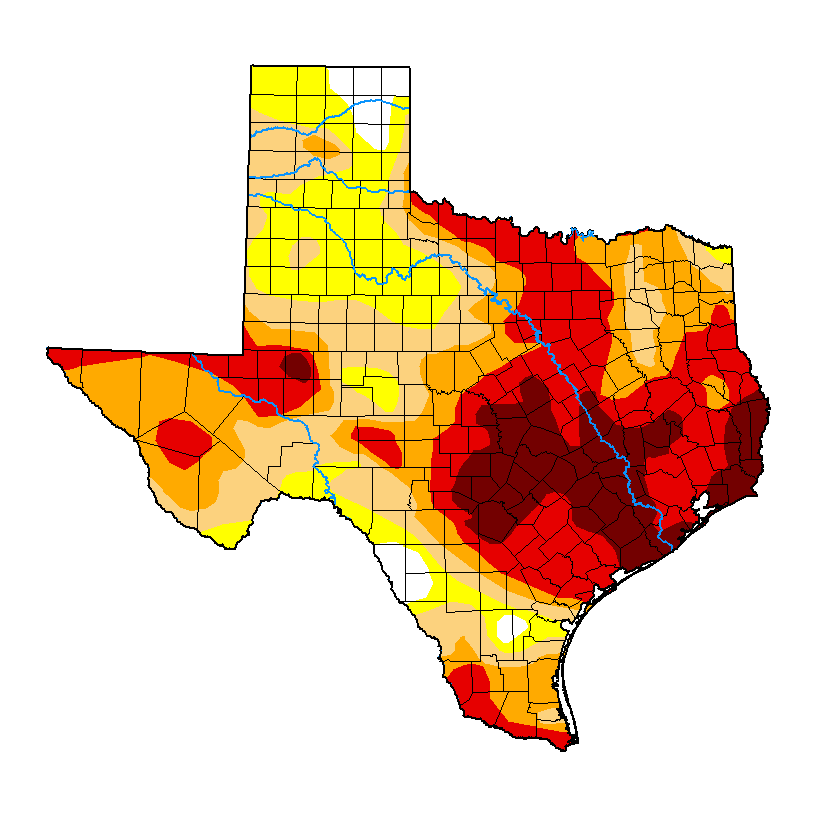
The amount of the state under drought conditions (D1–D4) increased slightly from five weeks ago at 79% to 81% this week (Figure 3a), with drought intensifying and ebbing across the state (Figure 3b). Extreme drought or worse increased from 34% of the state five weeks ago to 36%, with exceptional drought increasing from 11.7% to 12.7% (Figure 3a). In all, 96% of the state is abnormally dry or worse (D0–D4; Figure 3a), the same as five weeks ago.

Figure 3a: Drought conditions in Texas according to the U.S. Drought Monitor (as of September 29, 2023; U.S. Drought Monitor).

Figure 3b: Changes in the U.S. Drought Monitor for Texas between August 22, 2023, and September 29, 2023 (U.S. Drought Monitor).
The North American Drought Monitor, which runs a month behind, shows drought over much of the American Mid-West and the Pacific Northwest, with the drought in Texas extending into Mexico (Figure 4a). Precipitation over much of the Rio Grande watershed in Colorado and New Mexico over the last 90 days was lower than normal, with small areas with normal to above-normal precipitation (Figure 4b).
Conservation storage in Elephant Butte Reservoir—an important source of water for the El Paso area—decreased to 17.7% full from 19.8% four weeks ago (Figure 4c), a nudge above median storage since 1990.
The Rio Conchos Basin in Mexico, which confluences with the Rio Grande just above Presidio and is the largest tributary to the Lower Rio Grande, is in moderate to severe drought (Figure 4a). Combined conservation storage in the Amistad and Falcon reservoirs decreased to 22.4% full from 24.2% five weeks ago, about 30 percentage points below normal for this time of year and the lowest in the past 30 years (Figure 4d).

Figure 4a: The North American Drought Monitor for August 31, 2023 (North American Drought Monitor).

Figure 4b: Percent of normal precipitation for Colorado and New Mexico for the 90 days before September 29, 2023 (modified from NOAA). The red line is the Rio Grande Basin. I use this map to check precipitation trends in the headwaters of the Rio Grande in southern Colorado, the main source of water to Elephant Butte Reservoir downstream.

Figure 4c: Reservoir storage in Elephant Butte Reservoir since 2021 with the median, min, and max for measurements from 1990 through 2022 (graph from Texas Water Development Board).

Figure 4d: Reservoir storage in Amistad and Falcon reservoirs since 2021 with the median, min, and max for measurements from 1990 through 2022 (graph from Texas Water Development Board).
Basins across the state continue to have flows over the past week below historical 25th, 10th, and 5th flow percentiles (Figure 5a). Statewide reservoir storage is at 66.0% full, down about 1.1 million acre-feet from 69.6% four weeks ago and about 10 percentage points below normal for this time of year (Figure 5b). Reservoirs in the eastern part of the state range from 70 to more than 90% full (Figure 5c).
The reservoir marked red in Dallas-Fort Worth (the raspberry in a sea of blueberries) is New Terrell City Lake and has dropped from full in early March to about 18% today (Figure 5c). I wasn’t able to discern the cause, but I suspect it’s for work on the reservoir and/or dam.
My (drumroll please) Hydrograph of the Month is Canyon Lake due to its lower levels during the drought (Figure 5d). Its current level (65.4% full) is the lowest since initial inundation in the 1970s.

Figure 5a: Parts of the state with below-25th-percentile seven-day average streamflow as of September 28, 2023 (map modified from U.S. Geological Survey).

Figure 5b: Statewide reservoir storage since 2021 compared to statistics (median, min, and max) for statewide storage from 1990 through 2022 (graph from Texas Water Development Board).

Figure 5c: Reservoir storage as of September 29, 2023, in the major reservoirs of the state (modified from Texas Water Development Board).

Figure 5d: Hydrograph Of The Month—Reservoir storage for Canyon Lake (graph from Texas Water Development Board).
Sea-surface temperatures in the Central Pacific that, in part, define the status of the El Niño Southern Oscillation reside in El Niño conditions (Figure 6a). The graph shows El Niño conditions continuing with a return to neutral conditions in the new year. This month’s projection is a little warmer than last month’s. The official probabilities, a month newer than the projections in the graph, give El Niño conditions more than a 95% chance of extending through the winter but with growing odds of neutral conditions in the spring (Figure 6b).
Figure 6a. Forecasts of sea-surface temperature anomalies for the Niño 3.4 Region as of August 19, 2023 (modified from Climate Prediction Center and others). “Range of model predictions -1” is the range of the various statistical and dynamical models’ projections minus the most outlying upper and lower projections. Sometimes, those predictive models get a little craycray.

Figure 6b. Probabilistic forecasts of El Niño, La Niña, and La Nada (neutral) conditions (graph from Climate Prediction Center and others).
The U.S. Seasonal Drought Outlook through December 2023 projects drought persistence but with overall improvement (Figure 7a).
Like a feral hog infestation, the three-month temperature outlook projects warmer-than-normal conditions for much of the state (Figure 7b), while the three-month precipitation outlook favors wetter-than-normal conditions for the vast majority of the state (Figure 7c).

Figure 7a: The U.S. Seasonal Drought Outlook for September 21, 2023, through December 31, 2023 (NOAA).

Figure 7b: Three-month temperature outlook for October-November-December 2023 (NOAA).

Figure 7c: Three-month precipitation outlook for October-November-December 2023 (NOAA).