SUMMARY:
- The amount of the state under drought conditions (D1–D4) decreased from four weeks ago at 81% to 75% this week (with more improvements on the way).
- The winter projection shows normal temperatures and wetter-than-normal conditions for Texas, but drought conditions are expected to persist.
I wrote this article on October 26, 2023.
The National Oceanic and Atmospheric Administration released its winter outlook for the United States, and it shows near-normal temperatures (Figure 1a) and wetter-than-normal conditions (Figure 1b) for Texas. Although wetter-than-normal conditions look promising and the U.S. Seasonal Drought Outlook through January projects drought improvements, drought is expected to remain like an unwanted holiday houseguest.
If you prefer the olden ways, the Farmers Almanac predicts a wet and mild winter for all of Texas except for Far West Texas, where they predict a cold and snowy winter. Sadly, I could not find a persimmon seed prediction for Texas, but the Persimmon Lady of North Carolina projects a mild start to winter with several bouts of icy weather.
Depending on when this column gets published, you will have experienced (or are fixin’ to experience) our first icy cold front of the season. Winter is coming!

Figure 1a: Three-month temperature outlook for December-January-February 2023-2024 (NOAA).

Figure 1b: Three-month precipitation outlook for December-January-February 2023-2024 (NOAA).
Over the past month, we’ve had some storms drop more than two inches of rain over much of the state, with large blotches of five or more inches (Figure 2a). However, large parts of Far West Texas and the Panhandle received less than 0.5 inches (Figure 2a). Except for the central heart of the state, most of the state received less than normal rainfall over the past 30 days (Figure 2b). Most of the state has gotten less than normal rainfall over the past 90 days (Figure 2c).

Figure 2a: Inches of precipitation that fell in Texas in the 30 days before October 26, 2023 (modified from NOAA). Note that cooler colors indicate lower values, and warmer indicate higher values. Light grey is no detectable precipitation.

Figure 2b: Rainfall as a percent of normal for the 30 days before October 26, 2023 (modified from NOAA).

Figure 2c: Rainfall as a percent of normal for the 90 days before October 26, 2023 (modified from NOAA).
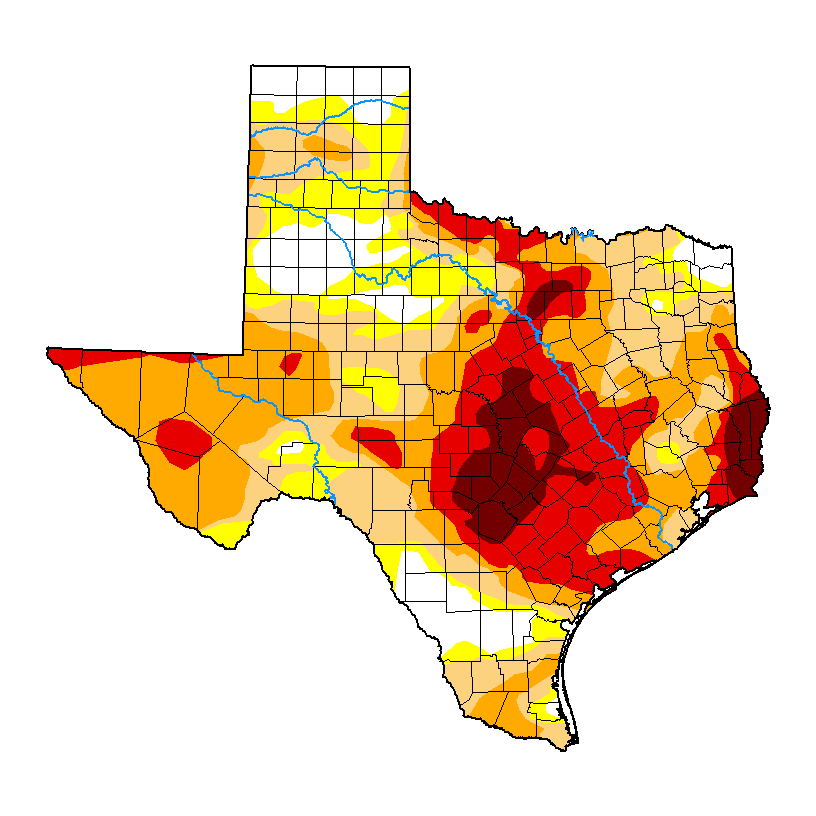
The amount of the state under drought conditions (D1–D4) decreased from four weeks ago at 81% to 75% this week (Figure 3a), with drought intensifying but mostly ebbing across the state (Figure 3b). Extreme Drought or worse decreased from 36% of the state five weeks ago to 25%, with exceptional drought decreasing from 12.7% to 6.8% (Figure 3a). In all, 89% of the state is abnormally dry or worse (D0–D4; Figure 3a), down from 96% four weeks ago.

Figure 3a: Drought conditions in Texas according to the U.S. Drought Monitor (as of October 26, 2023; U.S. Drought Monitor).

Figure 3b: Changes in the U.S. Drought Monitor for Texas between September 26, 2023, and October 24, 2023 (U.S. Drought Monitor).
The North American Drought Monitor, which runs a month behind, shows drought over much of the American Mid-West and the Pacific Northwest, with the drought in Texas extending down into Mexico and up through the Midwest and into Canada (Figure 4a). Precipitation over much of the Rio Grande watershed in Colorado and New Mexico over the last 90 days was lower than normal in small areas, with normal to above normal precipitation (Figure 4b).
Conservation storage in Elephant Butte Reservoir—an important source of water for the El Paso area—decreased to 16.9% full from 17.7% four weeks ago (Figure 4c), a nudge above median storage since 1990.
The Rio Conchos basin in Mexico, which confluences with the Rio Grande just above Presidio and is the largest tributary to the Lower Rio Grande, is now in severe to extreme drought (Figure 4a). Combined conservation storage in the Amistad and Falcon reservoirs decreased to 20.9% full from 22.4% five weeks ago, about 35 percentage points below normal for this time of year and the lowest in the past 30 years (Figure 4d).

Figure 4a: The North American Drought Monitor for September 30, 2023 (North American Drought Monitor).

Figure 4b: Percent of normal precipitation for Colorado and New Mexico for the 90 days before October 26, 2023 (modified from NOAA). The red line is the Rio Grande Basin. I use this map to check precipitation trends in the headwaters of the Rio Grande in southern Colorado, the main source of water to Elephant Butte Reservoir downstream.

Figure 4c: Reservoir storage in Elephant Butte Reservoir since 2021 with the median, min, and max for measurements from 1990 through 2022 (graph from Texas Water Development Board).

Figure 4d: Reservoir storage in Amistad and Falcon reservoirs since 2021 with the median, min, and max for measurements from 1990 through 2022 (graph from Texas Water Development Board).
Basins across the state continue to host flows over the past week below historical 25th, 10th, and 5th percentiles (Figure 5a). Statewide reservoir storage is at 65.0% full, down about 315,000 acre-feet from 66.0% four weeks ago and about 15 percentage points below normal for this time of year (Figure 5b). Reservoirs in the eastern part of the state range from 70 to more than 90% full (Figure 5c).
The reservoir marked in red in the Dallas-Fort Worth area (the raspberry in a sea of blueberries) is New Terrell City Lake and has dropped from full in early March to about 18% today (Figure 5c). I couldn’t discern the cause, but I suspect it’s for work on the reservoir and/or dam.
My (drumroll please) “Hydrograph of the Month” is Canyon Lake again due to its lowering levels during the drought (Figure 5d). Its current level (63.4% full) is the lowest since initial inundation in the 1960s.

Figure 5a: Parts of the state with below-25th-percentile seven-day average streamflow as of October 26, 2023 (map modified from U.S. Geological Survey).

Figure 5b: Statewide reservoir storage since 2021 compared to statistics (median, min, and max) for statewide storage from 1990 through 2022 (graph from Texas Water Development Board).

Figure 5c: Reservoir storage as of October 26, 2023, in the major reservoirs of the state (modified from Texas Water Development Board).

Figure 5d: Hydrograph of the Month—Reservoir storage for Canyon Lake (graph from Texas Water Development Board).
Sea-surface temperatures in the Central Pacific that, in part, define the status of the El Niño Southern Oscillation, reside in El Niño conditions (Figure 6a). The graph shows El Niño conditions continuing with a return to neutral conditions toward the middle of next year. This month’s projection is about the same as last month’s. The official probabilities, a month newer than the projections in the graph, give El Niño conditions a 100% chance of extending through January but with growing odds of neutral conditions in late spring/early summer (Figure 6b).

Figure 6a. Forecasts of sea-surface temperature anomalies for the Niño 3.4 Region as of August 19, 2023 (modified from Climate Prediction Center and others). “Range of model predictions -1” is the range of the various statistical and dynamical models’ projections minus the most outlying upper and lower projections. Sometimes, those predictive models get a little craycray.

Figure 6b. Probabilistic forecasts of El Niño, La Niña, and La Nada (neutral) conditions (graph from Climate Prediction Center and others).
The U.S. Seasonal Drought Outlook through January 2024 projects drought persistence but with overall improvement (Figure 7a).
Like the long burn from a ghost pepper, the three-month temperature outlook projects normal temperatures for much of the state (Figure 7b), while the three-month precipitation outlook favors wetter-than-normal conditions for the vast majority of the state (Figure 7c).

Figure 7a: The U.S. Seasonal Drought Outlook for October 19, 2023, through December 31, 2023 (NOAA).

Figure 7b: Three-month temperature outlook for November-December-January 2023-2024 (NOAA).

Figure 7c: Three-month precipitation outlook for November-December-January 2023-2024 (NOAA).