SUMMARY:
- The amount of the state under drought conditions (D1–D4) decreased from five weeks ago at 39% to 23% this week, with drought improvements across much of the state.
- El Niño conditions have a 90% chance of extending through the February-March-April season, giving way to neutral conditions in April-May-June and greater odds of La Niña conditions in the fall.
- Last year was the warmest on record for Texas, a full 3.5 °F warmer than the long-term.
I wrote this article on February 4, 2024.
How about a year in review?
Indeed, last year was the warmest on record in Texas, with the average temp clocking in at 67.9 °F, a full 3.5 °F (1.9 °C) warmer than the long-term (1895 through 2023) average (Figure 1a). Last year continued the ongoing upward swing in temperatures in Texas since about 1975. Similarly, last year was the warmest on record for the planet, in an upward trend that started about 1975 (Figure 1b).
Last year was the third warmest in Austin, tied 2012 for the warmest in Dallas; tied 2018 for the third warmest in El Paso; was the second warmest in Houston, was the second warmest in Lubbock, the warmest in San Antonio; and second warmest in Wichita Falls.
Statewide precipitation was below normal for the second year in a row (Figure 1c). The annual statewide Palmer Drought Severity Index shows that last year was the fifth in a row of overall drought conditions in the state (Figure 1d).

Figure 1a: Twelve-month (January through December) average temperatures in Texas from 1895 through 2023 (data from here).

Figure 1b: Twelve-month (January through December) average temperatures for the globe from 1895 through 2023 (data from here).

Figure 1c: Twelve-month (January through December) precipitation in Texas from 1895 through 2023 (data from here).

Figure 1d: Twelve-month (January through December) Palmer Drought Severity Index in Texas from 1895 through 2023 (data from here).
Over the past month, we’ve had BIG RAIN (10 to 15 inches) fall in the east with little rain (less than half an inch) fall in the west (Figure 2a). The BIG-RAINers got three, four, five, and even six times normal rainfall over the past month, while the little-rainers got half to a quarter or even less than a tenth of normal (Figure 2b). Over the past 90 days, about half the state has received more than normal rainfall while the other half has gotten less than normal rain (Figure 2c).

Figure 2a: Inches of precipitation that fell in Texas in the 30 days before February 4, 2024 (modified from source). Note that cooler colors indicate lower values and warmer indicate higher values. Light grey is no detectable precipitation.

Figure 2b: Rainfall as a percent of normal for the 30 days before February 4, 2024 (modified from source).

Figure 2c: Rainfall as a percent of normal for the 90 days before February 4, 2024 (modified from source).
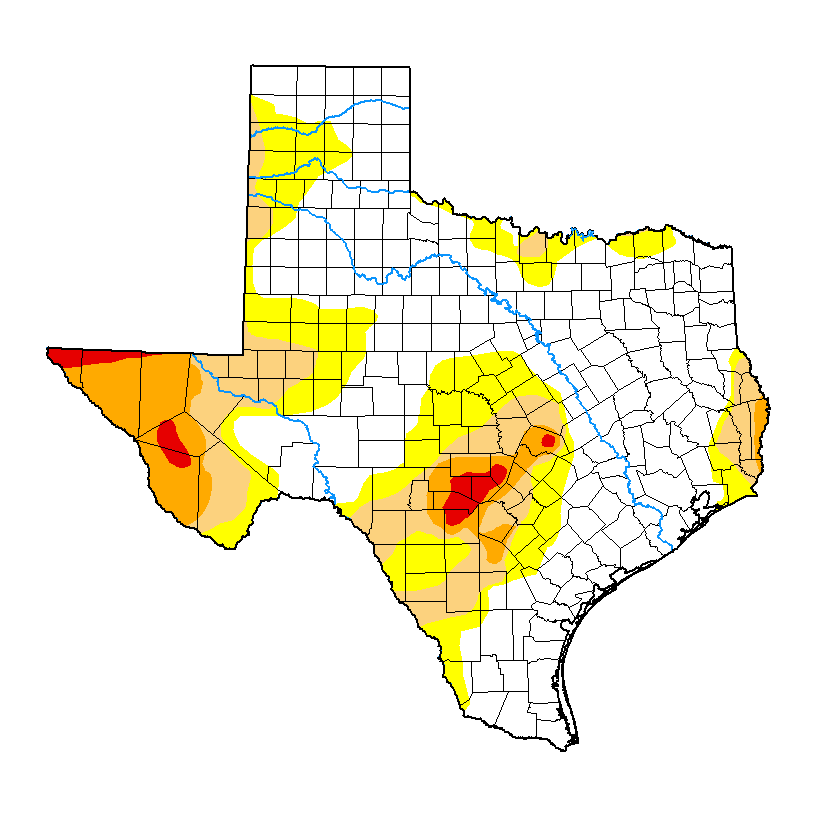
The amount of the state under drought conditions (D1–D4) decreased from five weeks ago at 39% to 23% this week (Figure 3a), with drought improvements across much of the state (Figure 3b). Extreme drought, or worse, decreased from 6% of the state five weeks ago to 2%, with exceptional drought decreasing from 0.7% to none (Figure 3a). In all, 43% of the state is abnormally dry or worse (D0–D4; Figure 3a), down from 60% five weeks ago.

Figure 3a: Drought conditions in Texas according to the U.S. Drought Monitor (as of January 30, 2024; source).

Figure 3b: Changes in the U.S. Drought Monitor for Texas between January 2, 2024, and January 30, 2024 (source).
The North American Drought Monitor, which runs a month behind current conditions, shows drought all around Texas (Figure 4a). Precipitation over much of the Rio Grande watershed in Colorado and New Mexico over the last 90 days was lower than normal, with above-normal rainfall along the river in New Mexico (Figure 4b).
Conservation storage in Elephant Butte Reservoir—an important source of water for the El Paso area—increased to 25.1% full from 23.3% five weeks ago (Figure 4c), slightly above median storage since 1990.
The Rio Conchos basin in Mexico, which confluences with the Rio Grande just above Presidio and hosts the largest tributary to the Lower Rio Grande, is now in Extreme to Exceptional drought (Figure 4a). Combined conservation storage in the Amistad and Falcon reservoirs decreased to 21.8% full from 22.0% five weeks ago, almost 40 percentage points below normal for this time of year (since 1990) and the lowest in at least the past 33 years (Figure 4d).

Figure 4a: The North American Drought Monitor for December 31, 2023 (source).

Figure 4b: Percent of normal precipitation for Colorado and New Mexico 90 days before February 4, 2024 (modified from source). The red line is the Rio Grande Basin. I use this map to check precipitation trends in the headwaters of the Rio Grande in southern Colorado, the main source of water to Elephant Butte Reservoir downstream.

Figure 4c: Reservoir storage in Elephant Butte Reservoir since 2022 with the median, min, and max for measurements from 1990 through 2023 (graph from Texas Water Development Board).

Figure 4d: Reservoir storage in Amistad and Falcon reservoirs since 2021 with the median, min, and max for measurements from 1990 through 2022 (graph from Texas Water Development Board).
Basins across the state continue to host flows over the past week below historical 25th, 10th, and 5th percentiles (Figure 5a). Statewide reservoir storage is at 73.3% full, up about 1.4 million acre-feet from 68.9% full five weeks ago and about eight percentage points below normal for this time of year since 1990 (Figure 5b). Recent rains have topped off most of the reservoirs in the eastern part of the state, which are now more than 90% full (Figure 5c).
The reservoir marked in red in the Dallas-Fort Worth area (the raspberry in a sea of blueberries) is New Terrell City Lake and has dropped from full in early March (Figure 5c). I wasn’t able to discern the cause, but I suspect it’s for maintenance on the reservoir and/or dam.
My (drumroll please) “Hydrograph of the Month” is Lake Travis, due to it missing the rainfall party just to the east of its catchment (Figure 5d).

Figure 5a: Parts of the state with below-25th-percentile seven-day average streamflow as of February 3, 2024 (map modified from U.S. Geological Survey).

Figure 5b: Statewide reservoir storage since 2022 compared to statistics (median, min, and max) for statewide storage from 1990 through 2023 (graph from Texas Water Development Board).

Figure 5c: Reservoir storage as of February 4, 2024, in the major reservoirs of the state (modified from Texas Water Development Board).

Figure 5d: Hydrograph of the Month—Reservoir storage for Lake Travis (graph from Texas Water Development Board).
Sea-surface temperatures in the Central Pacific that, in part, define the status of the weather phenomenon known as the El Niño Southern Oscillation strongly reside in El Niño conditions (Figure 6a). Projections suggest El Niño conditions continuing with a return to neutral conditions in the March-April-May season. This month’s projection is lower than last month’s, suggesting an earlier ending to El Niño. The official probabilities, a month newer than the projections in the graph, give El Niño conditions a 90% chance of extending through the February-March-April season, giving way to favoring neutral conditions in April-May-June and greater odds of La Niña conditions forming in the fall (Figure 6b).

Figure 6a. Forecasts of sea-surface temperature anomalies for the Niño 3.4 Region as of December 19, 2023 (modified from Climate Prediction Center and others). “Range of model predictions -1” is the range of the various statistical and dynamical models’ projections minus the most outlying upper and lower projections. Sometimes, those predictive models get a little cray-cray.

Figure 6b. Probabilistic forecasts of El Niño, La Niña, and La Nada (neutral) conditions (graph from Climate Prediction Center and others).
The U.S. Seasonal Drought Outlook through March projects drought persistence in Far West Texas and drought improvement and removal in the Hill Country (Figure 7a).
The three-month temperature outlook projects near-normal temperatures for much of the state except cooler-than-normal temps in West Texas (Figure 7b), while the three-month precipitation outlook favors wetter-than-normal conditions for the eastern half of the state (Figure 7c).

Figure 7a: The U.S. Seasonal Drought Outlook for February 1, 2024, through April 30, 2024 (source).

Figure 7b: Three-month temperature outlook for January-February-March 2024 (source).

Figure 7b: Three-month temperature outlook for February-March-April 2024 (source).