SUMMARY:
- The amount of the state under drought conditions (D1–D4) remained the same as four weeks ago at 23%.
- El Niño has a 100% chance of extending through the February-March-April season, giving way to neutral conditions in April-May-June and greater odds of La Niña developing in the summer.
- Drought is expected to expand across the Edwards Plateau and down the Rio Grande Valley.
I wrote this article on March 1, 2024.
“Just like that, almost overnight, it went from being Februaugust to Marchuary here in Central Texas.” -John Karges
And now we are back to Marchtember! We are in the season of swings where one day it’s blazing and the next it’s not. While some of us might find temperature swings exhilarating (as I do!), it’s not all good news. The Smokehouse Creek Fire in the Texas Panhandle quickly became the largest wildfire in Texas history, burning more than a million acres, after the Marchuary cold front roared through. While it might seem unusual to have a fire in February, it’s pretty typical in the Panhandle, where hard freezes create the tinder and the open plains racetrack high winds that can push flames across the Staked Plains.
Overall, there’s been remarkedly little change from last month to this month regarding drought and water conditions. The eastern part of the state, pretty much defined by I-35, has done well this winter, while the western part has not so much. And the prognosis for a wet spring seems to be drying up. The maps below show drier-than-normal conditions in the western part of the state in March and the ensuing seasons through May, June, and July. The maps that extend beyond March-April-May are considered “experimental” and thus may not be reliable. Still, they are scientifically-based tea leaves for how conditions may lean in the distant future. With La Niña conditions expected in the fall and reports of a worried-looking State Climatologist, a dry spring will likely cause some nail-biting through the year and into the next for the western part of the state.

Figure 1a: Precipitation outlook for March (map from here).

Figure 1b: Precipitation outlook for March-April-May (map from here).

Figure 1c: Precipitation outlook for April-May-June (map from here).

Figure 1d: Precipitation outlook for May-June-July (map from here).
Over the past month, we’ve had the usual mo-rain in the east and lo-rain in the west (Figure 2a). Scattered parts of the state received greater-than-average rainfall, while most of the state received less-than-normal rainfall over the past 30 days (Figure 2b). The last 90 days have been a story of haves and have-nots, with the Panhandle and the south-eastern central parts of the state seeing much greater-than-normal precipitation while the rest of the state has seen far less than normal amounts (Figure 2c).

Figure 2a: Inches of precipitation that fell in Texas 30 days before March 1, 2024 (modified from source). Note that cooler colors indicate lower values, and warmer indicate higher values. Light grey is no detectable precipitation.

Figure 2b: Rainfall as a percent of normal for the 30 days before March 1, 2024 (modified from source).

Figure 2c: Rainfall as a percent of normal for the 90 days before March 1, 2024 (modified from source).
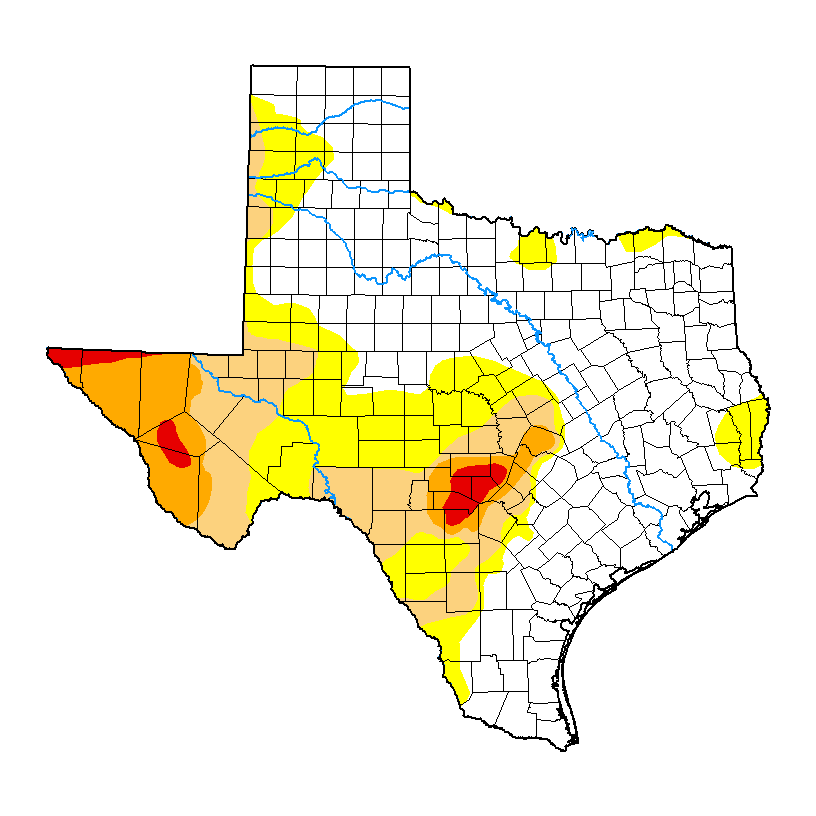
The amount of the state under drought conditions (D1–D4) stayed the same as four weeks ago at 23% (Figure 3a), with drought improvements and developments across the state (Figure 3b). Extreme drought, or worse, stayed the same as four weeks ago at 2% of the state, with exceptional drought remaining at 0% (Figure 3a). In all, 43% of the state is abnormally dry or worse (D0–D4; Figure 3a), the same as four weeks ago.

Figure 3a: Drought conditions in Texas according to the U.S. Drought Monitor (as of February 27, 2024; source).

Figure 3b: Changes in the U.S. Drought Monitor for Texas between February 27, 2024, and January 30, 2024 (source).
The North American Drought Monitor, which runs a month behind current conditions, shows drought in New Mexico, Mexico, and Louisiana (Figure 4a). Parts of the Rio Grande watershed in Colorado and New Mexico shows higher-than-normal rainfall over the last 90 days (Figure 4b).
Conservation storage in Elephant Butte Reservoir—an important source of water for the El Paso area—stayed at 25.1% from five weeks ago (Figure 4c), slightly below median storage since 1990.
The Rio Conchos basin in Mexico, which confluences with the Rio Grande just above Presidio and hosts the largest tributary to the Lower Rio Grande, remains in Extreme to Exceptional drought (Figure 4a). Combined conservation storage in the Amistad and Falcon reservoirs increased to 21.9% full from 21.8% five weeks ago, almost 40 percentage points below normal for this time of year (since 1990) and the lowest in at least the past 33 years (Figure 4d).

Figure 4a: The North American Drought Monitor for January 31, 2023 (source).

Figure 4b: Percent of normal precipitation for Colorado and New Mexico for the 90 days before March 1, 2024 (modified from source). The red line is the Rio Grande Basin. I use this map to check precipitation trends in the headwaters of the Rio Grande in southern Colorado, the main water source to Elephant Butte Reservoir downstream.

Figure 4c: Reservoir storage in Elephant Butte Reservoir since 2022 with the median, min, and max for measurements from 1990 through 2023 (graph from Texas Water Development Board).

Figure 4d: Reservoir storage in Amistad and Falcon reservoirs since 2022 with the median, min, and max for measurements from 1990 through 2023 (graph from Texas Water Development Board).
Basins across the state continue to host flows over the past week below historical 25th, 10th, and 5th percentiles (Figure 5a). Statewide reservoir storage is at 73.4% full, up about 32,000 acre-feet from 73.3% five weeks ago and about 10 percentage points below normal for this time of year since 1990 (Figure 5b). Recent rains have not topped up most of the reservoirs in the central part of the state (Figure 5c).
The reservoir marked in red in the Dallas-Fort Worth area (the raspberry in a sea of blueberries) is New Terrell City Lake, which dropped from full in early March (Figure 5c). I couldn’t discern the cause, but I suspect it’s for maintenance on the reservoir and/or dam.
My (drumroll please) “Hydrograph of the Month” is Stillhouse Hollow Lake due to its lowest levels since at least 1990 (Figure 5d).

Figure 5a: Parts of the state with below-25th-percentile seven-day average streamflow as of March 1, 2024 (map modified from U.S. Geological Survey).

Figure 5b: Statewide reservoir storage since 2022 compared to statistics (median, min, and max) for statewide storage from 1990 through 2023 (graph from Texas Water Development Board).

Figure 5c: Reservoir storage as of March 1, 2024, in the state’s major reservoirs (modified from Texas Water Development Board).

Figure 5d: Hydrograph of the Month—Reservoir storage for Stillhouse Hollow Lake (graph from Texas Water Development Board).
Sea-surface temperatures in the Central Pacific that, in part, define the status of the weather phenomenon known as the El Niño Southern Oscillation, strongly remain in El Niño conditions (Figure 6a). Projections suggest El Niño conditions continuing with a return to neutral conditions in the March-April-May season. This month’s projection is lower than last month’s, suggesting an earlier ending to El Niño and the development of La Niña conditions in late summer (Figure 6a). The official probabilities, a month newer than the projections in the graph, give El Niño conditions a 100% chance of extending through the February-March-April season, giving way to favoring neutral conditions in April-May-June and greater odds of La Niña conditions forming in the fall (Figure 6b). Accordingly, the Climate Prediction Center has issued a La Niña Watch for the summer.

Figure 6a. Forecasts of sea-surface temperature anomalies for the Niño 3.4 Region as of January 19, 2023 (modified from Climate Prediction Center and others). “Range of model predictions -1” is the range of the various statistical and dynamical models’ projections minus the most outlying upper and lower projections. Sometimes, those predictive models get a little craycray.

Figure 6b. Probabilistic forecasts of El Niño, La Niña, and La Nada (neutral) conditions (graph from Climate Prediction Center and others).
The U.S. Seasonal Drought Outlook through March projects drought persistence in Far West Texas and parts of the Edwards Plateau and drought development over the rest of the Edwards Plateau and down the Rio Grande Valley (Figure 7a).
The three-month temperature outlook projects near-normal temperatures for the state (Figure 7b), while the three-month precipitation outlook favors wetter-than-normal conditions for the most eastern sliver of the state and drier-than-normal conditions for Far West Texas (Figure 7c).

Figure 7a: The U.S. Seasonal Drought Outlook for March 1, 2024, through May 31, 2024 (source).

Figure 7b: Three-month temperature outlook for March-April-May 2024 (source).

Figure 7c: Three-month precipitation outlook for March-April-May 2024 (source).