SUMMARY:
-
Bomb Cyclone Ulmer brought Texas record low pressures for the Panhandle and wind gusts of more than 100 mph.
-
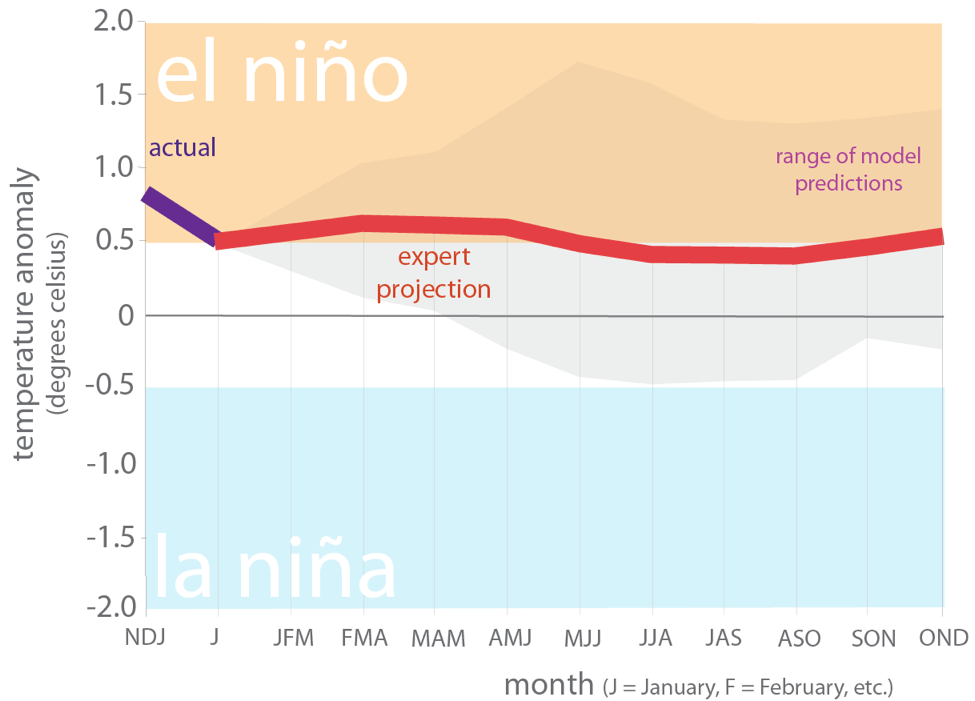
El Niño is still with us with sea surface temperatures projected to flirt with El Niño conditions for the rest of the year.
-
Ulmer dropped some much-needed snow over the Rio Grande headwaters in Colorado.
The bomb cyclone that swept across the continental United States the week of March 10th—named Ulmer by the Weather Channel—was notable for several reasons. First, it underwent bombogenesis (rapid intensification over 24 hours) that resulted in the lowest pressures ever measured in parts of the Central Plains, including much of the Texas Panhandle. The resulting system produced fierce thunderstorms and peak wind gusts of 109 mph in Grand Prairie, 104 mph in San Augustin Pass, and 103 mph in Pine Springs. Here in Austin we had a week where we started with below-freezing temperatures and ended with record highs in the mid-80s (but thankfully no scary winds).
Ahhhh: Texas!
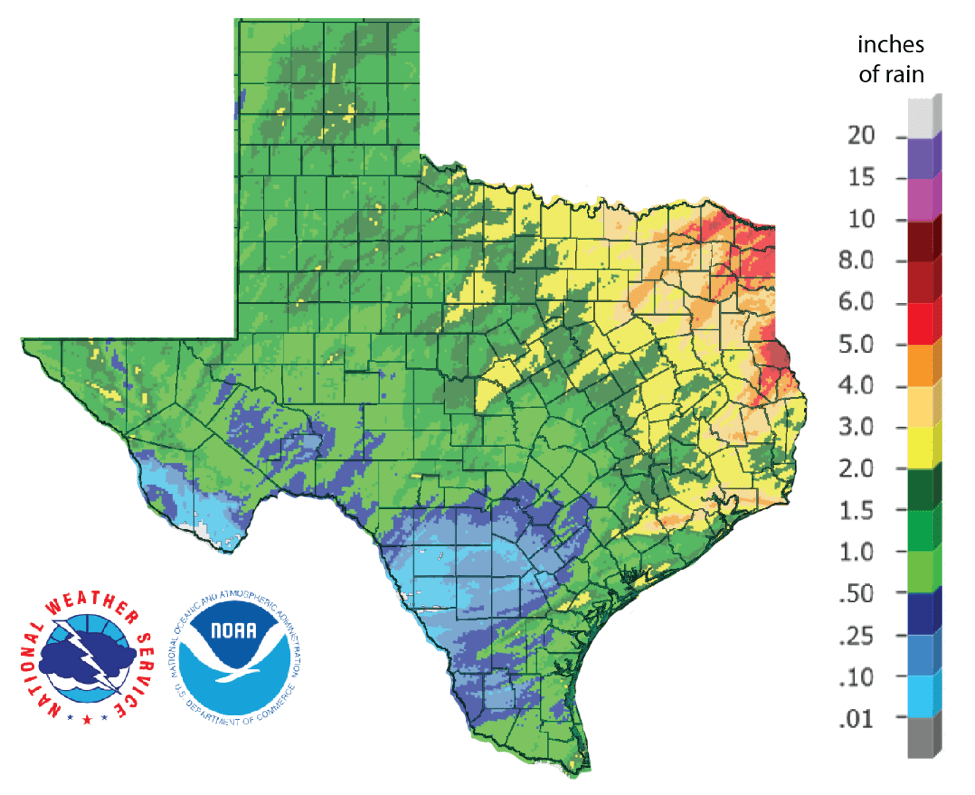
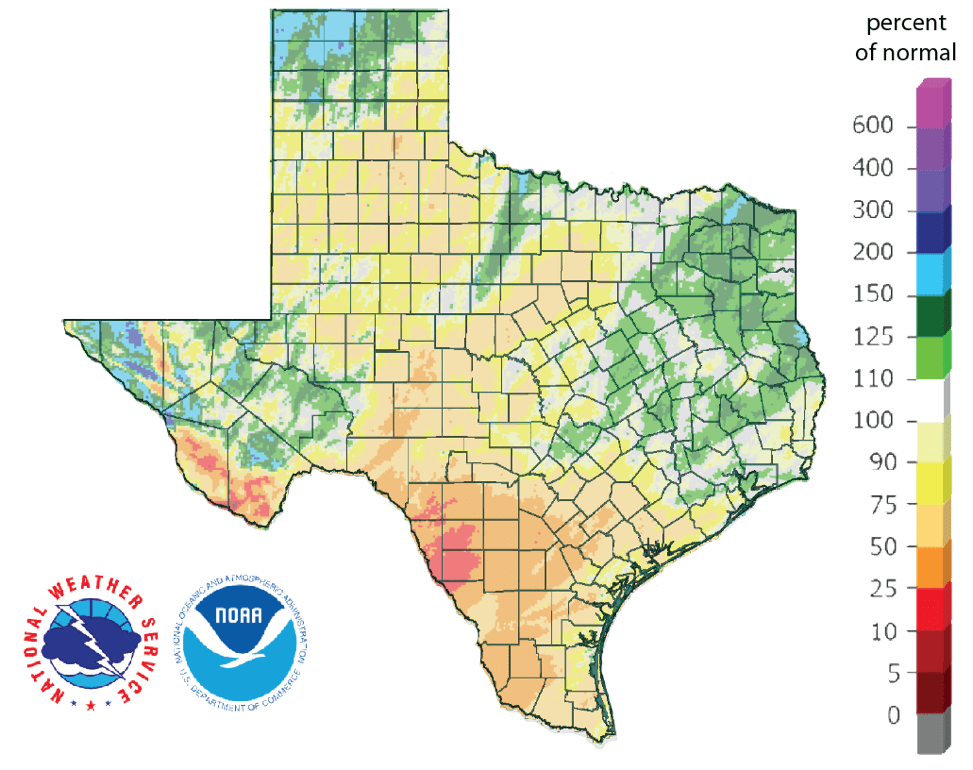
Although the storm dumped as much as 52 inches of snow in Colorado, much of Texas received below normal precipitation over the past 30 days, especially in south-central Texas (Figure 1). Much of the High Plains received more than an inch of rain—25 to 50 percent more than normal, and Far West Texas received similar amounts—upwards of four times normal (Figure 1).
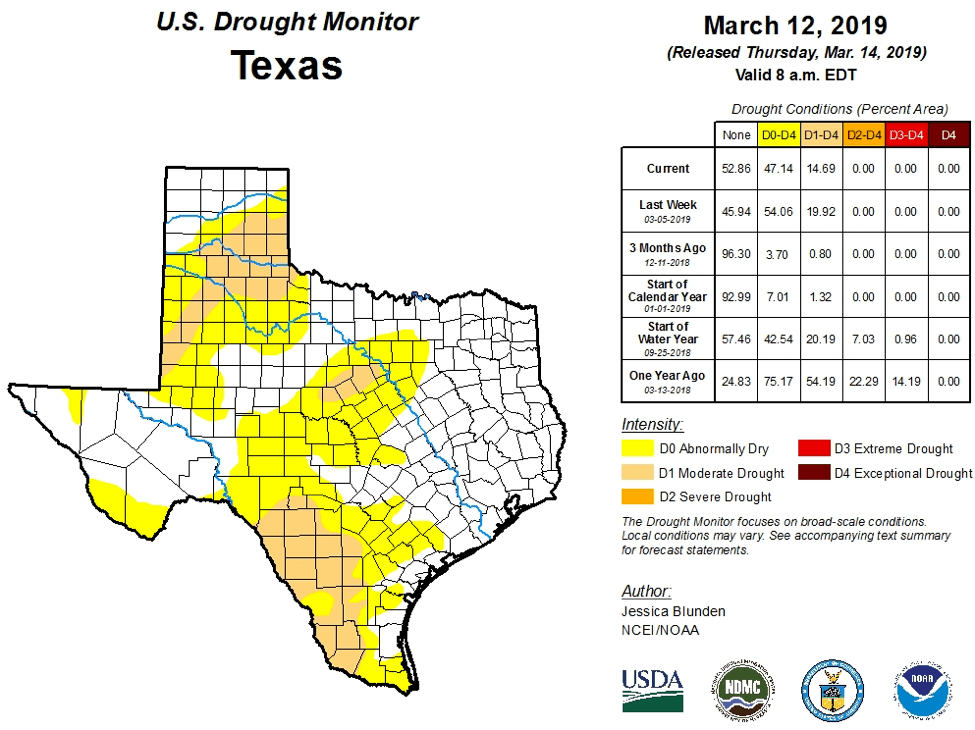
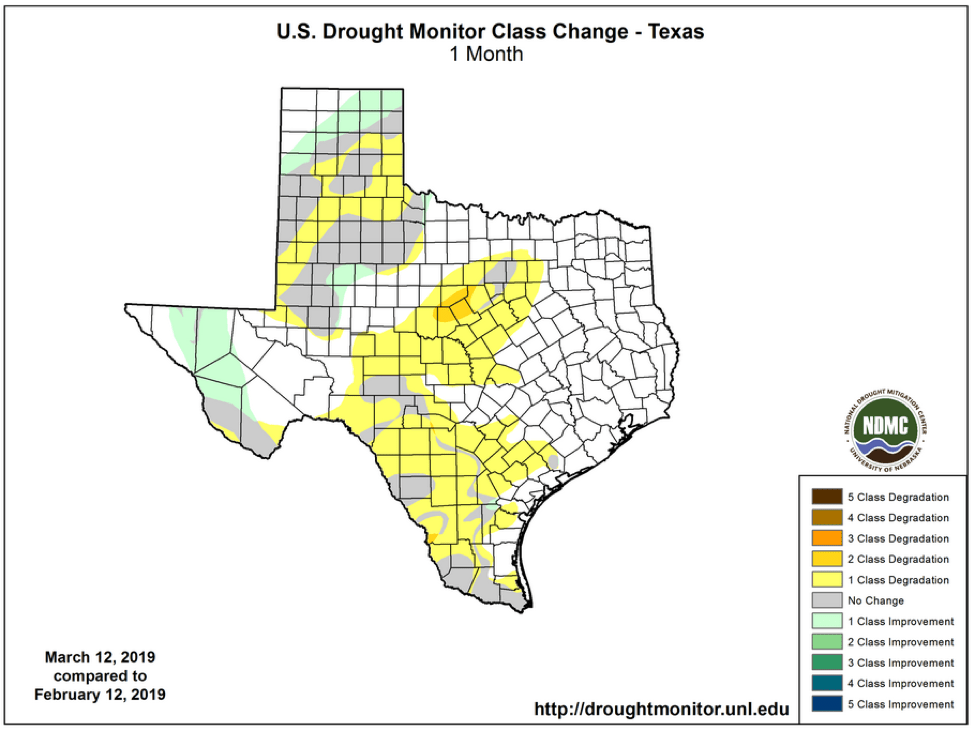
The amount of drought in Texas (D1-D4) over the past month increased from 3.1 to 14.7 percent with patches of moderate drought appearing in the Panhandle, the north-central Cross Timbers, South Texas, and the Lower Rio Grande Valley (Figure 2a). Abnormally dry conditions or worse expanded across west and south Texas from 35 percent a month ago to 47 percent (Figure 2b).
The 90-day precipitation as a percent of normal map is showing deficits in large parts of the state in the High Plains south of Amarillo, the Big Bend area, all of the Rio Grande Valley and south Texas, and much of central and north-central Texas (Figure 3).
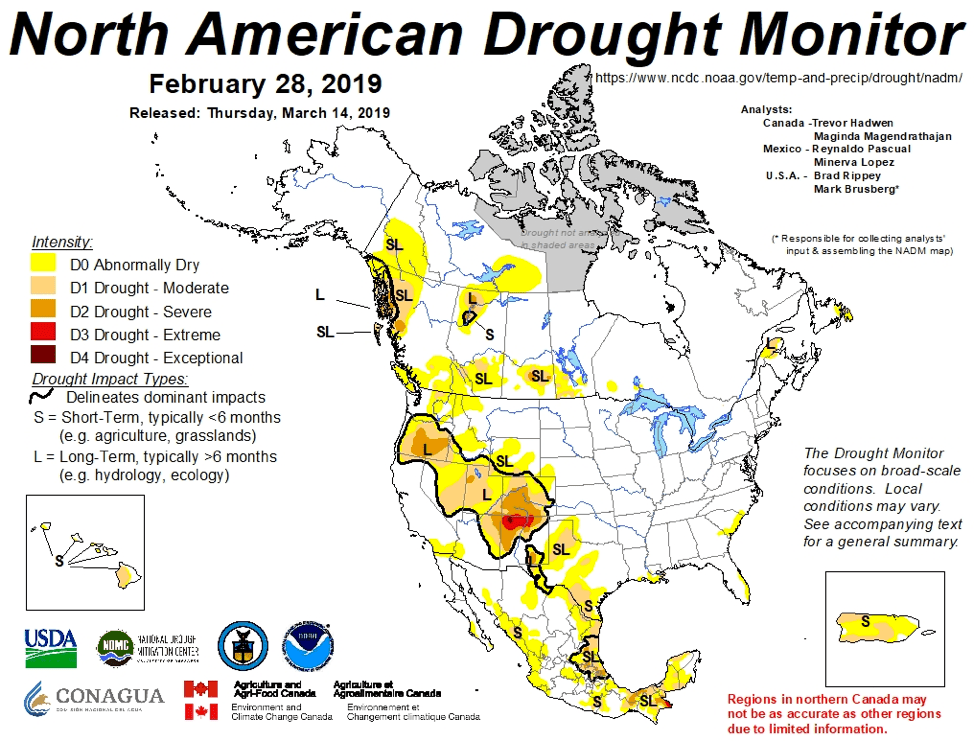
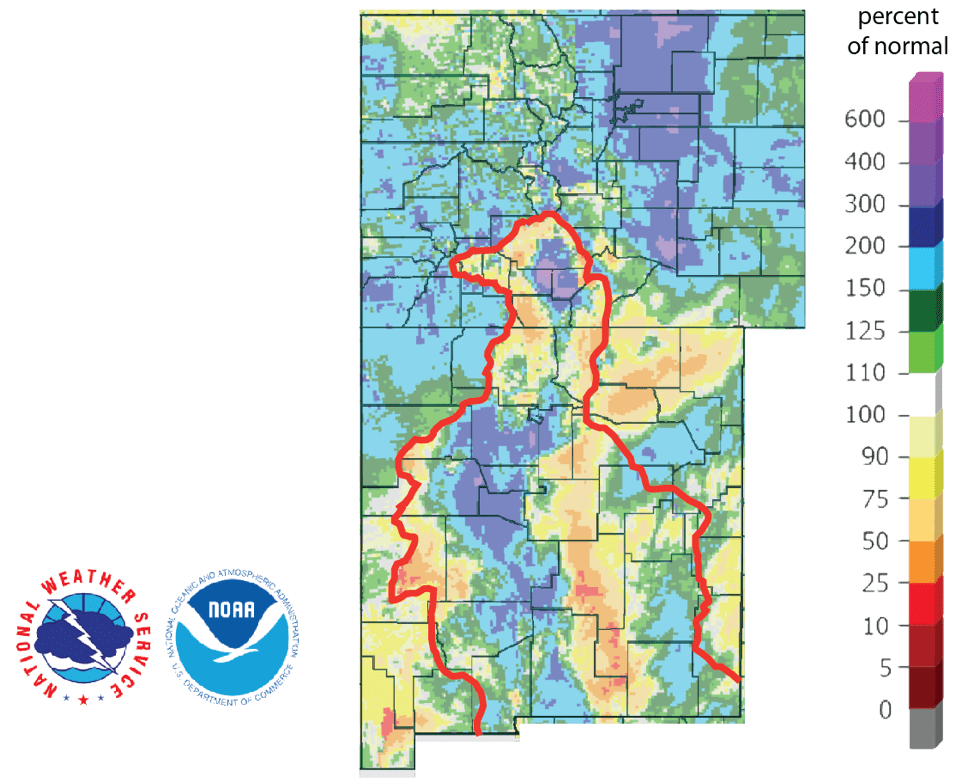
The North American Drought Monitor for the end of February shows extreme to exceptional drought in the headwaters of the Rio Grande, which doesn’t bode well for reservoir levels in Elephant Butte (Figure 4a), but has improved over last month. Percent of normal precipitation in the Rio Grande watershed in Colorado, the primary source of water for Elephant Butte Reservoir, over the last 90 days shows considerable improvement from last month thanks to the bomb cyclone (Figure 4b).
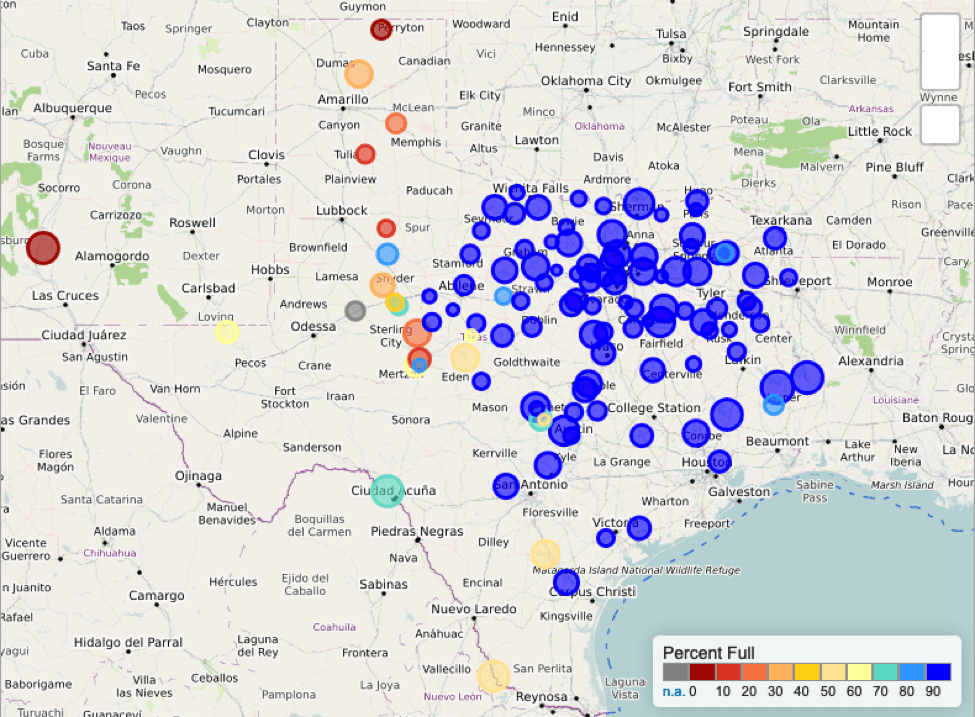
Statewide reservoir storage has been about 90 percent full since mid-November and is about 5 percentage points above normal for this time of year (Figure 5a). Percent full status for individual reservoirs this month (Figure 5b) is about the same as last month with Elephant Butte Reservoir peaking above 10 percent full (Figure 5c) for the first time since last July.


We are still under an El Niño Advisory with an ~80 percent chance of weak El Niño conditions continuing through the spring and ~60 percent chance through the summer (Figure 6). El Niños generally result in wetter-than-normal and cooler-than-normal conditions for Texas and act as a tropical storm suppressor.
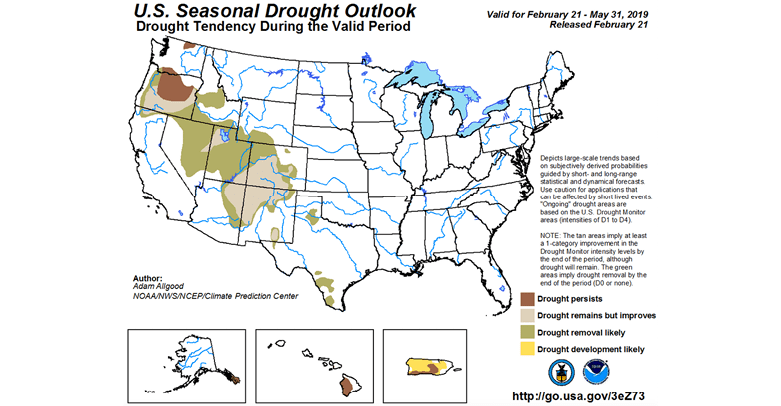
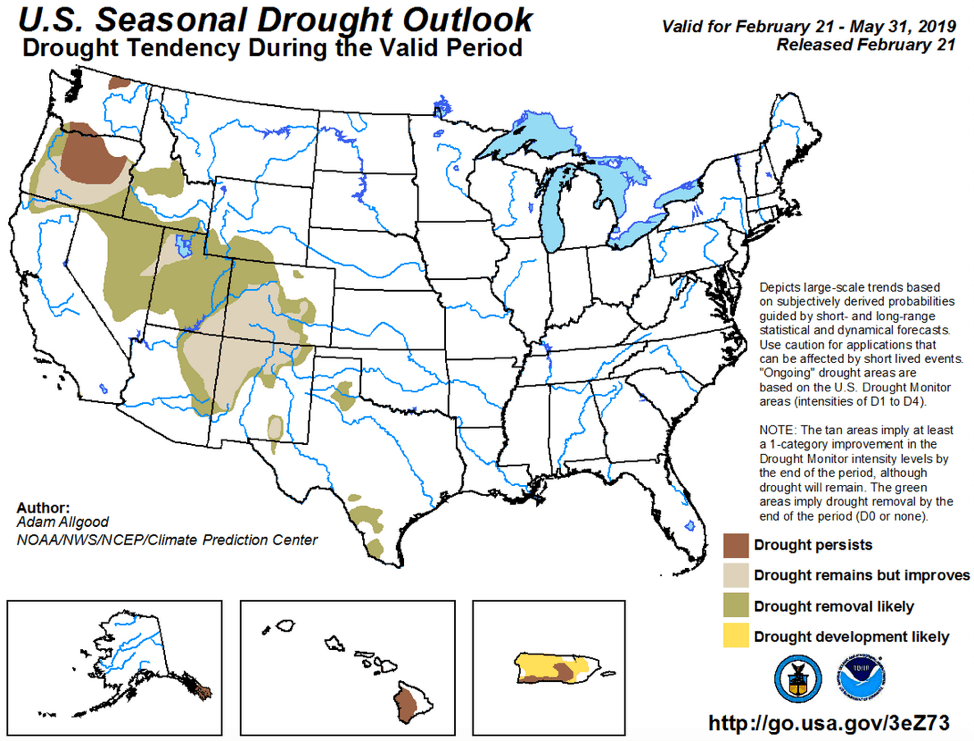
The U.S. Seasonal Drought Outlook through May 31, 2019, suggests drought improvements in southern Colorado, something that would be welcome for Elephant Butte Reservoir, and drought removal for Texas (Figure 7).
Author

Robert Mace,
Deputy Executive Director & Chief Water Policy Officer at The Meadows Center for Water and the Environment
Robert Mace is a Professor of Practice in the Department of Geography at Texas State University. Robert has over 30 years of experience in hydrology, hydrogeology, stakeholder processes, and water policy, mostly in Texas.
Professor Mace,
Love this website!
I have spent a good bit of time studying special purpose districts of Texas, in general, those related to water and specifically the Water Control District, the MUD and Freshwater Supply District.
My goal is to reform the process that allows these unique creatures of ostensibly local government to be created by a Legislator when the Legislature is in session. I know that idea won’t get any traction in Houston, but it could in Kendall County. Where Rep. Biedermann and Sen. Campbell have a common constituency that is not happy with their recent proliferation in a PGMA with a long history of water problems.
In my research, i have collected material from the print media, Realtors, Universities/Colleges, TCEQ, the Comptroller of Texas, PUC of Texas. and of the Water Development Board.
Can you recommend other sources? Can you you recommend any people I could be talking to?
Thanks.
Milan