SUMMARY:
-
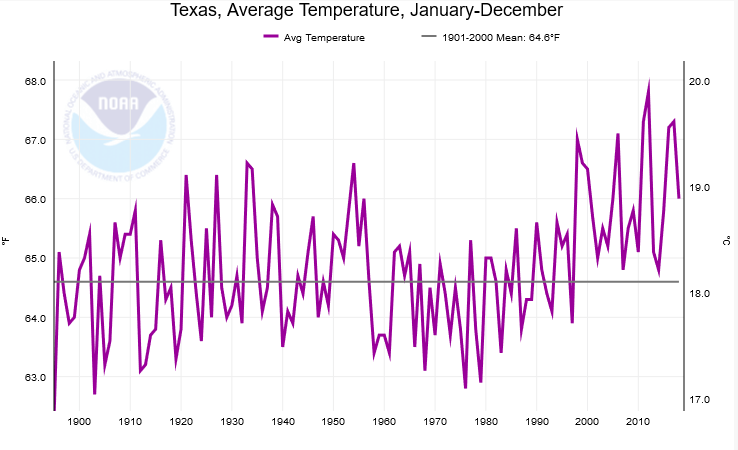
Four of the last eight years have been warmer than the Dust Bowl.
-
The rains appear to have stopped for much of the state.
-
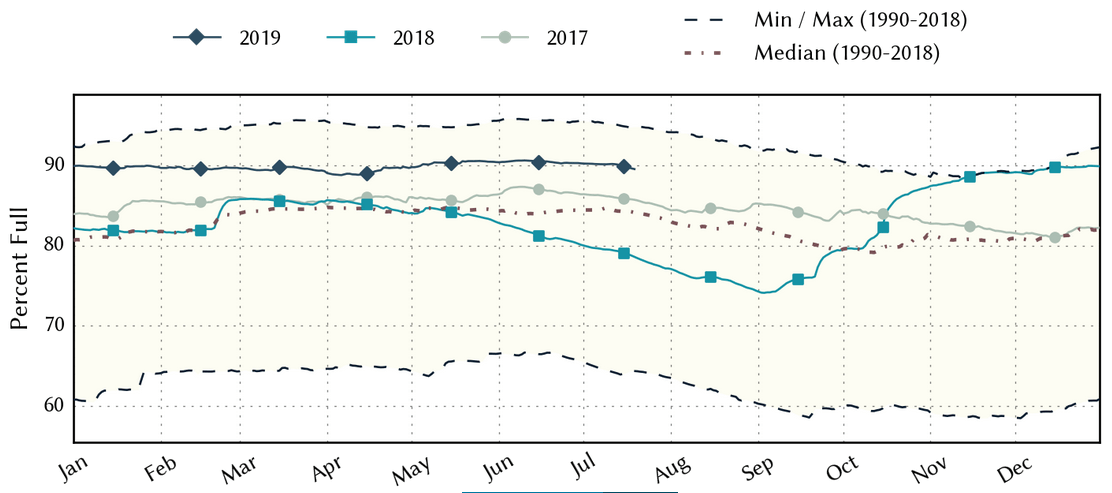
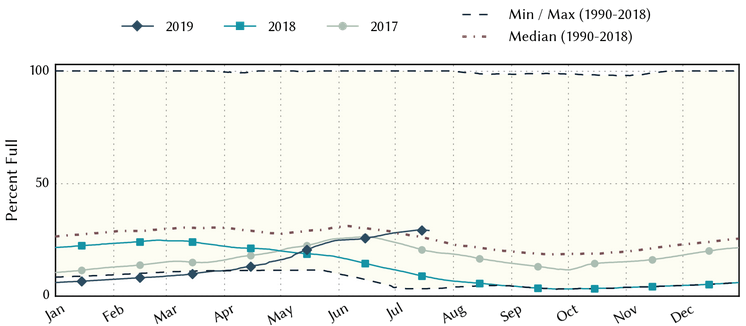
Storage in Elephant Butte Reservoir is the highest it’s been since June 2010.
-
El Niño is expected to fizzle into La Nada over the next two months with La Nada conditions projected through the winter.
-
The drought in South Texas and the Lower Rio Grande is expected to persist and expand.
With record rainfall since the beginning of the year, the continental United States has thus far experienced a cooler-than-recent-normal year, clocking in as the 67th warmest. Worldwide, however, the first six months of 2019 were the third warmest on record anchored most recently by the warmest June on record.
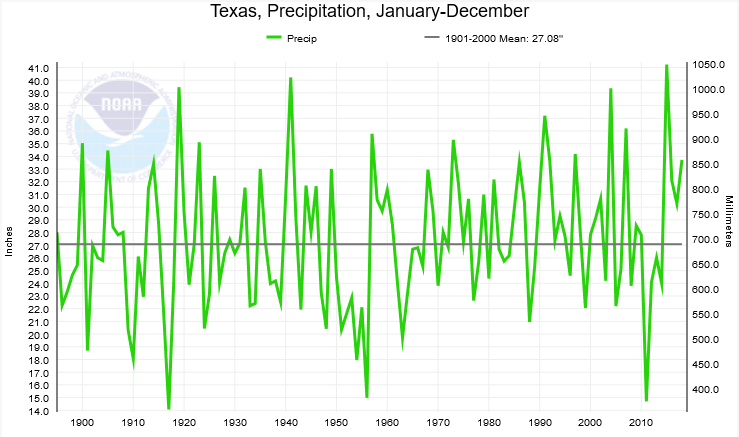
For Texas, the first six months ranks as the 22nd wettest and the 54th warmest on record. Longer term, we’ve seen an uptick of average annual temperatures since the 1970s (Figure 1a). Although there is the requisite year-to-year variability, four of the last eight years in Texas were warmer than the Dust Bowl years or the drought of the 1950s. Precipitation has been relatively flat in that there doesn’t appear to be much of a long-term trend, even with large -year-to-year variations (Figure 1b).
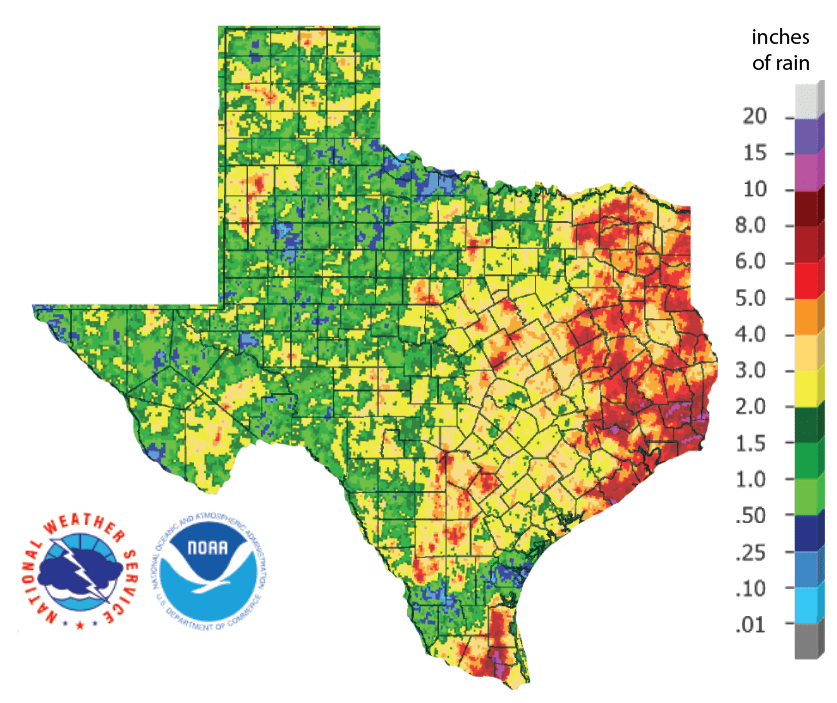
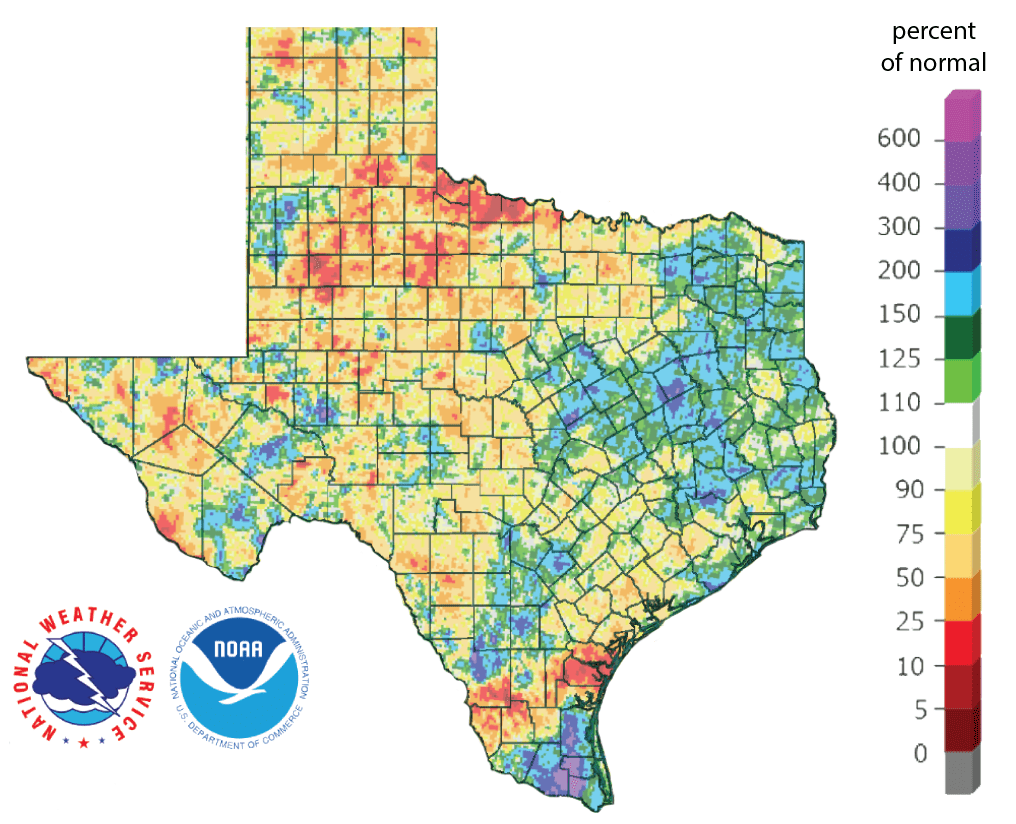
Monthly rainfall accumulations slowed down over the past four weeks from its wetter-than-normal pace this year with much of the state receiving less than 3 inches and a sizeable fraction receiving less than 2 inches (Figure 2a). Parts of East Texas saw more than 5 inches of rainfall. Rainfall amounts were substantially less than normal for much of the state (Figure 2b).
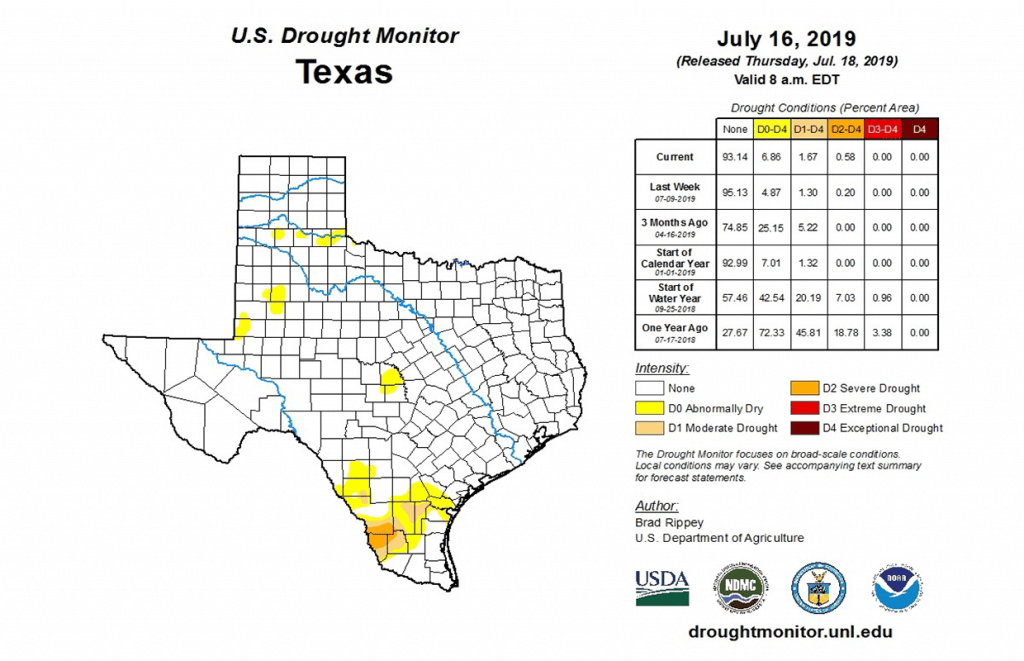
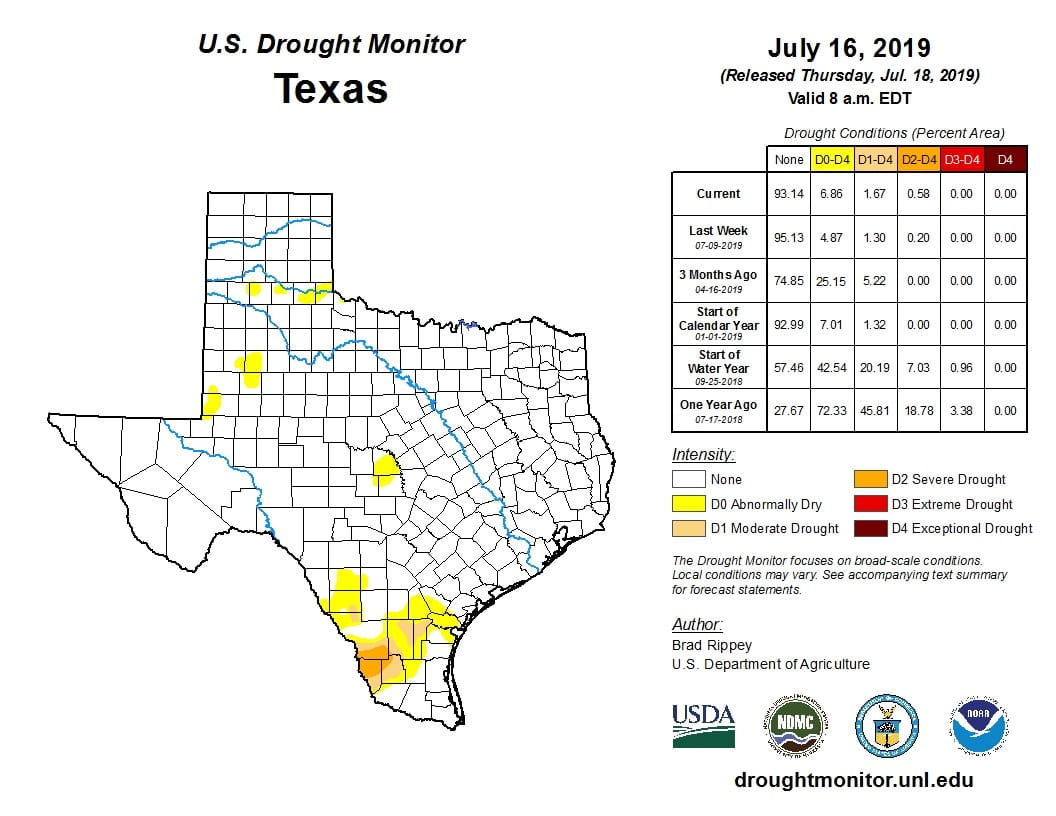
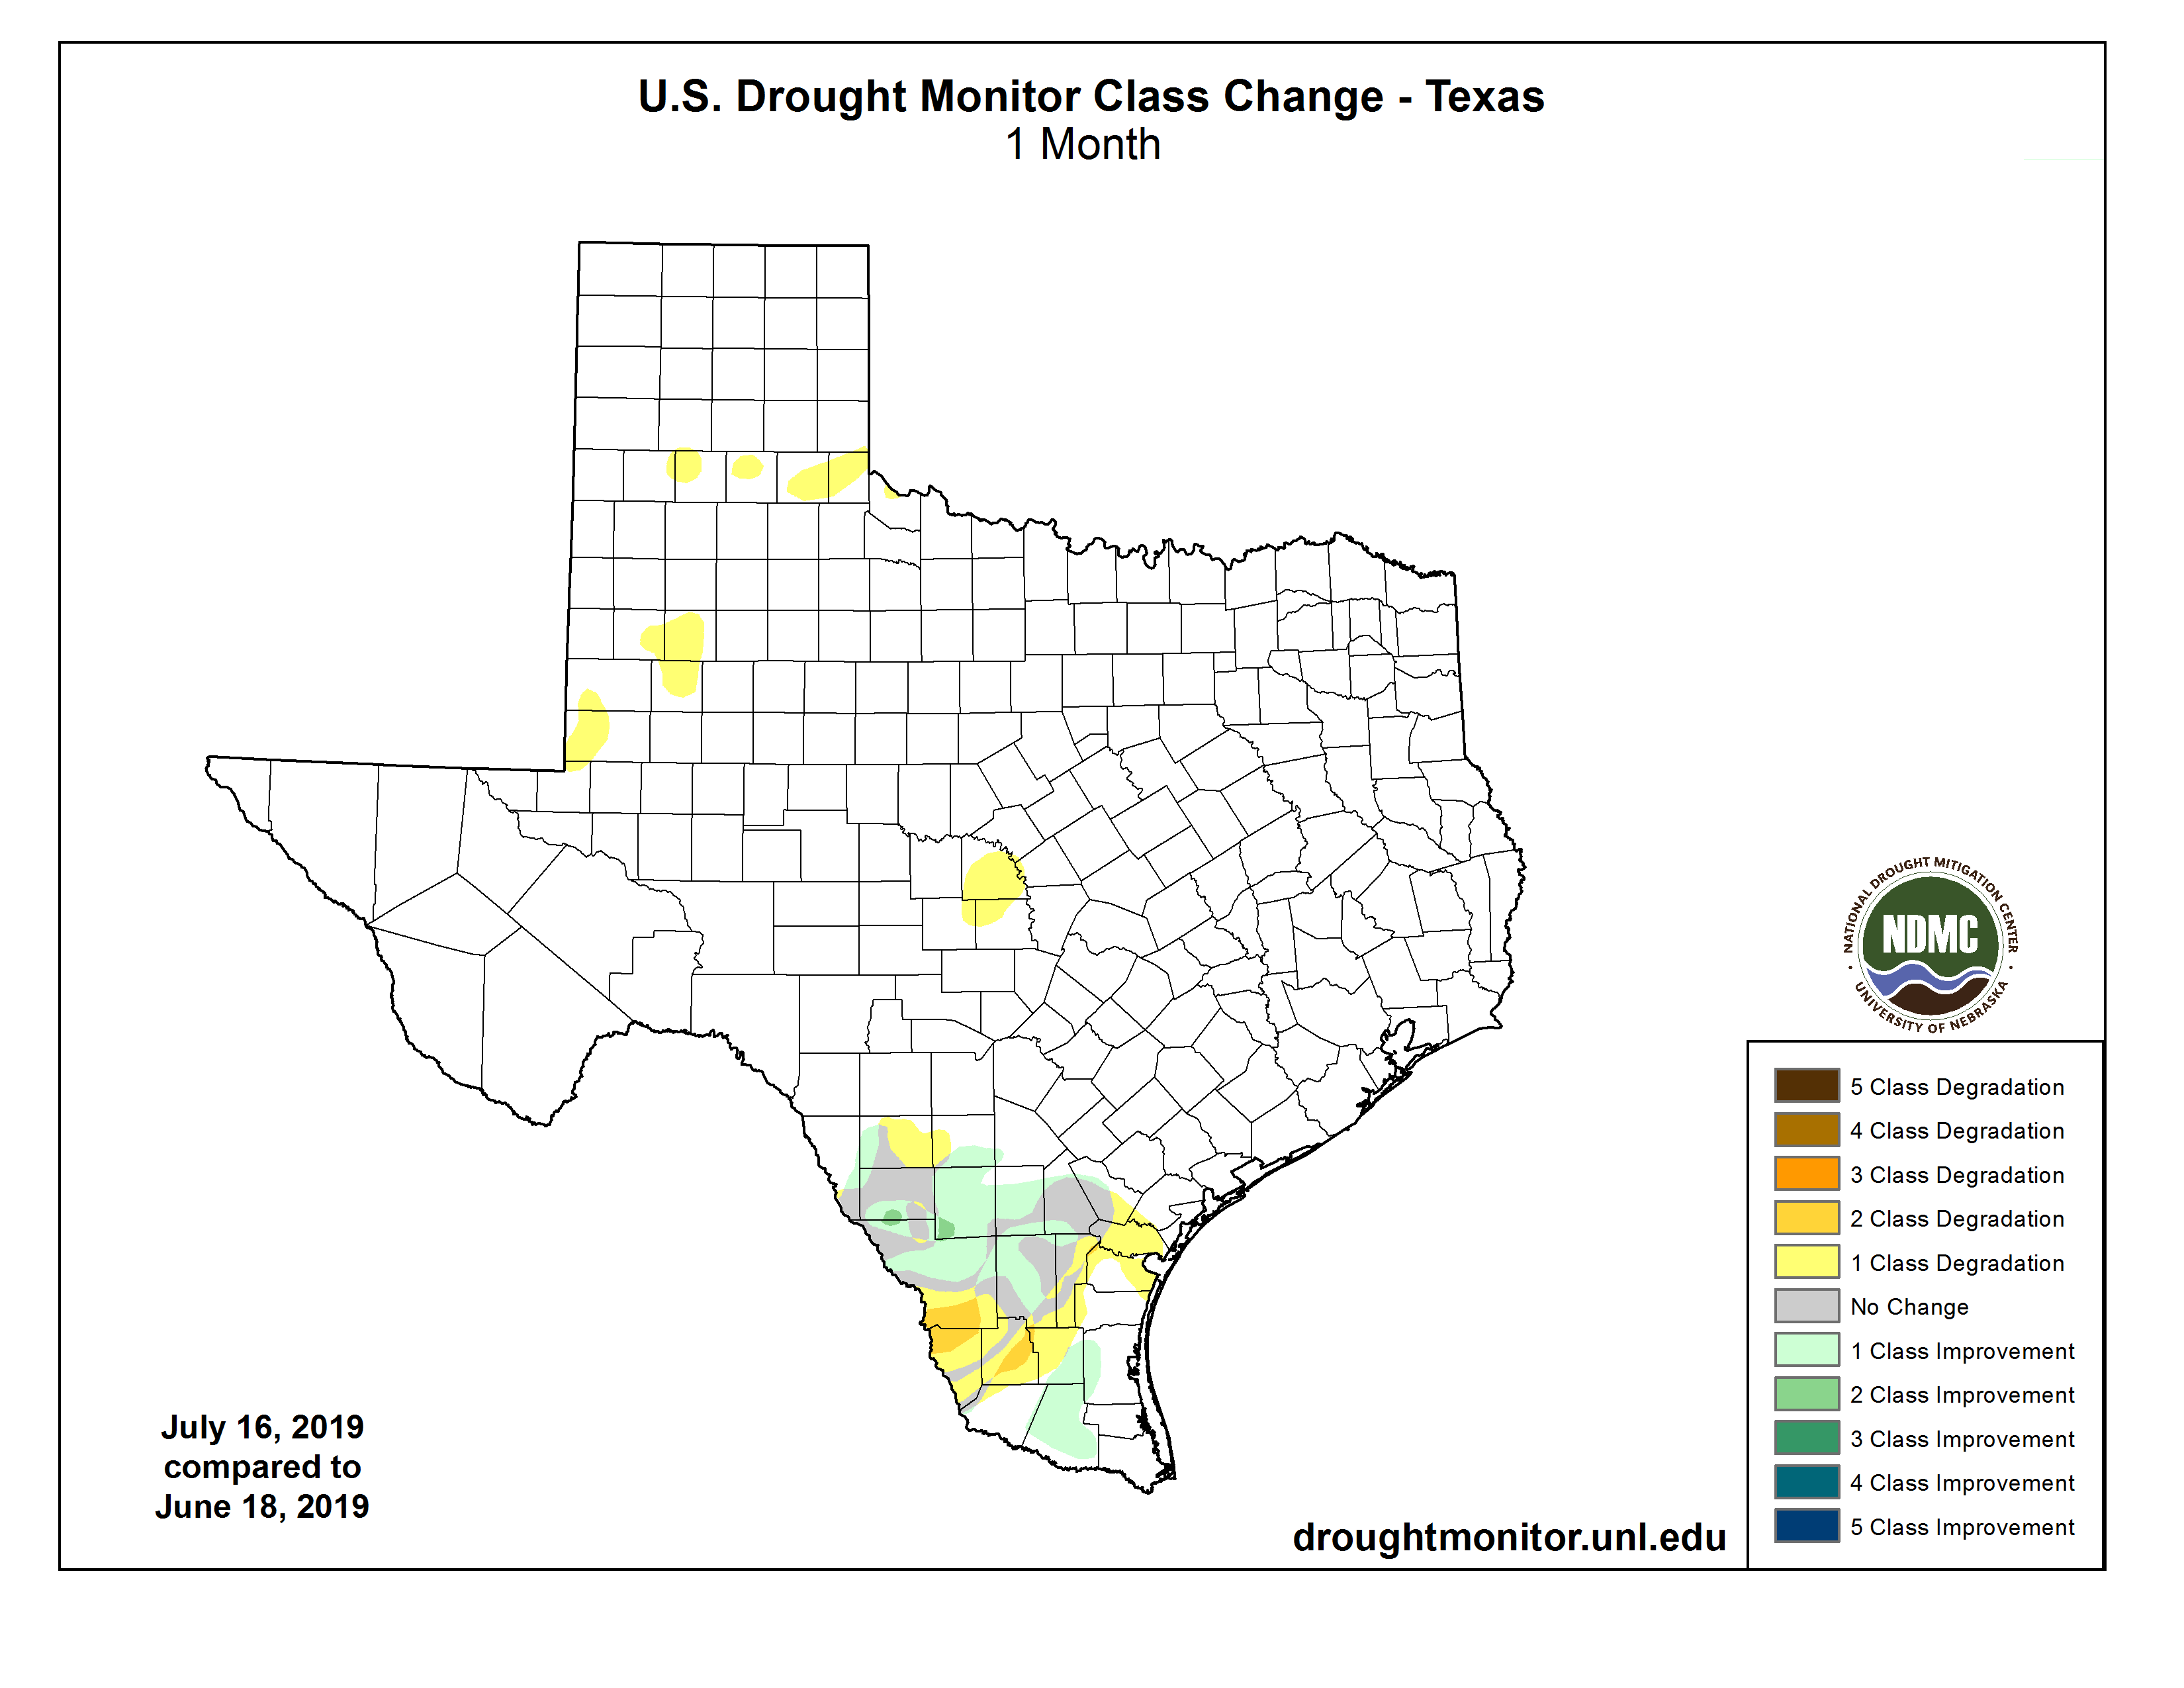
Most of the state remains drought-free (Figure 3a) with this month’s drought map spatially similar to last month’s (Figure 3b). However, Severe Drought conditions have developed in parts of South Texas, and blotches of Abnormally Dry conditions have appeared in the High Plains and San Angela areas (Figures 3a and 3b).
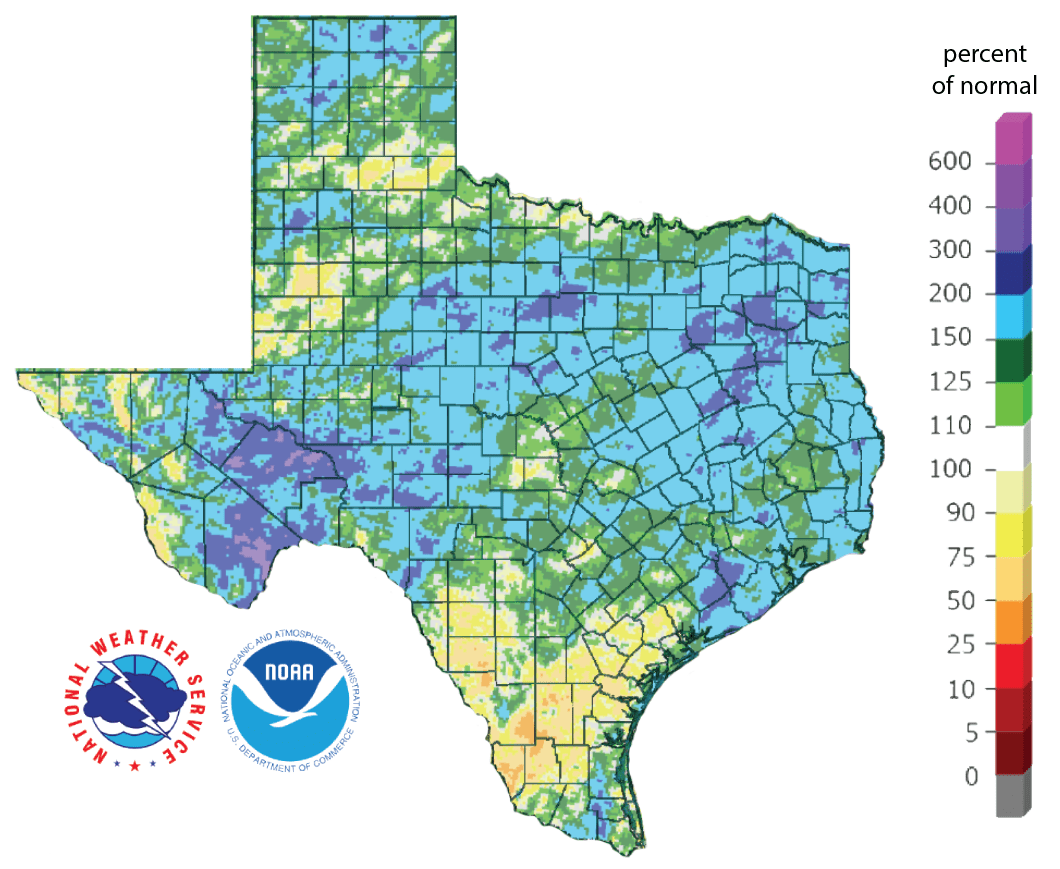
Much of the state has received normal or greater than normal rainfall for the past 90 days; however, there are areas that have received less than 75 percent and 50 percent of normal rainfall for the same time period (Figure 3c). In general, percent of normal precipitation for the past 90 days correlates well with the Drought Monitor and can be used to discern areas going into (or out of) drought.
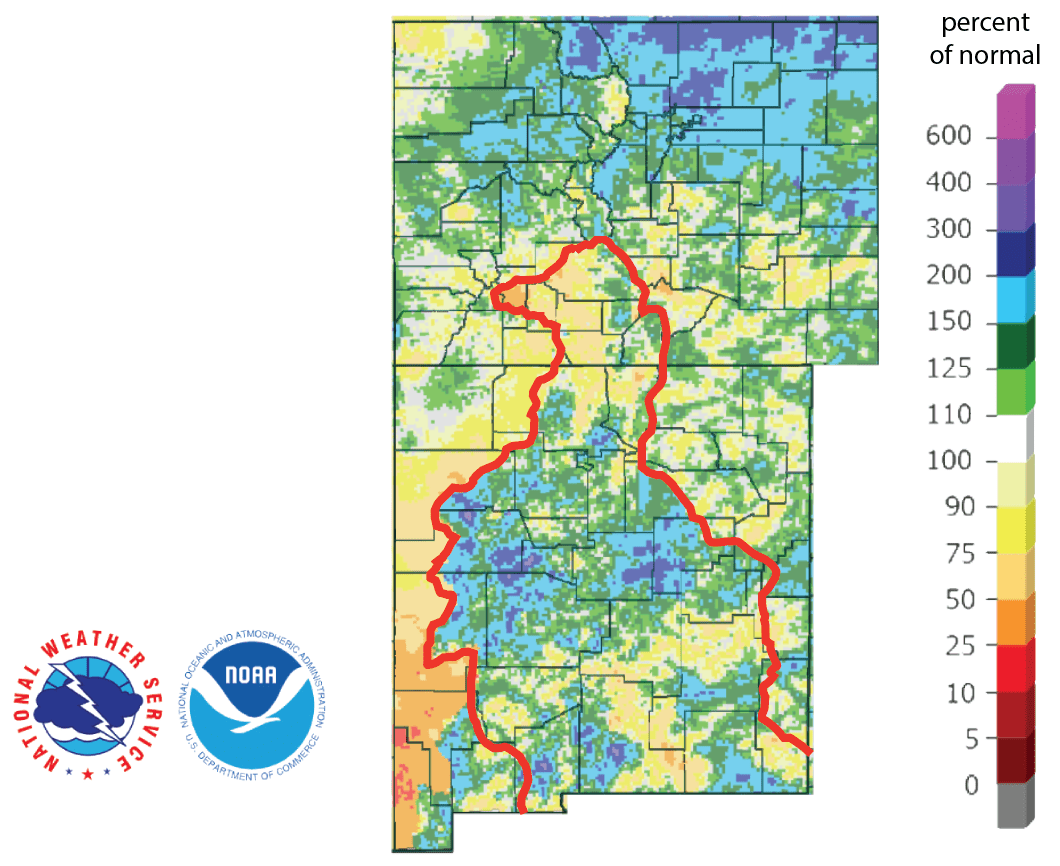
The North American Drought Monitor for the end of June continues to show short-term drought in Texas with long-term drought in northwestern New Mexico near the headwaters of the Rio Grande (Figure 4a). Percent of normal precipitation in the Rio Grande watershed in Colorado, the primary source of water for Elephant Butte Reservoir, over the last 90 days shows less than normal rainfall; however, much of the basin in New Mexico has benefited from much greater-than-normal rainfall (Figure 4b).

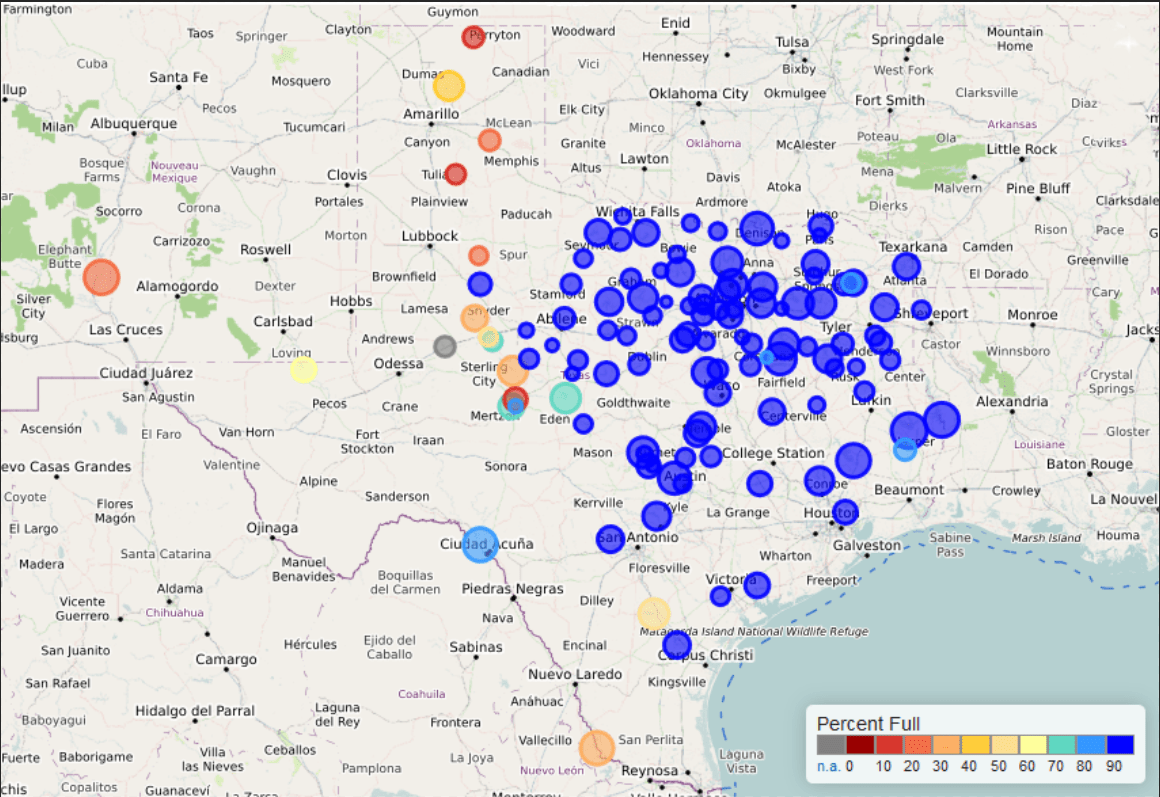
Statewide reservoir storage decreased slightly over the past month but remains about 6 percentage points above normal for this time of year (Figure 5a). Percent full status for individual reservoirs this month (Figure 5b) is about the same as last month although Elephant Butte Reservoir is now about 29 percent full—the fullest it’s been since June 2010 and up from 25 percent a month ago (Figure 5c).
We are still under an El Niño Advisory; however, the Climate Prediction Center is now projecting a transition from El Niño to La Nada (neutral) conditions in the next month or two (Figure 6). The Center expects neutral conditions to continue through the fall and winter.

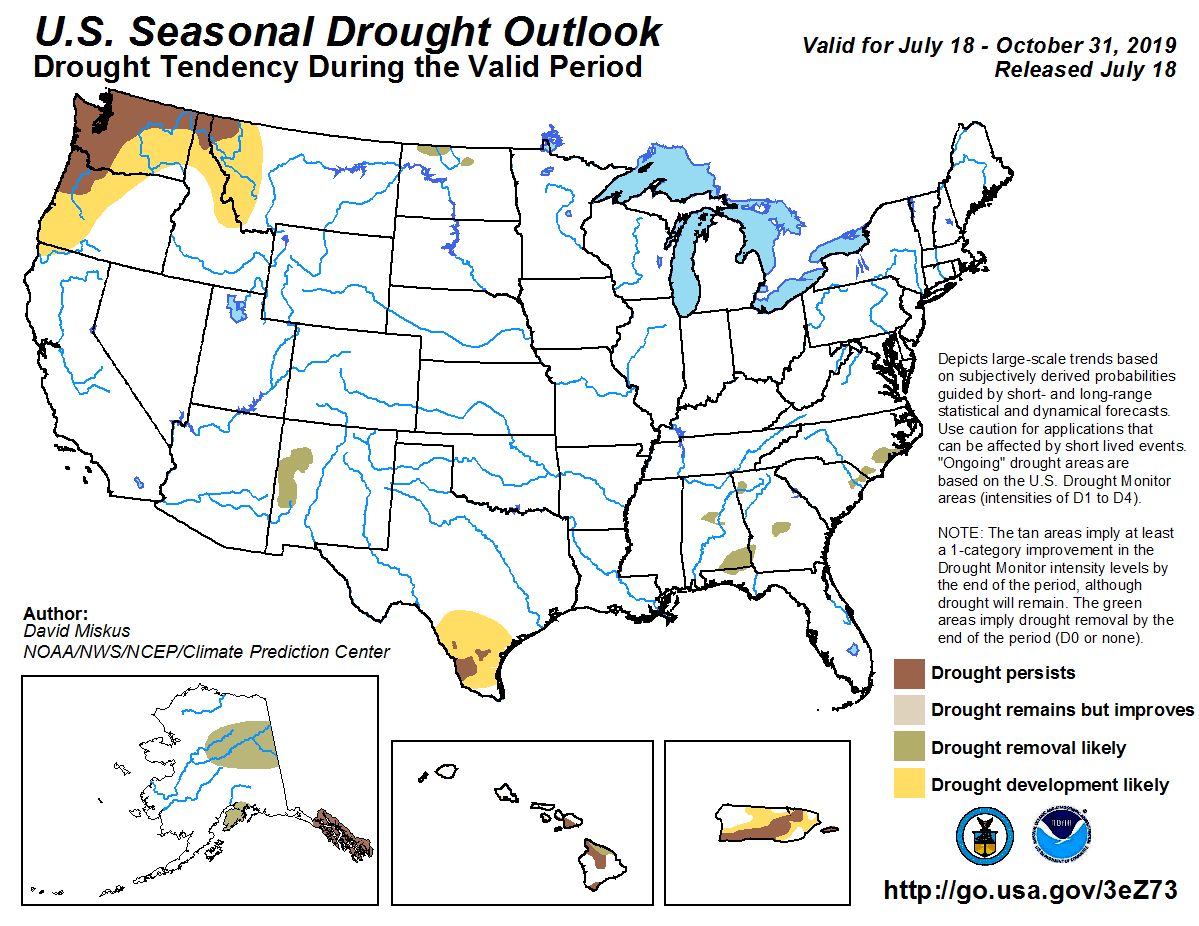
The U.S. Seasonal Drought Outlook through October 31, 2019, suggests the persistence and further development of drought in South Texas and the Lower Rio Grande Valley (Figure 7).
Author
 Robert Mace,
Interim Executive Director & Chief Water Policy Officer at The Meadows Center for Water and the Environment
Robert Mace is a Professor of Practice in the Department of Geography at Texas State University. Robert has over 30 years of experience in hydrology, hydrogeology, stakeholder processes, and water policy, mostly in Texas.