SUMMARY:
- 90% of the state is in drought with the return of exceptional drought conditions in the High Plains
- Exceptional drought — the worst drought category — has appeared in the High Plains
- Dry conditions expected to continue
I wrote this article on March 13, 2022.
I wrote this report a week earlier than usual because the Bride and I will be in Iceland by the time you read this. Looking ahead to our trip, the temperatures will be between the expected 30° and 40° F with winds at 30 to 40 miles per hour and chances (including 100% chances) of snow (Figure 1a). Sounds lovely. We’ve ordered pull-on cleats since Icelanders don’t clear the ice from their sidewalks except where geothermal water courses below the concrete along the main downtown shopping street. Other than that, it’s a 100% chance of spontaneous breakdancing.
A visit to the Icelandic Met Office also reveals a slushflow warning for South Iceland for March 14. A slushflow, it turns out, is like an avalanche of dirt-flavored slushies that are a particular hazard in Iceland and Norway. The Met also has an aurora forecast of cloud cover to assist folks in seeing the Northern Lights. Some years ago, we saw a spectacular show of them near Selfoss (Figure 2b).
Similar to the rest of the planet, Iceland has been seeing warming over time, with temperatures at their oldest weather station along the west coast increasing by about 2.5° C (4.5° F) over the past 222 years (Figure 1c). Iceland has several concerns on global warming, including ocean currents and acidification and associated impacts on fish stocks, terrestrial impacts, and impacts on glaciers, which are projected to potentially (and effectively) disappear over the next 200 years (Figure 1d).
This is our third trip to the Land of Ice during the winter months, this one focused on seeing our favorite band, GusGus, perform a couple 25th anniversary shows. Although the weather outside is frightful, we hope the shows are delightful. Let it snow, let it snow, let it snow.

Figure 1a: Average high and low temperatures in Reykjavik (source).

Figure 1b: The auroras near Selfoss, Iceland (photo by the author).

Figure 1c: Mean annual temperature in Stykkishólmur 1798 – 2016 (source).

Figure 1d: Response of Langjökull, Hofsjökull and Southern Vatnajökull to climate warming (source).
Over the past 30 days, we’ve seen the usual wetter-in-the-east-and-drier-in-the-west pattern with upwards of 4 to 5 inches of precipitation in northeastern parts of the state and less than half an inch for much of the western and southwestern parts of the state (Figure 2a). Compared to normal conditions, we’ve had a terrible past 30 days with 99% of the state getting less than normal precipitation (Figure 2b). Rain over the past 90 days — a big driver for drought conditions — remains below normal for almost the entire state with most of the state having received less than 50% of normal precipitation (Figure 2c).

Figure 2a: Inches of precipitation that fell in Texas in the 30 days before March 13, 2022 (modified from source). Note that cooler colors indicate lower values and warmer indicate higher values. Light grey is no detectable precipitation.

Figure 2b: Rainfall as a percent of normal for the 30 days before March 13, 2022 (modified from source).

Figure 2c: Rainfall as a percent of normal for the 90 days before March 13, 2022 (modified from source).
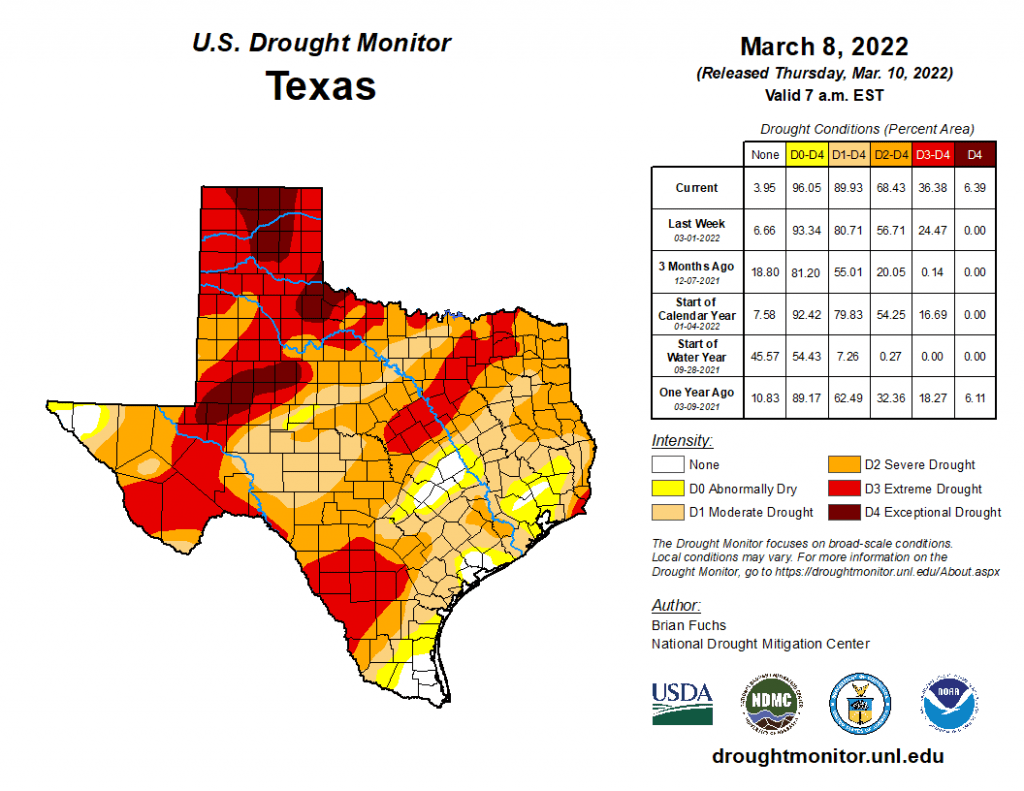
The amount of the state under drought conditions (D1–D4) increased from 77.6% four weeks ago to 89.9% today (Figure 3a) with drought retreating from parts of North-Central Texas but expanding and deepening for much of the rest of the state (Figure 3b). Extreme Drought or worse has increased to about 36% of the state, with exceptional drought appearing in the High Plains and covering about 6% of the state (Figure 3a). In all, 96.1% of the state remains abnormally dry or worse (D0–D4; Figure 3a), up from 88.2% four weeks ago.

Figure 3a: Drought conditions in Texas according to the U.S. Drought Monitor (as of March 8, 2022; source).

Figure 3b: Changes in the U.S. Drought Monitor for Texas between February 8, 2022, and March 8, 2022 (source).
The North American Drought Monitor, which runs a month behind (and, because I wrote this report early, is two months behind), continues to show drought over much of the western United States with drought conditions looking similar to those of last month (Figure 4a). Precipitation in the vast majority of the Rio Grande watershed in Colorado and New Mexico over the last 90 days was less than normal (Figure 4b).
Conservation storage in Elephant Butte Reservoir — an important source of water for the El Paso area — increased from 10.5% full last month to 11.4% today (Figure 4c), just above historic (since 1990) lows.
The Rio Conchos basin in Mexico, which confluences into the Rio Grande just above Presidio and is the largest tributary to the Rio Grande, remains partially abnormally dry in the Sierra Madre Occidental (Figure 4a). Combined conservation storage in Amistad and Falcon reservoirs decreased slightly from 36.8% last month to 36.4% full today, about 23 percentage points below normal for this time of year (Figure 4d).

Figure 4a: The North American Drought Monitor for January 31, 2021 (source).

Figure 4b: Percent of normal precipitation for Colorado and New Mexico for the 90 days before March 13, 2022 (modified from source). The red line is the Rio Grande Basin. I use this map to see check precipitation trends in the headwaters of the Rio Grande in southern Colorado, the main source of water to Elephant Butte Reservoir downstream.

Figure 4c: Reservoir storage in Elephant Butte Reservoir since 2020 with the median, min, and max for measurements from 1990 through 2021 (graph from Texas Water Development Board).

Figure 4d: Reservoir storage in Amistad and Falcon reservoirs since 2020 with the median, min, and max for measurements from 1990 through 2021 (graph from Texas Water Development Board).
A number of basins across the state have flows over the past week below historical 25th, 10th, and 5th flow percentiles (Figure 5a). Statewide reservoir storage is at 77.6% full as of today, down 95,000 acre-feet and 77.9% full a month ago, about four percentage points below normal for this time of year (Figure 5b). Unusual for this time of year, more reservoirs in the eastern part of the state have fallen below 90% and now 80% full (Figure 5c). The reservoir marked in red northeast of Dallas (between 20 and 30% full) is accurately but perhaps unfairly red because it, Bois D’Arc Lake, is newly born and just started its initial inundation (Figure 5d).

Figure 5a: Parts of the state with below-25th-percentile seven-day average streamflow as of March 12, 2022 (map modified from U.S. Geological Survey).

Figure 5b: Statewide reservoir storage since 2020 compared to statistics (median, min, and max) for statewide storage from 1990 through 2021 (graph from Texas Water Development Board).

Figure 5c: Reservoir storage as of March 13, 2022 in the major reservoirs of the state (modified from Texas Water Development Board).

Figure 5d: Hydrograph of the month — reservoir storage in Lake Travis (graph from Texas Water Development Board).
Sea-surface temperatures in the Central Pacific that in part define the status of the El Niño Southern Oscillation continue to solidly reside in La Niña conditions, although they have warmed slightly (Figure 6a). Accordingly, we remain under a La Niña Advisory. Projections of sea-surface temperatures suggest an 80% chance of remaining in La Niña conditions through the April-June season with a coin’s toss chance of being in either La Niña or La Nada (neutral) conditions during the summer season (Figure 6b).

Figure 6a. Forecasts of sea-surface temperature anomalies for the Niño 3.4 Region as of February 18, 2022 (modified from Climate Prediction Center and others). “Range of model predictions -1” is the range of the various statistical and dynamical models’ projections minus the most outlying upper and lower projections. Sometimes those predictive models get a little craycray!

Figure 6b. Probabilistic forecasts of El Niño, La Niña, and La Nada (neutral) conditions (graph from the Climate Prediction Center and International Research Institute).
The U.S. Seasonal Drought Outlook through May 2022 shows the drought retreating from Arkansas and Louisiana to the Texas border (Figure 7a). Regardless, the drought outlook shows drought continuing or developing for the entire state, including the areas that recently came out of drought — something that has come true over the past month (Figure 7a). The three-month temperature outlook projects warmer-than-normal conditions for the entire state (Figure 7b), while the three-month precipitation outlook favors drier-than-normal conditions for most of state (Figure 7c).

Figure 7a: The U.S. Seasonal Drought Outlook for March 1, 2022, through May 31, 2022 (source).

Figure 7b: Three-month temperature outlook for March-April-May 2022 (source).

Figure 7c: Three-month precipitation outlook for March-April-May 2022 (source).