SUMMARY:
- 93% of the state is abnormally dry or worse with 17% in exceptional drought, the worst drought category
- La Niña conditions are getting stronger with the fall and early winter favoring a continued La Niña advisory, which would make it only the second three-year La Nina since 1950
- That was the second hottest May in Texas since 1895
I wrote this article on June 22 and 23, 2022.
Heat and drought are becoming big news as far as weather and water is concerned. This past May tied with 2018 as the second warmest on record (since 1895) beat only by May of 1996, a drought that led to Senate Bill 1 water planning in 1997 (Figure 1a). May was 5.5 °F warmer than the long-term average for the month.
However, due to a cooler-than-normal January through March, this year is the 59th warmest year as measured from January through May but already warmer than the long-term average (Figure 1b). Given that four of the five warmest years on record were in the top 10 at this point of the year and all were in the top 20, it’s unlikely that 2022 will be a record warm year unless it scarily scorches the rest of the calendar.
We’ve already had two winter-season La Niñas in a row, and projections suggest we may get a third one this fall and winter (see La Niña section of this column). According to the National Weather Service, there has only been one other time since 1950 (1973 to 1976) where we’ve experienced three years in a row of La Niña conditions. Regardless, that ain’t good because La Niñas are associated with hotter-than-normal and drier-than-normal conditions for much of Texas. We have been lucky in that the La Niñas we’ve experienced so far have been moderate (Figure 2c), whereas the La Niña for 2010–2011 and other notable recent droughts were strong (Figure 1c).
As we enter our traditionally hot and dry summer, we probably won’t see relief until later this year unless a tropical system roars into the state. The Texas Commission on Environmental Quality (TCEQ) keeps a list of public water systems that have reported restrictions on water use. So far this year, 75 systems have reported enacting water restrictions. On May 27th, TCEQ sent letters to surface-water right holders that the TCEQ was watching the drought closely and that when streamflows are reduced, water permits may be curtailed. TCEQ also made it clear that due to the TCEQ v. Texas Farm Bureau court decision, they “…will not be able to exempt any water rights, including junior water rights used for municipal purposes or power generation, from curtailment or suspension based on public health, safety, or welfare concerns.”
Let’s hope it doesn’t come to that.

Figure 1a: Average temperature May in Texas since 1895 (source).

Figure 1b: Heywood plot for Texas showing statewide average year-to-date temperatures for the period of record (source).

Figure 1c: Oceanic Niño Index since 1990 (source).
Over the past 30 days, we’ve seen more than five inches of rain all along the Red River and in the Lower Rio Grande Valley with less than two inches of rain over much of the rest of the state (Figure 2a). Much of the state received less than normal amounts of rainfall over the past 30 days except for the Lower Rio Grande Valley, the El Paso Region (thanks to the welcome onset of the summer monsoon season), and blotches in some other parts of the state (Figure 2b). Rain over the past 90 days—a big driver for drought conditions—remains below normal for almost the entire state except for parts of Far West Texas, the Lower Rio Grande Valley, and the Red River Valley (Figure 2c). Overall, though, the 90-day map looks better than last month.

Figure 2a: Inches of precipitation that fell in Texas in the 30 days before June 22, 2022 (modified from source). Note that cooler colors indicate lower values and warmer indicate higher values. Light grey is no detectable precipitation.

Figure 2b: Rainfall as a percent of normal for the 30 days before June 22, 2022 (modified from source).

Figure 2c: Rainfall as a percent of normal for the 90 days before June 22, 2022 (modified from source).
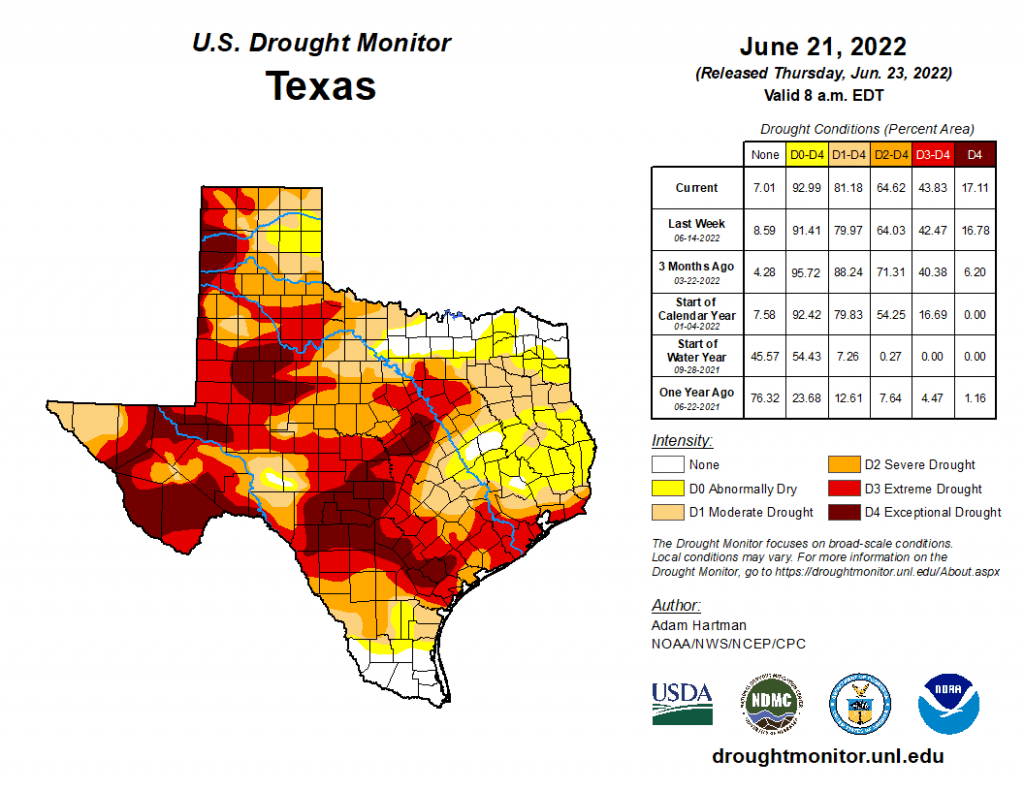
The amount of the state under drought conditions (D1–D4) decreased ever so slightly from 81.4% four weeks ago to 81.2% today (Figure 3a) with drought conditions improving in the High Plains area and deepening in the eastern parts of the state (Figure 3b). Extreme drought or worse has decreased to about 44% of the state with exceptional drought decreasing in coverage to 17% of the state (Figure 3a). In all, 93% of the state remains abnormally dry or worse (D0–D4; Figure 3a), up from 90% five weeks ago.

Figure 3a: Drought conditions in Texas according to the U.S. Drought Monitor (as of June 21, 2022; source).

Figure 3b: Changes in the U.S. Drought Monitor for Texas between May 24, 2022, and June 21, 2022 (source).
The North American Drought Monitor, which runs a month behind, continues to show drought over much of the western United States (Figure 4a). Precipitation over much of the Rio Grande watershed in Colorado and New Mexico over the last 90 days was less than normal, although the watershed in Colorado did see some major precipitation (Figure 4b). The onset of summer monsoon rains has improved rainfall deficits from last month and provided hopeful relief from forest fire concerns.
Conservation storage in Elephant Butte Reservoir — an important source of water for the El Paso area — decreased from 13.3% full last month to 9.0% full today (Figure 4c), just above historic (since 1990) lows.
The Rio Conchos Basin in Mexico, which confluences into the Rio Grande just above Presidio and is the largest tributary to the Rio Grande, has deteriorated to severe to exceptional drought (Figure 4a). Combined conservation storage in Amistad and Falcon reservoirs decreased from 29.7% last month to 28.1% full today, about 30 percentage points below normal for this time of year (Figure 4d).

Figure 4a: The North American Drought Monitor for May 31, 2022 (source).

Figure 4b: Percent of normal precipitation for Colorado and New Mexico for the 90 days before May 24, 2022 (modified from source). The red line is the Rio Grande Basin. I use this map to see check precipitation trends in the headwaters of the Rio Grande in southern Colorado, the main source of water to Elephant Butte Reservoir downstream.

Figure 4c: Reservoir storage in Elephant Butte Reservoir since 2020 with the median, min, and max for measurements from 1990 through 2021 (graph from Texas Water Development Board).

Figure 4d: Reservoir storage in Amistad and Falcon reservoirs since 2020 with the median, min, and max for measurements from 1990 through 2021 (graph from Texas Water Development Board).
Basins across the state over the past week have flows below historical 25th, 10th, and 5th flow percentiles (Figure 5a). Statewide reservoir storage is at 76.6% full as of today, down 670,000 acre-feet from 78.7% a month ago, now about 10 percentage points below normal for this time of year (Figure 5b) While many reservoirs in the eastern part of the state remain more than 90% full, a dozen or so in the Dallas-Fort Worth area are under 90% full with a handful less than 80% full (Figure 5c). The reservoir marked in orange northeast of Dallas (between 50% and 60% full) is accurately but perhaps unfairly orange because it, Bois D’Arc Lake, is a newborn and just started its initial inundation (Figure 5c). Reservoirs in the Temple-Killeen area are below normal (usually 100% full!) for this time of year and heading toward historic (since 1990) lows if rains don’t come (Figure 5d).

Figure 5a: Parts of the state with below-25th-percentile seven-day average streamflow as of June 22, 2022 (map modified from U.S. Geological Survey).

Figure 5b: Statewide reservoir storage since 2020 compared to statistics (median, min, and max) for statewide storage from 1990 through 2021 (graph from Texas Water Development Board).

Figure 5c: Reservoir storage as of June 22, 2022, in the major reservoirs of the state (modified from Texas Water Development Board).

Figure 5d: Hydrograph of the Month—Reservoir storage for the Temple-Killeen Angelo area reservoir (Belton; graph from Texas Water Development Board).
Sea-surface temperatures in the Central Pacific that in part define the status of the El Niño Southern Oscillation continue to reside in La Niña conditions and have cooled deeper into La Niña conditions (Figure 6a). This month’s projection is a bit cooler than last month’s suggesting that La Niña conditions will remain through the fall and early winter (Figure 6a). Accordingly, we remain under a La Niña Advisory. Projections of sea-surface temperatures suggest a 58% to 59% chance of remaining in La Niña conditions in the fall and early winter (Figure 6b). The last two seasons (NDJ and DJF) show a bump up into neutral conditions; however, I believe that this is an artifact of uncertainty in projecting that far into the future.

Figure 6a. Forecasts of sea-surface temperature anomalies for the Niño 3.4 Region as of June 9, 2022 (modified from Climate Prediction Center and others). “Range of model predictions -1” is the range of the various statistical and dynamical models’ projections minus the most outlying upper and lower projections. Sometimes those predictive models get a little craycray!

Figure 6b. Probabilistic forecasts of El Niño, La Niña, and La Nada (neutral) conditions (graph from the Climate Prediction Center and International Research Institute).
The U.S. Seasonal Drought Outlook through June 2022 shows the drought retreating a small bit in the Texas Panhandle but expanding elsewhere in the state (and a bizarre extension from Texas up into Chicago; Figure 7a). The three-month temperature outlook projects warmer-than-normal conditions for the entire state (Figure 7b), while the three-month precipitation outlook favors drier-than-normal conditions for the High Plains area of the state, an improvement from last month (Figure 7c).

Figure 7a: The U.S. Seasonal Drought Outlook for June 16, 2022, through September 30, 2022 (source).

Figure 7b: Three-month temperature outlook for July-August-September 2022 (source).

Figure 7c: Three-month precipitation outlook for July-August-September 2022 (source).