SUMMARY:
- 99.2% of the state is abnormally dry or worse with 20.4% in exceptional drought, the worst drought category
- June clocked in as the fifth warmest June in Texas since 1895
- There’s a 60% chance of remaining in La Niña conditions through July–September and a 62%–66% chance through fall and early winter
I wrote this article on July 21st and 22nd, 2022.
The hotter-than-Hades temperatures and lowering reservoir levels have people asking: Is this 2011 all over again? The year 2011, if you recall (assuming you’ve been here a hot minute), is the state’s worst one-year drought and kicked off several miserable — and scary — years of water-supply shortages and near-miss water-supply failures. “Is this 2011 all over again?” is a good question to ask because it sure feels similar and, in the case of reservoir levels, looks somewhat familiar (Figure 1a; thanks to the cool kids at Texas Water Development Board for adding 2011 to these plots). But each drought is different, and so it is with this one. Reservoir levels are not as bad and, if one good thing came out of the 2011–2015 drought, the state should be more resilient if we learned lessons from that experience.
Las Moras Springs in Brackettville have gone dry. Not unprecedented, but also not common. And flows from San Felipe Springs, hovering at one cubic meter per second (22.8 million gallons per day), are at their lowest level since at least the early 1960s (and before Lake Amistad filled; Figure 1b). And speaking of Lake Amistad, it hit its lowest level since inundation in the late 1960s on July 20, 2022 (Figure 1c). Hard to tell exactly what the future may hold, but for the time being the future leans La Niña, suggesting more hotter-than-normal and drier-than-normal conditions through this year and possibly into next year.
June 2022 clocked in as the fifth warmest June (average temperature) in Texas since 1895 with 2011 as the warmest. For year-to-date hotness, 2022 is currently ranked 9th, while 2011 comes in second behind 2006. Wichita Falls hit 114°F on July 19th (with an average high of 103.9°F through July 21st). For the year-to-date temperature, we are two to three degrees warmer than normal and starting to track with 2016, which ended up as the fourth warmest year on record (Figure 1d). I’ll keep this plot in the mix every month because it’s so darn exciting to see where we will end up!

Figure 1a: Statewide reservoir storage since 2020 compared to statistics (median, min, and max) for statewide storage from 1990 through 2021 (graph from Texas Water Development Board).

Figure 1b: Statewide reservoir storage since 2020 compared to statistics (median, min, and max) for statewide storage from 1990 through 2021 (graph from www.edwardsaquifer.net/sanfelip)

Figure 1c: Statewide reservoir storage in Lake Amistad since 2020 compared to statistics (median, min, and max) for statewide storage from 1990 through 2021 (graph from Texas Water Development Board).

Figure 1d: Heywood plot for Texas showing statewide average year-to-date temperatures for the period of record (source).
Over the past 30 days, much of the state saw less than two inches of rain with some spots seeing six inches or more (Figure 2a). Much of the state received less than normal amounts of rainfall over the past 30 days except for some disparate small areas (Figure 2b). Rain over the past 90 days — a big driver for drought conditions — remains below normal for almost the entire state except for parts of Far West Texas, the Lower Rio Grande Valley, and the Red River Valley (Figure 2c). Overall, though, the 90-day map looks better than last month.

Figure 2a: Inches of precipitation that fell in Texas in the 30 days before July 21, 2022 (modified from source). Note that cooler colors indicate lower values and warmer indicate higher values. Light grey is no detectable precipitation.

Figure 2b: Rainfall as a percent of normal for the 30 days before July 21, 2022 (modified from source).

Figure 2c: Rainfall as a percent of normal for the 90 days before June 22, 2022 (modified from source).
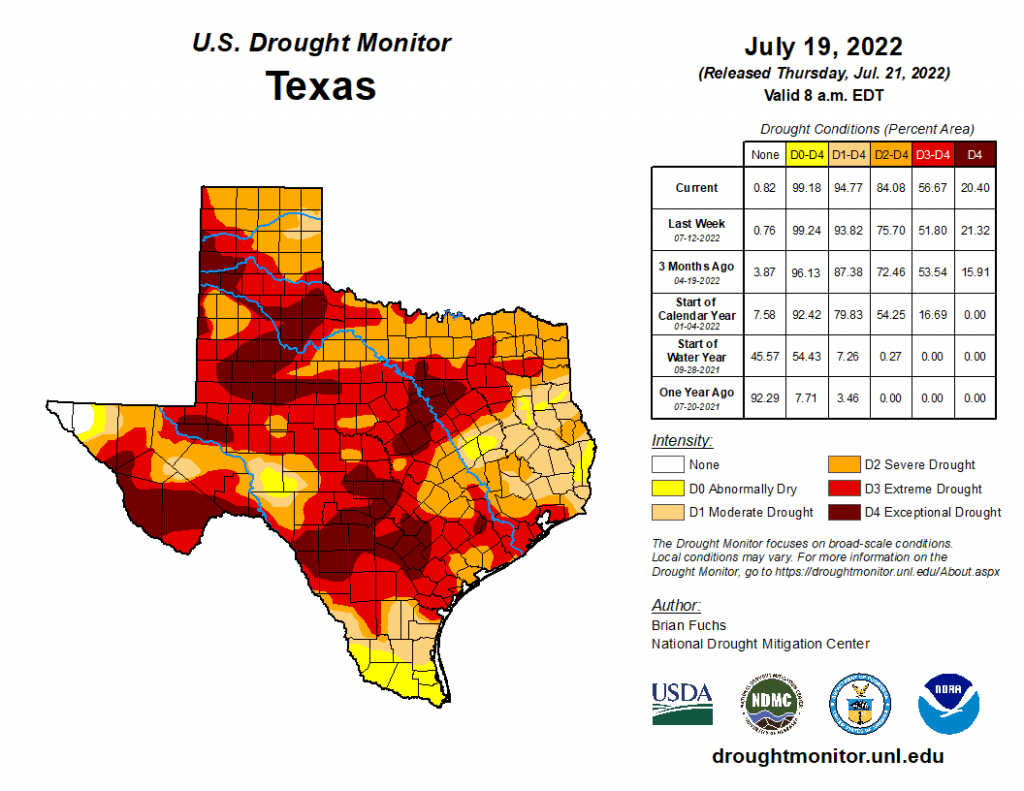
The amount of the state under drought conditions (D1–D4) increased from 81.2% four weeks ago to 94.8% today (Figure 3a) with drought conditions improving in Far West Texas and the Edwards Plateau but worsening elsewhere (Figure 3b). Extreme drought or worse has increased to about 57% of the state with exceptional drought increasing to cover 20% of the state (Figure 3a). In all, 99.2% of the state remains abnormally dry or worse (D0–D4; Figure 3a), up from 93% four weeks ago.

Figure 3a: Drought conditions in Texas according to the U.S. Drought Monitor (as of July 19, 2022; source).

Figure 3b: Changes in the U.S. Drought Monitor for Texas between June 21, 2022, and July 19, 2022 (source).
The North American Drought Monitor, which runs a month behind, continues to show drought over much of the western United States (Figure 4a). Precipitation over much of the Rio Grande watershed in Colorado and New Mexico over the last 90 days was less than normal although the western half of New Mexico saw some major rainfalls from an active monsoon season (Figure 4b).
Conservation storage in Elephant Butte Reservoir — an important source of water for the El Paso area — decreased from 9.0% full last month to 5.3% today (Figure 4c), just above historic (since 1990) lows.
The Rio Conchos Basin in Mexico, which confluences into the Rio Grande just above Presidio and is the largest tributary to the Rio Grande, continues to experience severe to exceptional drought (Figure 4a). Combined conservation storage in the Amistad and Falcon reservoirs decreased from 28.1% last month to 24.2% full today, about 30 percentage points below normal for this time of year (Figure 4d).

Figure 4a: The North American Drought Monitor for June 30, 2022 (source).

Figure 4b: Percent of normal precipitation for Colorado and New Mexico for the 90 days before July 21, 2022 (modified from source). The red line is the Rio Grande Basin. I use this map to see check precipitation trends in the headwaters of the Rio Grande in southern Colorado, the main source of water to Elephant Butte Reservoir downstream.

Figure 4c: Reservoir storage in Elephant Butte Reservoir since 2020 with the median, min, and max for measurements from 1990 through 2021 (graph from Texas Water Development Board).

Figure 4d: Reservoir storage in Amistad and Falcon reservoirs since 2020 with the median, min, and max for measurements from 1990 through 2021 (graph from Texas Water Development Board).
Basins across the state have flows over the past week below historical 25th, 10th, and 5th flow percentiles (Figure 5a). Statewide reservoir storage is at 72.4% full as of today, down 1.3 million acre-feet from 76.6% a month ago, now about 12 percentage points below normal for this time of year (Figure 5b) While many reservoirs in the eastern part of the state remain more than 90% full, a dozen or so in the Dallas-Fort Worth area are under 90% full with a handful less than 80% full (Figure 5c). The reservoir marked in orange northeast of Dallas (between 50% and 60% full) is accurately but perhaps unfairly orange because it, Bois D’Arc Lake, is a newborn and just started its initial inundation this year (Figure 5c). Reservoirs in the Temple-Killeen area are below normal (usually 100% full!) for this time of year and still heading toward historic (since 1990) lows if the rains don’t come (Figure 5d).

Figure 5a: Parts of the state with below-25th-percentile seven-day average streamflow as of July 21, 2022 (map modified from U.S. Geological Survey).

Figure 5b: Statewide reservoir storage since 2020 compared to statistics (median, min, and max) for statewide storage from 1990 through 2021 (graph from Texas Water Development Board).

Figure 5c: Reservoir storage as of July 21, 2022, in the major reservoirs of the state (modified from Texas Water Development Board).

Figure 5d: Hydrograph of the Month—Reservoir storage for the Temple-Killeen Angelo area reservoir (Belton; graph from Texas Water Development Board).
Sea-surface temperatures in the Central Pacific that in part define the status of the El Niño Southern Oscillation continue to reside in La Niña conditions and have cooled deeper into those conditions (Figure 6a). This month’s projection is a bit cooler than last month’s, suggesting that La Niña conditions will remain through the fall and early winter (Figure 6a). Accordingly, we remain under a La Niña Advisory. Projections of sea-surface temperatures suggest a 60% chance of remaining in La Niña conditions through July–September and 62%–66% chance through fall and early winter (Figure 6b).

Figure 6a. Forecasts of sea-surface temperature anomalies for the Niño 3.4 Region as of June 20, 2022 (modified from Climate Prediction Center and others). “Range of model predictions -1” is the range of the various statistical and dynamical models’ projections minus the most outlying upper and lower projections. Sometimes those predictive models get a little craycray!

Figure 6b. Probabilistic forecasts of El Niño, La Niña, and La Nada (neutral) conditions (graph from the Climate Prediction Center and International Research Institute).
The U.S. Seasonal Drought Outlook through October 2022 shows the drought remaining or developing with only the El Paso area escaping drought conditions (Figure 7a). The three-month temperature outlook projects warmer-than-normal conditions for the entire state (Figure 7b), while the three-month precipitation outlook favors drier-than-normal conditions for the western half of the state (Figure 7c).

Figure 7a: The U.S. Seasonal Drought Outlook for July 21, 2022, through October 31, 2022 (source).

Figure 7b: Three-month temperature outlook for August-September-October 2022 (source).

Figure 7c: Three-month precipitation outlook for August-September-October 2022 (source).