SUMMARY:
- 97.2% of the state is abnormally dry or worse (slightly better than last month) with 26% in Exceptional drought (worse than last month)
- July was the warmest July in Texas since 1895, beating 2011’s July by 0.3 degrees Fahrenheit
- There’s an 80% chance of remaining in La Niña conditions through December and a 60% chance of neutral conditions arriving in the spring.
I wrote this article on August 19th, 2022.
One of the biggest challenges of writing this column (setting aside, for a moment, the shenanigans of the editor and a style guide that bucks the proper use of the Oxford comma) is the delay between preparation and publication. There’s usually about a week between assembly and distribution, and a lot can happen during a week. Unfortunately, that appears to be the case with this report because the weather experts are projecting quite a bit of rainfall between now (as I write) and then (when you read). But that is also fortunate because…we need the rain! The weathery feds are projecting 5 to 7 inches of cloud juice across Northeast Texas into the Hill Country (Figure 1a). Wow! I hope this happens without flooding.
Part of the reason for the rains is the tropical wave in the Gulf of Mexico, which begs the question: What happened to the hurricane season this year? Everyone was expecting an active season (there’s still time…), but as we approach the traditional peak of the season, we’ve yet to have a hurricane (the Washington Post reported that, as of my writing, the Atlantic hasn’t had a hurricane in 317 days). We’ve had three named storms with two sputtering out soon after formation. Apparently, there’s been some wind shear that has prevented the formation of tropical systems, but there’s an expectation that the potential will rise in the coming weeks. In addition, the European heat wave has injected hot, dry air into the Atlantic, helping to inhibit storm formation. And Saharan dust is also inhibiting formation. Regardless, there’s a 60% chance of the tropical wave in the Gulf turning into a tropical storm this weekend (we’ll know by the time you read this).
July 2022 clocked in as the warmest July (average temperature) on record in Texas since 1895 (Figure 1b). For year-to-date hotness, 2022 is currently ranked 8th (tied with 1933, 1954, and 1999) with 2012 as the hottest on record (Figure 1c).

Figure 1a: Seven-day total rainfall forecast as of August 18, 2022 (with soil temperature at 50 centimeters on the boxes) (graph modified from Texas Water Development Board).

Figure 1b: Average temperatures for July since 1895 (graph from NOAA).

Figure 1c: Heywood plot for Texas showing statewide average year-to-date temperatures for the period of record (source).
Over the past 30 days, much of the state saw less than 2 inches of rain, but large, disparate parts of the state (Panhandle, Lower Rio Grande Valley, Far West Texas, Southeast Texas) saw more than 4 inches with spots in the Valley getting more than 10 inches (Figure 2a). Much of the state received less than normal amounts of rainfall besides the aforementioned areas above (Figure 2b). Rain over the past 90 days — a big driver for drought conditions — remains below normal for almost the entire state except for parts of Far West Texas and the Lower Rio Grande Valley (Figure 2c). Overall, though, the 90-day map looks better than last month.

Figure 2a: Inches of precipitation that fell in Texas in the 30 days before August 19, 2022 (modified from source). Note that cooler colors indicate lower values and warmer indicate higher values. Light grey is no detectable precipitation.

Figure 2b: Rainfall as a percent of normal for the 30 days before August 19, 2022 (modified from source).

Figure 2c: Rainfall as a percent of normal for the 90 days before August 19, 2022 (modified from source).
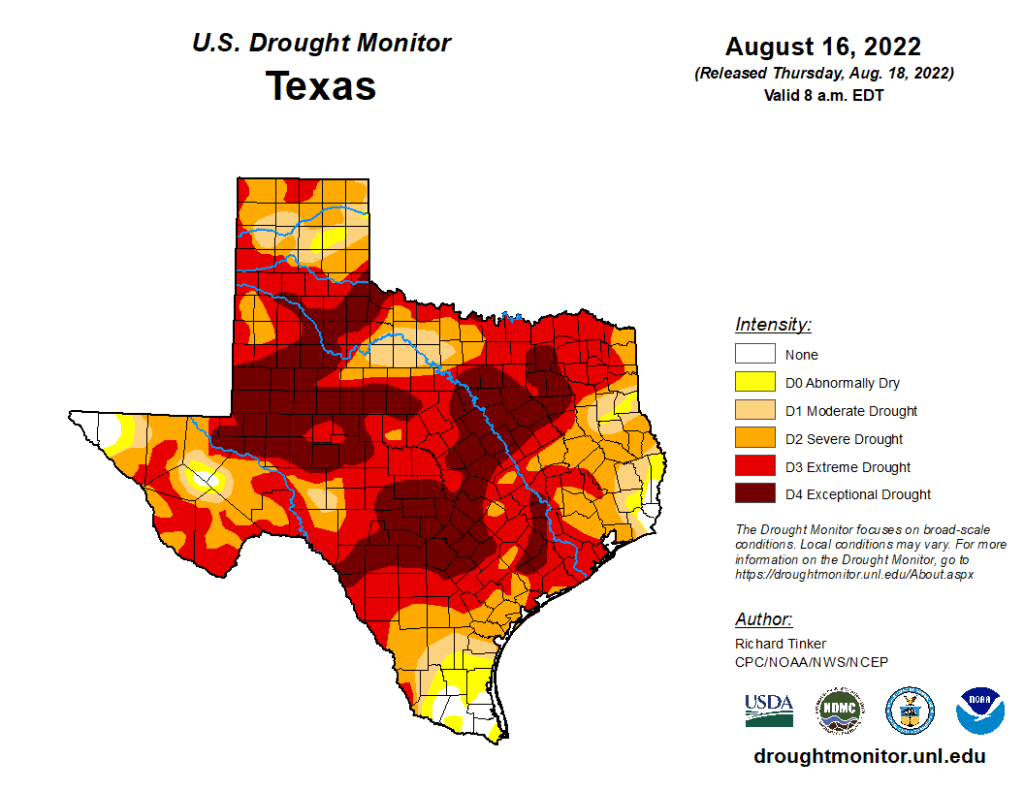
The amount of the state under drought conditions (D1–D4) decreased slightly from 94.8% four weeks ago to 93.4% today (Figure 3a) with drought conditions improving in Far West Texas, the Lower Rio Grande Valley, the Panhandle, and the northern part of West Texas (Figure 3b). Extreme drought or worse has increased to about 62% of the state, with exceptional drought increasing to cover 26% of the state (Figure 3a). In all, 97.2% of the state remains abnormally dry or worse (D0–D4; Figure 3a), down slightly from 99.2% four weeks ago.

Figure 3a: Drought conditions in Texas according to the U.S. Drought Monitor (as of August 16, 2022; source).

Figure 3b: Changes in the U.S. Drought Monitor for Texas between July 19, 2022, and August 16, 2022 (source).
The North American Drought Monitor, which runs a month behind, continues to show drought over much of the western United States (Figure 4a) and looks worse than last month with drought extending into Arkansas and all of Oklahoma. Precipitation over much of the Rio Grande watershed in Colorado and New Mexico over the last 90 days was higher than normal except for the Sacramento Mountains (Figure 4b).
Conservation storage in Elephant Butte Reservoir — an important source of water for the El Paso area — decreased from 5.3% full last month to 3.8% today (Figure 4c), just below historic (since 1990) lows.
The Rio Conchos Basin in Mexico, which confluences into the Rio Grande just above Presidio and is the largest tributary to the Rio Grande, continues to experience severe to exceptional drought (Figure 4a). Combined conservation storage in the Amistad and Falcon reservoirs decreased from 24.2% last month to 22.7% full today, about 30 percentage points below normal for this time of year (Figure 4d). There’s a slight but abrupt uptick in storage due the system that passed through the area earlier.

Figure 4a: The North American Drought Monitor for August 19, 2022 (source).

Figure 4b: Percent of normal precipitation for Colorado and New Mexico for the 90 days before August 19, 2022 (modified from source). The red line is the Rio Grande Basin. I use this map to see check precipitation trends in the headwaters of the Rio Grande in southern Colorado, the main source of water to Elephant Butte Reservoir downstream.

Figure 4c: Reservoir storage in Elephant Butte Reservoir since 2020 with the median, min, and max for measurements from 1990 through 2021 (graph from Texas Water Development Board).

Figure 4d: Reservoir storage in Amistad and Falcon reservoirs since 2020 with the median, min, and max for measurements from 1990 through 2021 (graph from Texas Water Development Board).
Basins across the state have flows over the past week below historical 25th, 10th, and 5th flow percentiles (Figure 5a). Statewide reservoir storage is at 68.7% full as of today, down 1.2 million acre-feet from 72.4% a month ago, now about 13 percentage points below normal for this time of year (Figure 5b). Statewide reservoir levels have been tracking the declines we saw in 2011, albeit with a few percentage points fuller (Figure 5b). While many reservoirs in the eastern part of the state remain more than 90% full, a dozen or so in the Dallas-Fort Worth area are under 90% full with a handful less than 80% full (Figure 5c). The reservoir marked in orange northeast of Dallas (between 50% and 60% full) is accurately but perhaps unfairly orange because it, Bois D’Arc Lake, is a newborn and just started its initial inundation this year (Figure 5c). Reservoirs in the Waco area are below normal by 30 percentage points for this time of year and have been below historic (since 1990) lows for the past two months (Figure 5d).

Figure 5a: Parts of the state with below-25th-percentile seven-day average streamflow as of August 19, 2022 (map modified from U.S. Geological Survey).

Figure 5b: Statewide reservoir storage since 2020 compared to statistics (median, min, and max) for statewide storage from 1990 through 2021 (graph from Texas Water Development Board).

Figure 5c: Reservoir storage as of August 19, 2022, in the major reservoirs of the state (modified from Texas Water Development Board).

Figure 5d: Hydrograph of the Month—Reservoir storage for the Waco area reservoir (Waco) (graph from Texas Water Development Board).
Sea-surface temperatures in the Central Pacific that in part define the status of the El Niño Southern Oscillation continue to reside in La Niña conditions but have warmed slightly (Figure 6a). This month’s projection is a bit cooler than last month’s, suggesting that La Niña conditions will remain through the fall and early winter (Figure 6a). Accordingly, we remain under a La Niña Advisory. Projections of sea-surface temperatures suggest an 80% chance of remaining in La Niña conditions through the end of the year with a 60% chance of neutral conditions reigning in the February-March-April season (Figure 6b).

Figure 6a. Forecasts of sea-surface temperature anomalies for the Niño 3.4 Region as of July 19, 2022 (modified from Climate Prediction Center and others). “Range of model predictions -1” is the range of the various statistical and dynamical models’ projections minus the most outlying upper and lower projections. Sometimes those predictive models get a little craycray!

Figure 6b. Probabilistic forecasts of El Niño, La Niña, and La Nada (neutral) conditions (graph from the Climate Prediction Center and International Research Institute).
The U.S. Seasonal Drought Outlook through October 2022 shows drought removal or improvement for the entire state (Figure 7a). The three-month temperature outlook projects warmer-than-normal conditions for the entire state (Figure 7b), while the three-month precipitation outlook favors drier-than-normal conditions away from the coast (Figure 7c).

Figure 7a: The U.S. Seasonal Drought Outlook for August 18, 2022, through November 30, 2022 (source).

Figure 7b: Three-month temperature outlook for September-October-November 2022 (source).

Figure 7c: Three-month precipitation outlook for September-October-November 2022 (source).