SUMMARY:
- Except for parts of West Texas and the Lower Rio Grande Valley, the rain spigot slammed shut
- 75% chance of La Niña conditions remaining through November-February
- NOAA’s Winter Outlook projects warmer and drier than normal conditions for Texas (but a persimmon in Johnson City projects snow)
I wrote this article on October 23, 2022.
With a few cool spells under our belt, it seems like the right time to talk about winter. NOAA’s Climate Prediction Center recently released its 2022-2023 Winter Outlook, and it will look discomfortingly familiar to us in Texas: warmer and drier than normal for the Lone Star State and much of the Southern United States (Figure 1a, b). Accordingly, drought conditions are expected to remain and expand across much of the state except for Far West Texas, where if you dump your Big Gulp out the window of your truck, you’ve exceeded average local rainfall (Figure 1c).
The Old Farmer’s Almanac, which claims 80% accuracy, projects drier than normal conditions but, in opposition to NOAA, cooler than normal temperatures. The Farmer’s Almanac (What? There’s more than one?) projects cooler than normal temperatures and normal precipitation for Texas. My wife’s meemaw, Ma Gladys, used persimmon seeds sliced lengthwise to predict winter conditions. If a seed shows a spoon, it means a lot of snow, a knife means an extremely cold winter, and a fork means a mild winter. KXAN and the Ladybird Johnson Wildflower Center sliced open some persimmon seeds and did not find any utensils inside, suggesting, perhaps, there won’t be a winter due to The Apocalypse. However, Lobirdybee out of Johnson City posted a persimmon splitting on TikTok and got a spoon, so… maybe a repeat of Winter Storm Uri? As a scientist, I lean more toward NOAA than persimmon seeds, but we shall see.

Figure 1a: Temperature outlook for Winter 2022-2023 (graph from NOAA).

Figure 1b: Precipitation outlook for Winter 2022-2023 (graph from NOAA).

Figure 1c: Drought outlook for Winter 2022-2023 (graph from NOAA).
Over the past 30 days, parts of West Texas and the Lower Rio Grande Valley saw more than 2 to 3 inches of rain, with most of the rest of the state seeing less than 1.5 inches (Figure 2a). Scattered areas in West Texas and the Lower Rio Grande Valley saw more than 5 inches of rain (Figure 2a). More than half the state received less than half the normal rain over the past month, with parts of West Texas, the Lower Rio Grande Valley, and the El Paso area receiving 1.5 to more than three times normal rainfall (Figure 2b). Rain over the past 90 days—a big driver for drought conditions—remains below normal for almost the entire state except for the southwestern parts along the Rio Grande (Figure 2c).

Figure 2a: Inches of precipitation that fell in Texas in the 30 days before October 23, 2022 (modified from source). Note that cooler colors indicate lower values and warmer indicate higher values. Light grey is no detectable precipitation.

Figure 2b: Rainfall as a percent of normal for the 30 days before October 23, 2022 (modified from source).

Figure 2c: Rainfall as a percent of normal for the 90 days before October 23, 2022 (modified from source).
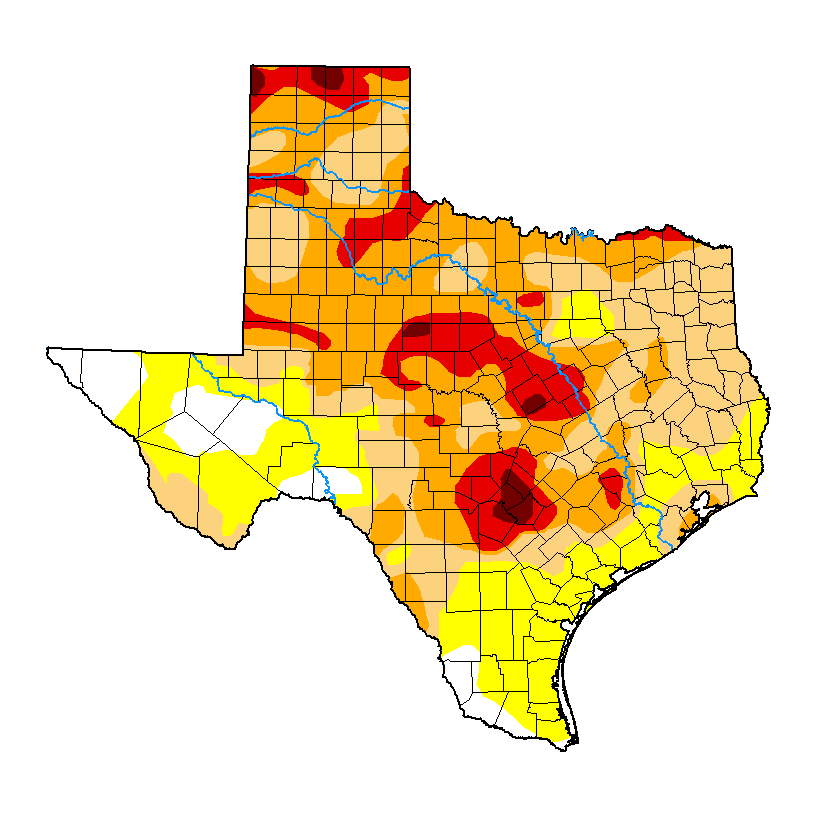
The amount of the state under drought conditions (D1–D4) increased from 60% four weeks ago to 72% today (Figure 3a), with drought conditions increasing across much of the state (Figure 3b). Extreme drought or worse has increased from 8% of the state to 13%, with exceptional drought increasing slightly to 1.4% (Figure 3a). In all, 93% of the state remains abnormally dry or worse (D0–D4; Figure 3a), up slightly from 79% four weeks ago.

Figure 3a: Drought conditions in Texas according to the U.S. Drought Monitor (as of October 18, 2022; source).

Figure 3b: Changes in the U.S. Drought Monitor for Texas between September 20, 2022, and October 18, 2022 (source).
The North American Drought Monitor, which runs a month behind, continues to show drought over much of the western United States (Figure 4a). Precipitation over much of the Rio Grande watershed in Colorado and New Mexico over the last 90 days was higher than normal, except for the Sacramento Mountains (Figure 4b).
Conservation storage in Elephant Butte Reservoir — an important source of water for the El Paso area — remained the same at 5.3% full as last month (Figure 4c), slightly above historic (since 1990) lows.
The Rio Conchos Basin in Mexico, which confluences with the Rio Grande just above Presidio and is the largest tributary to the Lower Rio Grande, is now out of drought (Figure 4a). Combined conservation storage in the Amistad and Falcon reservoirs increased from 22.7% last month to 31.2% full today, about 22 percentage points below normal for this time of year (Figure 4d). Reservoir levels are up as a result of storm systems that have passed through the area.

Figure 4a: The North American Drought Monitor for September 30, 2022 (source).

Figure 4b: Percent of normal precipitation for Colorado and New Mexico for the 90 days before October 23, 2022 (modified from source). The red line is the Rio Grande Basin. I use this map to see check precipitation trends in the headwaters of the Rio Grande in southern Colorado, the main source of water to Elephant Butte Reservoir downstream.

Figure 4c: Reservoir storage in Elephant Butte Reservoir since 2020 with the median, min, and max for measurements from 1990 through 2021 (graph from Texas Water Development Board).

Figure 4d: Reservoir storage in Amistad and Falcon reservoirs since 2020 with the median, min, and max for measurements from 1990 through 2021 (graph from Texas Water Development Board).
Basins across the state continue to have flows over the past week below historical 25th, 10th, and 5th flow percentiles (Figure 5a). Statewide reservoir storage is at 67.4% full as of today, down about 890,000 acre-feet from 70.2% a month ago and now about 13 percentage points below normal for this time of year (Figure 5b). Many reservoirs in the eastern part of the state remain less than 90% full, with many reservoirs less than 80% full and some even less than 70% full (Figure 5c).
The reservoir marked in orange northeast of Dallas (between 50 and 60% full) is accurately but perhaps unfairly orange because it, Bois D’Arc Lake, is a newborn and just started its initial inundation earlier this year (Figure 5c). The recent rains did not benefit reservoirs in the Waco area, which remain below normal by 30 percentage points for this time of year and have been below historic (since 1990) lows for the past three months (Figure 5d). Waco is expected to go into Stage 3 drought restrictions when the lake level hits 449 feet (source)—it’s currently at 450.9 feet (source).

Figure 5a: Parts of the state with below-25th-percentile seven-day average streamflow as of October 22, 2022 (map modified from U.S. Geological Survey).

Figure 5b: Statewide reservoir storage since 2020 compared to statistics (median, min, and max) for statewide storage from 1990 through 2021 (graph from Texas Water Development Board).

Figure 5c: Reservoir storage as of October 23, 2022, in the major reservoirs of the state (modified from Texas Water Development Board).

Figure 5d: Hydrograph Of The Month—Reservoir storage for the Waco area reservoir (Waco; graph from Texas Water Development Board).
Sea-surface temperatures in the Central Pacific that in part define the status of the El Niño Southern Oscillation continue to reside in La Niña conditions and have cooled deeper into those conditions (Figure 6a). This month’s projection is slightly cooler than last month’s, suggesting that La Niña conditions will remain through the winter (Figure 6a). Accordingly, we remain under a La Niña Advisory. Projections of sea-surface temperatures suggest a 75% chance of remaining in La Niña conditions for November-February, with a 54% chance of neutral conditions reigning in February-April (Figure 6b).

Figure 6a. Forecasts of sea-surface temperature anomalies for the Niño 3.4 Region as of September 19, 2022 (modified from Climate Prediction Center and others). “Range of model predictions -1” is the range of the various statistical and dynamical models’ projections minus the most outlying upper and lower projections. Sometimes those predictive models get a little craycray.

Figure 6b. Probabilistic forecasts of El Niño, La Niña, and La Nada (neutral) conditions (graph from Climate Prediction Center and others).
The U.S. Seasonal Drought Outlook through December 2022 shows drought remaining in much of the state, returning in areas that received recent relief, and Far West Texas staying out of drought (Figure 7a). In a bit of good news, drought seems to be breaking up to the west of us; however, in a bit of bad news, drought continues to our north and has expanded to our east (Figure 7a). In my experience, these super-regional droughts have more persistence than regional and subregional droughts. Like a broken record, the three-month temperature outlook projects warmer-than-normal conditions for the entire state (Figure 7b), while the three-month precipitation outlook favors drier-than-normal conditions for the entire state (Figure 7c).

Figure 7a: The U.S. Seasonal Drought Outlook for September 15, 2022, through December 31, 2022 (source).

Figure 7b: Three-month temperature outlook for November-December-January 2022-2023 (source).

Figure 7c: Three-month precipitation outlook for November-December-January 2022-2023 (source).