With 38 public universities and 35 private colleges and universities in the state and many more across the country (and the world) interested in Texas, there’s a great deal of academic scholarship focused on water in the Lone Star State. In this column, I provide brief summaries to several recent academic publications on water in Texas.

Let’s start thinking about water!
Surface deformation analysis of the Houston Area using time series interferometry and emerging hot spot analysis
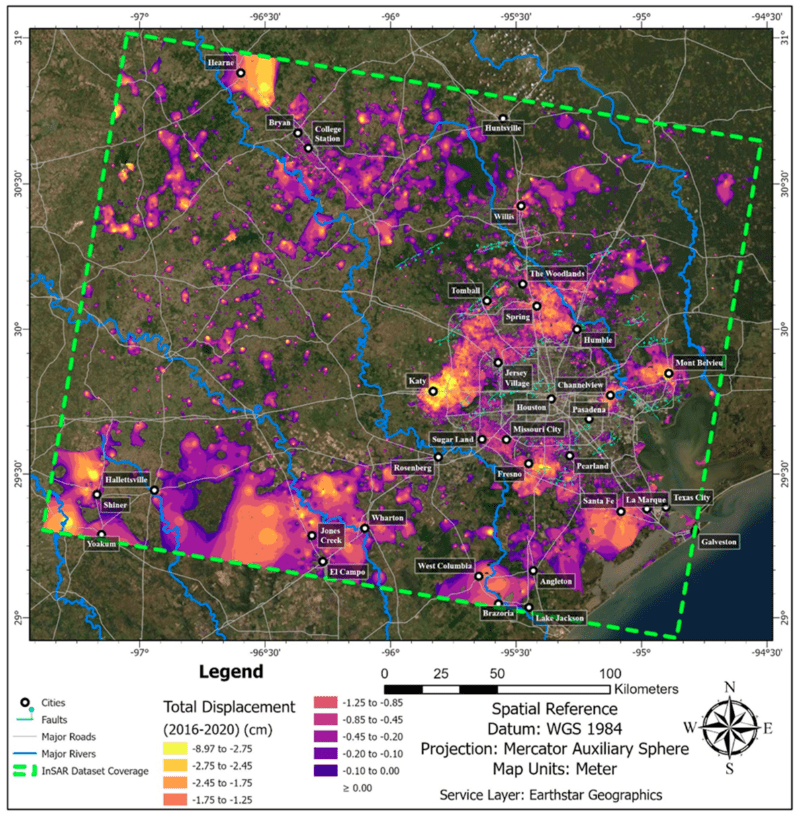
If you have a sinking feeling in the greater Houston area, it might be because parts have subsided upwards of 10 feet over the past 50 or so years. With the creation of the subsidence districts, the heavy pumping that led to this subsidence has been mitigated through the transition to surface-water supplies. However, since groundwater is often the gateway drug to development, the subsidence districts manage groundwater pumping at the leading edges of the megacity, allowing groundwater use in those areas before requiring conversion to surface water. This paper seeks to track recent subsidence rates using interferometry in the greater Houston area and, somewhat loosely, assess the causes. Interferometry uses satellites to measure changes in land-surface elevation. This can be done across a region and in great detail (I’ve seen it used to assess land subsidence in California around a single agricultural well).
The most interesting thing about the paper, in my humble opinion, is the donut of subsidence around Central Houston and the fact that groundwater pumping is causing substantial rates of subsidence outside the subsidence districts. Groundwater districts can regulate groundwater pumping that causes subsidence but are not obligated to as the subsidence districts are. Since surface water costs so much more than groundwater, locals are unlikely to take kindly to changing sources if they are not required to (for example, see Montgomery County). In short, the Houston megapolis has outgrown its subsidence district britches and now has a healthy muffin top of pumping and growing subsidence around it. The muffin toppers need to realize that while the rule of capture protects a pumper from being sued for damages due to water-level declines, that same pumper is liable for the damages caused by land subsidence due to their pumping. Stay tuned for some interesting court cases and legislation.
The Katy area appears as a hot spot with 1.2 to 3.5 inches of subsidence between 2016 and 2020. The higher end of that range means 1 foot of land subsidence over less than 15 years. And growth in the Katy area is just getting going. The Conroe-Woodlands area is also showing evidence of land subsidence, as are many other areas. The authors note that if pumping trends continue, faults in Katy and The Woodlands will likely become reactivated or increase in activity over time (note that these are not exciting Los Angeles shake-n-bake type faults—these are weezy little faults that slowly slide toward the Gulf cracking roads, pipes, and your house in two). Another surprise from the paper, and not mentioned, is the hot spot of subsidence north of Bryan-College Station. Is the Carrizo-Wilcox more susceptible to land subsidence than we thought?
There are some issues with some details in the paper: the author gives USGS partial credit for creating the Harris-Galveston Coastal Subsidence District (nope), they refer to multiple subsidence districts created outside of the Harris-Galveston district (there’s only one other), they refer to changes in the water table causing subsidence (it’s almost all changes in hydraulic head in the confined zones of the aquifers), and they refer to the Lone Star Groundwater Conservation District as a user of surface water (they only use surface water in their building). I also find the analysis of oil-and-gas influences a bit weak. However, the map of subsidence is alone worth the price of admission. It’s worth a look.
Citation
Khan, S.D., Gadea, O.C.A., Tello Alvarado, A., and Tirmizi, O.A., 2022, Surface deformation analysis of the Houston Area using time series interferometry and emerging hot spot analysis: Remote Sensing, 14, 3831. https://doi.org/10.3390/rs14153831
Hidden reservoirs—Addressing water loss in Texas

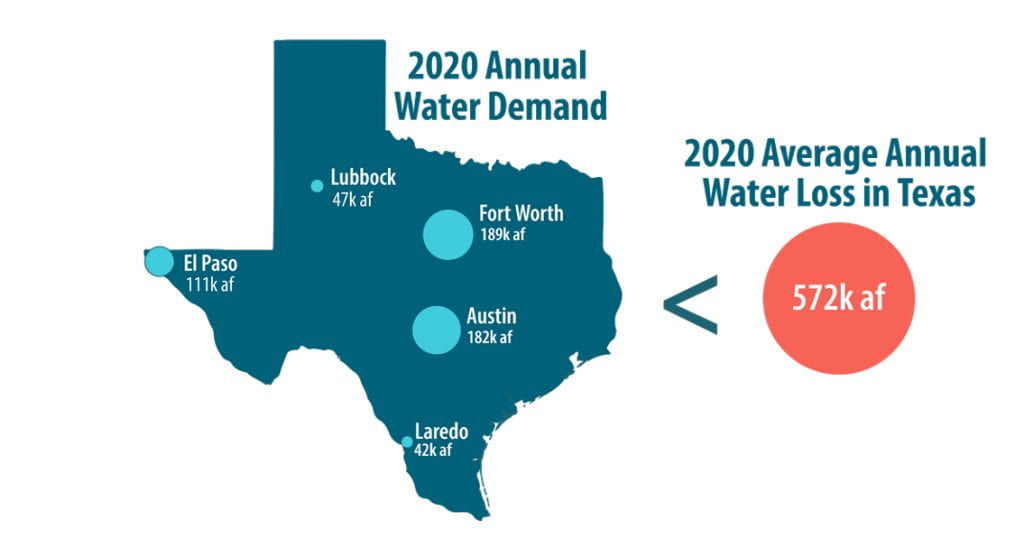
Annual water loss compared to annual water demand in 2020, which shows Texas is losing 572,000 acre-feet per year. Source: Texas Living Waters Project
Although not an academic paper, this report, funded by the Meadows Foundation and the Cynthia and George Mitchell Foundation, provides a good review of where Texas is at with water loss. Water loss refers to the amount of water lost through the distribution system that carries water from the treatment plant to the meter in front of your house or some other user (there are other losses thereafter [and before]). Walker and others used data from the 2022 State Water Plan and 2019 water loss audits to assess where Texas is with respect to water loss.
In all, Texas has 165,000 miles of distribution pipes, enough pipe, as the authors note, to run back and forth between Houston and El Paso 220 times (that’s a lot of times!). And those pipes, as well as water not properly tabulated or billed, amount to at least 570,000 acre-feet of water lost per year (that’s a lot of water!). I used to interact with this data when I worked at the Texas Water Development Board, but even I was shocked that an average of 51 gallons per day of water is lost per connection in Texas. I hadn’t seen the data presented in that manner before.
My household with my wife, me, and our eight cats, has used about 35 gallons per day per person, which means water losses could be 73% of our daily household use (note that the report does not include per connection data on a city-by-city basis, so I’m rolling with the statewide average here). The authors found that achieving the same water loss as the 75th percentile of utilities would save 249,000 acre-feet per year. It’s important to note that there will surely always be some loss in distribution systems because costs rise sharply to get the number down. But, as the report notes, there’s a lot of room for improvement.
Citation
Walker, J., Wyatt, A., Seefeldt, J., Goshen, D., Bock, M., Johnston, I., and Black, M., 2022, Hidden reservoirs—Addressing water loss in Texas: Texas Living Waters Project and the Texas Coast and Water Program of the National Wildlife Federation, 88 p.
Ecohydrological connectivity: A unifying framework for understanding how woody plant encroachment alters the water cycle in drylands

Aerial imagery showing changes over time in the study site for Case Study 3 (South Texas Shrublands) (A) 1930; (B) 1955; and (C) 1995. Note that woody vegetation is increasing with time and expanding from the drainage ways to the upland portions of the landscape. Source: ResearchGate
I consider Brad Wilcox of Texas A&M University the guru on the impacts of vegetation on the Texas landscape. I first met him a long time ago when the benefits of brush management were front and center in water-resource policy discussions at the Texas capital. Wilcox has spent his career assessing plant-water interactions and, in this paper, provides something of a summary of the effects of woody plant encroachment (thicketization) in Texas, Oklahoma, and New Mexico. The paper summarizes six case studies across the state, including the Cross Timbers (Oklahoma), Post Oak Savannah (Texas), South Texas Shrublands (Texas), the Edwards Plateau (Texas), the Rolling Plains (Texas), and the desert (New Mexico). They found that woody plant encroachment onto grasslands and savannahs resulted in “profound ecohydrological changes at both the patch and landscape scales.”
In the wetter environments, they found that an increase in woody plants increased evapotranspiration, resulting in a decrease in streamflows and groundwater recharge. Woody plant encroachment in drier regions did not alter evapotranspiration. In semiarid regions, overall soil infiltrability was increased, but whether or not flows in streams increased or decreased depended on local soils and geology. In the driest areas, woody plant encroachment created bare areas that increased runoff, which in turn increased recharge through losing streams.
Citation
Wilcox, B.P., Basant, S., Olariu, H., and Leite, P.A.M., 2022, Ecohydrological Connectivity—A unifying framework for understanding how woody plant encroachment alters the water cycle in drylands: Frontiers in Environmental Science, 10:934535. doi: 10.3389/fenvs.2022.934535
Join Our Mailing List
Subscribe to Texas+Water and stay updated on the spectrum of Texas water issues including science, policy, and law.