SUMMARY:
- The Climate Prediction Center has issued an El Niño Watch with a 62% chance of conditions forming during May-June-July with an 80% chance in late summer.
- The amount of the state under drought conditions remained the same from four weeks ago at 58%, with drought intensity decreasing in the southern third of the coastal plains.
- Warmer than normal temperatures are expected over the next three months, with normal rainfall except for the High Plains and Far West Texas where drier than normal conditions are expected.
I wrote this article on April 21, 2023.
Is it too early to talk about tropical weather? Not for Colorado State University. Based on past seasons, sea surface temperatures in the Atlantic, sea levels, vertical wind shears, and an expected El Niño, Colorado State projects this year’s Atlantic hurricane season will be slightly below average with 13 named storms and six hurricanes, two of which might be major. An average season sports 14.4 named storms and 7.2 hurricanes, 3.2 of which are major. Because El Niños are associated with increased vertical wind shear in the Atlantic, they tend to inhibit the formation of tropical systems. Prognosticators and tea leaders projected a more active-than-normal season last year, but the year ended with less-than-normal activity.
The National Oceanic Atmospheric Association releases its hurricane predictions in late May. The official hurricane season runs June 1 through November 30, although tropical storms may develop before and after those dates.
Here’s a list of names for this year:
- Arlene
- Bret
- Cindy
- Don
- Emily
- Franklin
- Gert
- Harold
- Idalia
- Jose
- Katia
- Lee
- Margot
- Nigel
- Ophelia
- Philippe
- Rina
- Sean
- Tammy
- Vince
- Whitney
Yay, Gert!
Regardless of projected tropical activity, if you are hit with a tropical storm, it can have major impacts. The following sites can help you prepare:
- General Land Office
- Texas Hurricane Center (Office of the Governor)
- Texas Department of Transportation
- Texas Ready (Texas Department of State Health Services)
Also, check for local resources for local specifics on preparation and evacuation. And remember that storms these days tend to intensify quickly as they approach the shore.
Atlantic Seasonal Hurricane Activity Forecast for 2023 Hurricane Activity
|
Forecast Parameters |
CSU Forecast for 2023 |
Average for 1991-2020 |
| Named Storm | 13 | 14.4 |
| Named Storm Days | 55 | 69.4 |
| Hurricanes | 6 | 7.2 |
| Hurricane Days | 25 | 27.0 |
| Major Hurricanes | 2 | 3.2 |
| Major Hurricane Days | 5 | 7.4 |
| Accumulated Cyclone Energy* | 100 | 123 |
*A measure of a named storm’s potential for wind and storm surge destruction defined as the sum of the square of a named storm’s maximum wind speed (in 10* knots?) for each 6-hour period of its existence.
Table 1: Forecast for 2023 Hurricane Activity (from CSU Tropical Weather & Climate Research).
Over the past 30 days, much of eastern and central coastal Texas saw more than 4 inches of rain, while much of the rest saw less than an inch (Figure 2a). Outside of the coastal plains, most of the state saw less than normal rainfall over the past 30 days (Figure 2b). Rain over the past 90 days—a big driver for drought conditions—remains below normal for almost the entire western two-thirds of the state, with large areas in West and Far West Texas receiving less than 50% of normal (Figure 2c).

Figure 2a: Inches of precipitation that fell in Texas in the 30 days before April 21, 2023 (modified from the National Weather Service). Note that cooler colors indicate lower values and warmer indicate higher values. Light grey is no detectable precipitation.

Figure 2b: Rainfall as a percent of normal for the 30 days before April 21, 2023 (modified from the National Weather Service).

Figure 2c: Rainfall as a percent of normal for the 90 days before April 21, 2023 (modified from the National Weather Service).
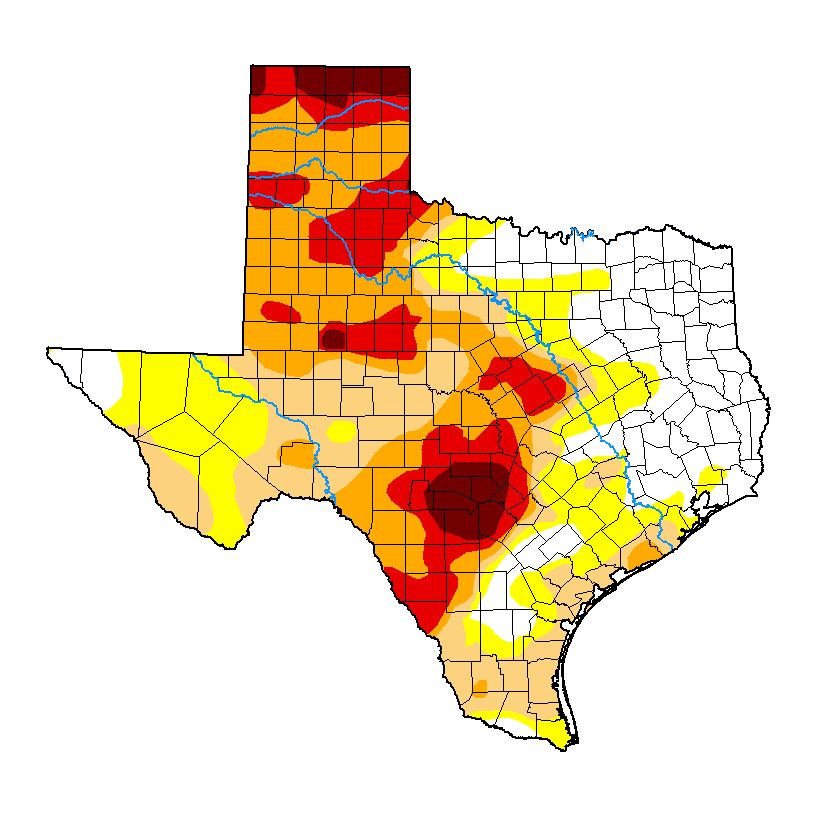
The amount of the state under drought conditions (D1–D4) remained the same from four weeks ago at 58% (Figure 3a), with drought intensity decreasing in the southern third of the coastal plains (Figure 3b). Extreme drought or worse has increased from 14% of the state four weeks ago to 18%, with exceptional drought increasing from 3.2% to 4.1% (Figure 3a). In all, 78% of the state remains abnormally dry or worse (D0–D4; Figure 3a), the same as four weeks ago.

Figure 3a: Drought conditions in Texas as of April 18, 2023 (from U.S. Drought Monitor).

Figure 3b: Changes in the U.S. Drought Monitor for Texas between March 21, 2023, and April 18, 2023 (from U.S. Drought Monitor).
The North American Drought Monitor, which runs a month behind, shows drought over large parts of the western United States and Mexico, with intense drought running down the High Plains from Nebraska to Southern Texas (Figure 4a). Precipitation over much of the Rio Grande watershed in Colorado and New Mexico over the last 90 days was lower than normal. Still, small areas had normal to above-normal precipitation (Figure 4b).
Conservation storage in Elephant Butte Reservoir—an important source of water for the El Paso area—increased to 19.1% full from 15.9% four weeks ago (Figure 4c), about five percentage points above historic (since 1990) lows (but also about five percentage points below the median storage since 1990).
The Rio Conchos basin in Mexico, which confluences with the Rio Grande just above Presidio and is the largest tributary to the Lower Rio Grande, remains abnormally dry (Figure 4a). Combined conservation storage in the Amistad and Falcon reservoirs decreased slightly to 27.6% full from 27.8% four weeks ago, about 32 percentage points below normal for this time of year and below the lowest low for this time of year recorded since 1990 (Figure 4d).

Figure 4a: The North American Drought Monitor for March 31, 2022 (from North American Drought Monitor).

Figure 4b: Percent of normal precipitation for Colorado and New Mexico for the 90 days before April 21, 2023 (modified from the National Weather Service). The red line is the Rio Grande Basin. I use this map to see check precipitation trends in the headwaters of the Rio Grande in southern Colorado, the main source of water to Elephant Butte Reservoir downstream.

Figure 4c: Reservoir storage in Elephant Butte Reservoir since 2021 with the median, min, and max for measurements from 1990 through 2022 (graph from the Texas Water Development Board).

Figure 4d: Reservoir storage in Amistad and Falcon reservoirs since 2021 with the median, min, and max for measurements from 1990 through 2022 (graph from the Texas Water Development Board).
Over the past week, basins across the state continue to have flows over the past week below historical 25th, 10th, and 5th flow percentiles (Figure 5a). Statewide reservoir storage is at 75.2% full as of April 21, up about 63,000 acre-feet from 75.0% four weeks ago and about ten percentage points below normal for this time of year (Figure 5b). Several reservoirs in the eastern part of the state have recovered to more than 90% full, with just a few less than 90% full (Figure 5c). The reservoir marked in light blue northeast of Dallas (between 70 and 80% full) is accurately, but perhaps unfairly, that color since it, Bois D’Arc Lake, is a relative newborn and just started its initial inundation last year (Figure 5c).
The reservoir marked in orange in the Dallas-Fort Worth area is New Terrell City Lake and has dropped from full in early March to about 36% today (Figure 5c). I wasn’t able to discern the cause, but I suspect it’s for work on the reservoir and/or dam. Wright Patman Lake also showed a sudden “decline” from 100% to 86% full; however, this change in storage was due to the seasonal adjustment between the flood and conservation pools (Figure 5d).

Figure 5a: Parts of the state with below-25th-percentile seven-day average streamflow as of April 21, 2023 (modified from the U.S. Geological Survey).

Figure 5b: Statewide reservoir storage since 2021 compared to statistics (median, min, and max) for statewide storage from 1990 through 2022 (graph from the Texas Water Development Board).

Figure 5c: Reservoir storage as of April 21, 2023, in the major reservoirs of the state (modified from the Texas Water Development Board).

Figure 5d: Hydrograph of the Month—Reservoir storage for Wright Patman Lake (graph from the Texas Water Development Board).
Sea-surface temperatures in the Central Pacific that, in part, define the status of the El Niño Southern Oscillation, reside in neutral conditions (Figure 6a). This month’s expert (consolidated) projection diverges from the plume of models, suggesting neutral conditions through much of the rest of the year (Figure 6a). However, the official probabilities, a month newer than the model projections, give El Nino conditions a 62% chance during May-June-July with an 80% chance in late summer (Figure 6b). Accordingly, the Climate Prediction Center has issued an El Niño Watch (something you NEVER see at the bottom of your TV screen).

Figure 6a. Forecasts of sea-surface temperature anomalies for the Niño 3.4 Region as of March 20, 2023 (modified from the Climate Prediction Center and others). “Range of model predictions -1” is the range of the various statistical and dynamical models’ projections minus the most outlying upper and lower projections. Sometimes those predictive models get a little craycray.

Figure 6b. Probabilistic forecasts of El Niño, La Niña, and La Nada (neutral) conditions (graph from the Climate Prediction Center and others).
The U.S. Seasonal Drought Outlook through July 2023 shows drought persisting and developing over much of the western two-thirds of the state (Figure 7a). Like a broken record, the three-month temperature outlook projects warmer-than-normal conditions for the entire state (Figure 7b), while the three-month precipitation outlook favors normal conditions for most of the state except for the High Plains and Far West Texas where drier than normal conditions are expected (Figure 7c).

Figure 7a: The U.S. Seasonal Drought Outlook for April 20, 2023, through July 31, 2023 (from the National Weather Service).

Figure 7b: Three-month temperature outlook for May-June-July 2023 (from the National Weather Service).

Figure 7c: Three-month precipitation outlook for May-June-July 2023 (from the National Weather Service).