SUMMARY:
- The amount of the state under drought conditions increased considerably from 23% four weeks ago to 43% this week.
- Drought is expected to expand in Texas and the southwest.
- Higher-than-normal temperatures are expected to continue over the next three months.
I wrote this article on July 23, 2023.
Hot enough for ya?
NASA reported that June was the hottest June on record (since ~1850), and last week we saw global temperatures break all-time records multiple times. In my hometown, Austin, Camp Mabry reached temperatures of 105 or more for 10 days in a row, breaking a record set in 1923.
A few news articles suggested that the daily temps were the highest in more than 100,000 years, which had me scratching my head. Is that true? Not exactly, but kinda-maybe yes. Recent average long-term temps are the warmest in more than 100,000 years, and that’s been the case for a bit now. But we don’t have daily temps from that long ago to know for sure that last week had the highest daily temperatures for that period of time.
July numbers will be out after the end of the month, but it’s looking to be the hottest month of any month on record by leaps and bounds (Figure 1a), with sea-surface temps that are just bonkers (Figure 1b). Scientists projected a spike in temps due to the development of El Niño conditions, which releases heat stored in the ocean during La Niña events. But the baseline warming that’s been occurring provides an elevated stage for the El Niño heat release to do its thing.

Figure 1a: Daily global air temperatures since 1979 (from Climate Reanalyzer).

Figure 1b: Daily sea-surface temperatures since 1981 (from Climate Reanalyzer).
Over the past 30 days, parts of the Panhandle and northeast Texas saw more than 5 inches of rain, while most of the state saw less than an inch (Figure 2a). Over the past 30 days, most of the state saw less than average rainfall, with half the state seeing less than half of normal rainfall (Figure 2b). The state is split about 50-50 on getting more than normal rainfall over the past 90 days and getting less than half, with parts of Far West Texas at less than 25% of normal (Figure 2c).

Figure 2a: Inches of precipitation that fell in Texas in the 30 days before July 23, 2023 (modified from the National Weather Service). Note that cooler colors indicate lower values and warmer indicate higher values. Light grey is no detectable precipitation.

Figure 2b: Rainfall as a percent of normal for the 30 days before July 23, 2023 (modified from the National Weather Service).

Figure 2c: Rainfall as a percent of normal for the 90 days before July 23, 2023 (modified from the National Weather Service).
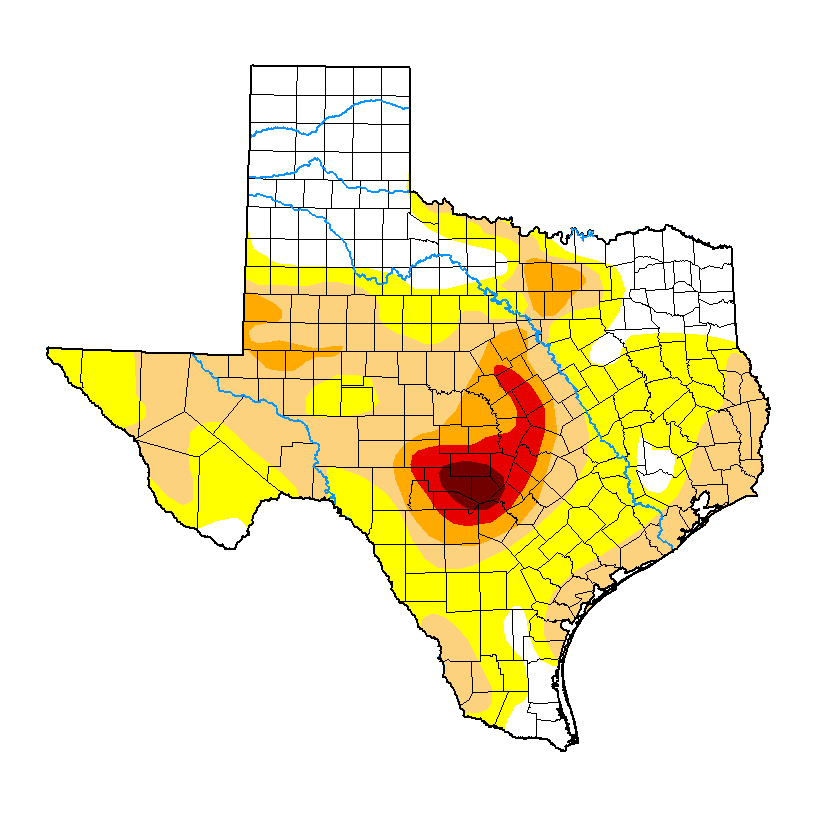
The amount of the state under drought conditions (D1–D4) increased considerably from four weeks ago at 23% to 43% this week (Figure 3a), with drought intensity decreasing in the Panhandle region but increasing in the central-to-coastal areas (Figure 3b). Extreme drought or worse increased from 1.4% of the state four weeks ago to 4.5%, with exceptional drought increasing from 0.3% to 1.1% (Figure 3a). In all, 75% of the state is abnormally dry or worse (D0–D4; Figure 3a), up a bit from 58% four weeks ago.

Figure 3a: Drought conditions in Texas as of July 18, 2023 (from the U.S. Drought Monitor).

Figure 3b: Changes in the U.S. Drought Monitor for Texas between June 20, 2023, and June 18, 2023 (from the U.S. Drought Monitor).
The North American Drought Monitor, which runs a month behind, shows drought focused over the Great Plains and much of central to southern Mexico (Figure 4a). Precipitation over much of the Rio Grande watershed in Colorado and New Mexico over the last 90 days was lower than normal, but there were small areas with normal to above-normal precipitation (Figure 4b).
Conservation storage in Elephant Butte Reservoir—an important source of water for the El Paso area—decreased to 25.3% full from 26.2% four weeks ago (Figure 4c), still a nudge above median storage since 1990.
The Rio Conchos basin in Mexico, which confluences with the Rio Grande just above Presidio and is the largest tributary to the Lower Rio Grande, is mostly out of drought (Figure 4a). Combined conservation storage in the Amistad and Falcon reservoirs decreased to 26.5% full from 30.5% four weeks ago, about 30 percentage points below normal for this time of year (Figure 4d).

Figure 4a: The North American Drought Monitor for June 30, 2023 (from the U.S. Drought Monitor).

Figure 4b: Percent of normal precipitation for Colorado and New Mexico for the 90 days before July 23, 2023 (modified from the National Weather Service). The red line is the Rio Grande Basin. I use this map to see check precipitation trends in the headwaters of the Rio Grande in southern Colorado, the main source of water to Elephant Butte Reservoir downstream.

Figure 4c: Reservoir storage in Elephant Butte Reservoir since 2021 with the median, min, and max for measurements from 1990 through 2022 (graph from Texas Water Development Board).

Figure 4d: Reservoir storage in Amistad and Falcon reservoirs since 2021 with the median, min, and max for measurements from 1990 through 2022 (graph from Texas Water Development Board).
Basins across the state continue to have flows over the past week below historical 25th, 10th, and 5th flow percentiles (Figure 5a). Statewide reservoir storage is at 74.1% full, down about 980,000 acre-feet from 77.2% four weeks ago and about 10 percentage points below normal for this time of year (Figure 5b). Most reservoirs in the eastern part of the state are more than 90% full, with just a few less than 90% full (Figure 5c). The reservoir marked in light blue northeast of Dallas (between 70 and 80% full) is accurately but perhaps unfairly that color since it, Bois D’Arc Lake, is a relative newborn and just started its initial inundation last year (Figure 5c).
The reservoir marked in red in the Dallas-Fort Worth area (the raspberry in a sea of blueberries) is New Terrell City Lake and has dropped from full in early March to about 25% today (Figure 5c). I couldn’t discern the cause, but I suspect it’s for work on the reservoir and/or dam. Another raspberry in the blueberries is B.S. Steinhagen Reservoir which the Corps of Engineers has drained to work on the reservoir’s powerhouse.
My (drumroll please) “Hydrograph of the Month” is Choke Canyon Reservoir due to its lowering levels during the drought (Figure 5d).

Figure 5a: Parts of the state with below-25th-percentile seven-day average streamflow as of July 22, 2023 (map modified from U.S. Geological Survey).

Figure 5b: Statewide reservoir storage since 2021 compared to statistics (median, min, and max) for statewide storage from 1990 through 2022 (graph from Texas Water Development Board).

Figure 5c: Reservoir storage as of July 23, 2023, in the major reservoirs of the state (modified from Texas Water Development Board).

Figure 5d: Hydrograph of the Month—Reservoir storage for Choke Canyon Reservoir (graph from Texas Water Development Board).
Sea-surface temperatures in the Central Pacific that, in part, define the status of the El Niño Southern Oscillation, reside in El Niño conditions (Figure 6a). The graph shows what appears to be a return to neutral conditions in the new year, but I think this is more of a reflection of expert uncertainty than anything (Figure 6a). However, the official probabilities, a month newer than the projections, give El Niño conditions more than a 90% chance of extending through the winter (Figure 6b).

Figure 6a. Forecasts of sea-surface temperature anomalies for the Niño 3.4 Region as of June 16, 2023 (modified from Climate Prediction Center and others). “Range of model predictions -1” is the range of the various statistical and dynamical models’ projections minus the most outlying upper and lower projections. Sometimes those predictive models get a little craycray.

Figure 6b. Probabilistic forecasts of El Niño, La Niña, and La Nada (neutral) conditions (graph from Climate Prediction Center and others).
The U.S. Seasonal Drought Outlook through August 2023 projects drought persistence, with development through the southwestern two-thirds of the state and into New Mexico and the Four Corners area (Figure 7a). This isn’t good news since an interstate drought suggests persistence.
Like death and taxes, the three-month temperature outlook projects warmer-than-normal conditions for the entire state (Figure 7b), while the three-month precipitation outlook favors wetter-than-normal conditions in north-east Texas (Figure 7c).

Figure 7a: The U.S. Seasonal Drought Outlook for July 20, 2023, through October 31, 2023 (from the National Weather Service).

Figure 7b: Three-month temperature outlook for August-September-October 2023 (from the National Weather Service).

Figure 7c: Three-month precipitation outlook for August-September-October 2023 (from the National Weather Service).