SUMMARY:
- The amount of the state under drought conditions increased considerably from 43% four weeks ago to 79% this week.
- Drought is expected to remain over the next three months.
- We need a LOT of rain to come out of the drought.
I wrote this article on August 25, 2023.
Many (myself included) are hoping for mellow-ish tropical waves to break the current drought in Texas. After a rather quiet summer, we entered high noon of the traditional tropical season with a train of five depressions with storm potential in the Atlantic choo-chooing west (and we still have five! Figure 1a). Tropical Storm Harold delivered some welcome relief to the southern part of the state. But we need more.
According to NOAA’s Drought Termination and Amelioration Tool (try saying that after three margaritas…), Texas needs 7 to 14 inches of rain in the western reaches of the state and anywhere from 14 to 28 inches of rain in the rest of the state to end the drought by New Year’s Day (Figure 1b). That’s a lot of rain. The probability of that happening is less than 6% for most of the state under normal conditions. Ouch. El Niño should help with a good chance of wetter-than-normal conditions for Texas in the fall through spring. We could also use a few more mellow-ish tropical waves.
Speaking of which, the prognosticators provided their final updates for the Atlantic hurricane season. Colorado State University still projects an active season with 14.4 named storms and 7.2 hurricanes. Due to record-high sea-surface temperatures, NOAA has upgraded its projections to an above-normal season with 14 to 21 named storms, 6 to 11 hurricanes, and 2 to 5 major hurricanes. Tropical Storm Risk projects 17 tropical storms, 8 hurricanes, and 3 intense hurricanes. The Weather Channel really wants Jim Cantori out in the field with a projection of 20 named storms, 10 hurricanes, and 5 at Cat3 or higher. So far, we’ve had 9 named storms and one hurricane (Don meowing in at Cat1).
I’m a bit fascinated by the prognosticators predicting more tropical systems during an El Niño year. In general, El Niños lead to fewer storms, not more (Figure 1c), with a 60% lower chance of getting a tropical storm strike during El Niños. Furthermore, modeling has shown (unless I’m missing a recent study that says otherwise?) that tropical systems are getting stronger rather than more frequent with a warming climate. Although, I think the effects on frequency are more unknown. The prognosticators are betting that the unprecedented ocean temperatures will counteract the effects of El Niño. We shall see, although an active hurricane season doesn’t necessarily mean that higher temps counteract El Niños, since not all El Niños result in fewer storms.

Figure 1a: The seven-day tropical outlook for the Atlantic as of August 25, 2023 (from NOAA).

Figure 1b: Precipitation needed to end drought conditions by the end of the year (from NOAA).

Figure 1c: Gulf of Mexico tropical cyclone history during different El Niño Southern Oscillation (ENSO) phases.
Outside of Tropical Storm Harold and his remnants, the past 30 days have been pretty dang dry. Much of Central to East Texas received no measurable rainfall (Figure 2a). Harald swathed through the lower Gulf Coast region, dropping five to eight inches from Corpus Christi toward Del Rio (Figure 2a). Over the past 30 days, most of the state saw less than 25% to 10% of normal rainfall, with the exception of those in Harald’s path (Figure 2b). Most of the state has gotten less than normal rainfall over the past 90 days (Figure 2c).

Figure 2a: Inches of precipitation that fell in Texas in the 30 days before August 25, 2023 (modified from NOAA). Note that cooler colors indicate lower values, and warmer indicate higher values. Light grey is no detectable precipitation.

Figure 2b: Rainfall as a percent of normal for the 30 days before August 25, 2023 (modified from NOAA).

Figure 2c: Rainfall as a percent of normal for the 90 days before August 25, 2023 (modified from NOAA).
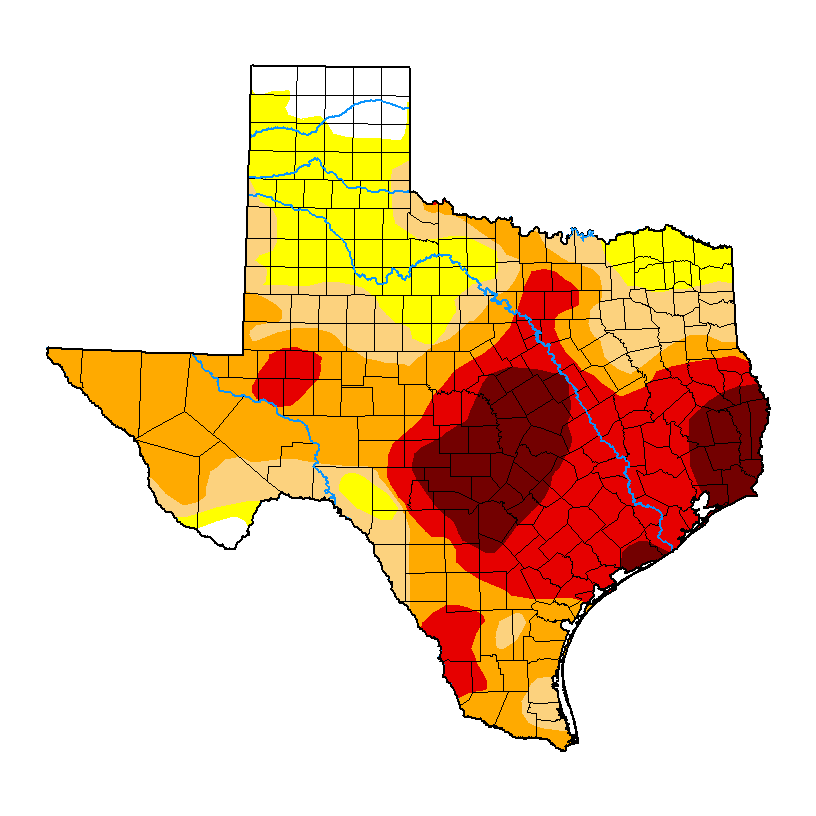
The amount of the state under drought conditions (D1–D4) increased considerably from four weeks ago at 43% to 79% this week (Figure 3a; the effects of Harald are not considered yet), with drought intensifying across the state (Figure 3b). Extreme drought or worse increased from 5% of the state four weeks ago to 34%, with exceptional drought increasing from 1.1% to 11.7% (Figure 3a). In all, 96% of the state is abnormally dry or worse (D0–D4; Figure 3a), up from 75% four weeks ago.

Figure 3a: Drought conditions in Texas as of August 22, 2023 (U.S. Drought Monitor).

Figure 3b: Changes in the U.S. Drought Monitor for Texas between July 25, 2023, and August 22, 2023 (U.S. Drought Monitor).
The North American Drought Monitor, which runs a month behind, shows drought over much of the American Mid-West and the Pacific Northwest, with the drought in Texas extending into Mexico (Figure 4a). Precipitation over much of the Rio Grande watershed in Colorado and New Mexico over the last 90 days was lower than normal, with small areas with normal to above normal precipitation (Figure 4b).
Conservation storage in Elephant Butte Reservoir—an important source of water for the El Paso area—decreased to 19.8% full from 25.3% four weeks ago (Figure 4c), a nudge above median storage since 1990.
The Rio Conchos basin in Mexico, which confluences with the Rio Grande just above Presidio and is the largest tributary to the Lower Rio Grande, is now back in drought (Figure 4a). Combined conservation storage in the Amistad and Falcon reservoirs decreased to 24.2% full from 26.5% four weeks ago, about 30 percentage points below normal for this time of year (Figure 4d).

Figure 4a: The North American Drought Monitor for July 31, 2023 (North American Drought Monitor).

Figure 4b: Percent of normal precipitation for Colorado and New Mexico for the 90 days before August 25, 2023 (modified from NOAA). The red line is the Rio Grande Basin. I use this map to check precipitation trends in the headwaters of the Rio Grande in southern Colorado, the main source of water to Elephant Butte Reservoir downstream.

Figure 4c: Reservoir storage in Elephant Butte Reservoir since 2021 with the median, min, and max for measurements from 1990 through 2022 (graph from Texas Water Development Board).

Figure 4d: Reservoir storage in Amistad and Falcon reservoirs since 2021 with the median, min, and max for measurements from 1990 through 2022 (graph from Texas Water Development Board).
Basins across the state continue to have flows over the past week below historical 25th, 10th, and 5th flow percentiles (Figure 5a). Statewide reservoir storage is at 69.6% full, down about 1.4 million acre-feet from 74.1% four weeks ago and about 10 percentage points below normal for this time of year (Figure 5b). Nearly half of the reservoirs in the eastern part of the state are more than 90% full, with the other half mostly between 80% and 90% full (Figure 5c). The “light blue” reservoir northeast of Dallas (between 70% and 80% full) is accurately but perhaps unfairly that color since it, Bois D’Arc Lake, is a relative newborn and just started its initial inundation last year (Figure 5c).
The reservoir marked in red in the Dallas-Fort Worth area (the raspberry in a sea of blueberries) is New Terrell City Lake and has dropped from full in early March to about 25% today (Figure 5c). I couldn’t discern the cause, but I suspect it’s for work on the reservoir and/or dam. Another raspberry in the blueberries is B.S. Steinhagen Reservoir, which the U.S. Army Corps of Engineers has drained to work on the reservoir’s powerhouse.
My (drumroll please) “Hydrograph of the Month” is Lake Travis due to its lowering levels during the drought (Figure 5d). Its current levels (39.2% full) are lower than during the drought of 2011 for this time of year.

Figure 5a: Parts of the state with below-25th-percentile seven-day average streamflow as of August 24, 2023 (map modified from U.S. Geological Survey).

Figure 5b: Statewide reservoir storage since 2021 compared to statistics (median, min, and max) for statewide storage from 1990 through 2022 (graph from Texas Water Development Board).

Figure 5c: Reservoir storage as of August 25, 2023, in the major reservoirs of the state (modified from Texas Water Development Board).

Figure 5d: Hydrograph of the Month—Reservoir storage for Lake Travis (graph from Texas Water Development Board).
Sea-surface temperatures in the Central Pacific that, in part, define the status of the El Niño Southern Oscillation reside in El Niño conditions (Figure 6a). The graph shows a return to neutral conditions in the new year, but I think this reflects expert uncertainty more than anything. The official probabilities, a month newer than the projections in the graph, give El Niño conditions more than a 95% chance of extending through the winter (Figure 6b).

Figure 6a. Forecasts of sea-surface temperature anomalies for the Niño 3.4 Region as of July 19, 2023 (modified from Climate Prediction Center and others). “Range of model predictions -1” is the range of the various statistical and dynamical models’ projections minus the most outlying upper and lower projections. Sometimes those predictive models get a little craycray.

Figure 6b. Probabilistic forecasts of El Niño, La Niña, and La Nada (neutral) conditions (graph from Climate Prediction Center and others).
The U.S. Seasonal Drought Outlook through November 2023 projects drought persistence, with drought development along the fringes (Figure 7a).
Like a bad haircut, the three-month temperature outlook projects warmer-than-normal conditions for the entire state (Figure 7b), while the three-month precipitation outlook favors normal conditions for most of the state (Figure 7c).

Figure 7a: The U.S. Seasonal Drought Outlook for August 17, 2023, through November 30, 2023 (NOAA).

Figure 7b: Three-month temperature outlook for September-October-November 2023 (NOAA).

Figure 7c: Three-month precipitation outlook for September-October-November 2023 (NOAA).