SUMMARY:
- The amount of the state under drought conditions (D1–D4) decreased from four weeks ago at 44% to 39% this week.
- Extreme-to-exceptional drought in Far West, Central, and Southeast Texas continues to blaze with drought and is expected to continue in Far West and Central Texas over the next three months.
- El Niño conditions are expected to persist through the March-April-May season.
I wrote this article on December 29, 2023.
I’ll save the annual review for next month’s column when we have the full dataset, but 2023 will be one for the books as the warmest year on record for Texas (Figure 1a) and the globe (Figure 1b).
There’s lots of chatter out there about El Niño being a bust this year, but we still have four to five months of the Niño left, and, despite a lack of improvements in Far West and Central Texas, the rest of the state has done well this fall and winter (and the first week of January looks promising for the Gulf Coast). Again, El Niño conditions do not guarantee ample, drought-ending rains, so thoughts, prayers, and rain dances are still appreciated.

Figure 1a: Twelve-month (December through November) average temperatures in Texas from 1895 to present (data from source).

Figure 1b: Twelve-month (December through November) average temperatures for the globe from 1895 to present (data from source).
Over the past month, we’ve had two or more inches fall over most of the northeastern third of the state, stretching from the Panhandle down to the Houston area, with some parts receiving more than four inches of rain (Figure 2a). However, much of Far West Texas received less than a quarter of an inch, with some areas (in light grey) getting nothing (Figure 2a). Most of the state received less than normal rainfall over the past 30 days, although large parts of the Panhandle benefitted from three-times-normal rainfall (Figure 2b). A greater part of the state, particularly the central part, received normal and more-than-normal rainfall over the past 90 days (Figure 2c).

Figure 2a: Inches of precipitation that fell in Texas in the 30 days before December 29, 2023 (modified from source). Note that cooler colors indicate lower values, and warmer indicate higher values. Light grey is no detectable precipitation.

Figure 2b: Rainfall as a percent of normal for the 30 days before December 29, 2023 (modified from source).

Figure 2c: Rainfall as a percent of normal for the 90 days before December 29, 2023 (modified from source).
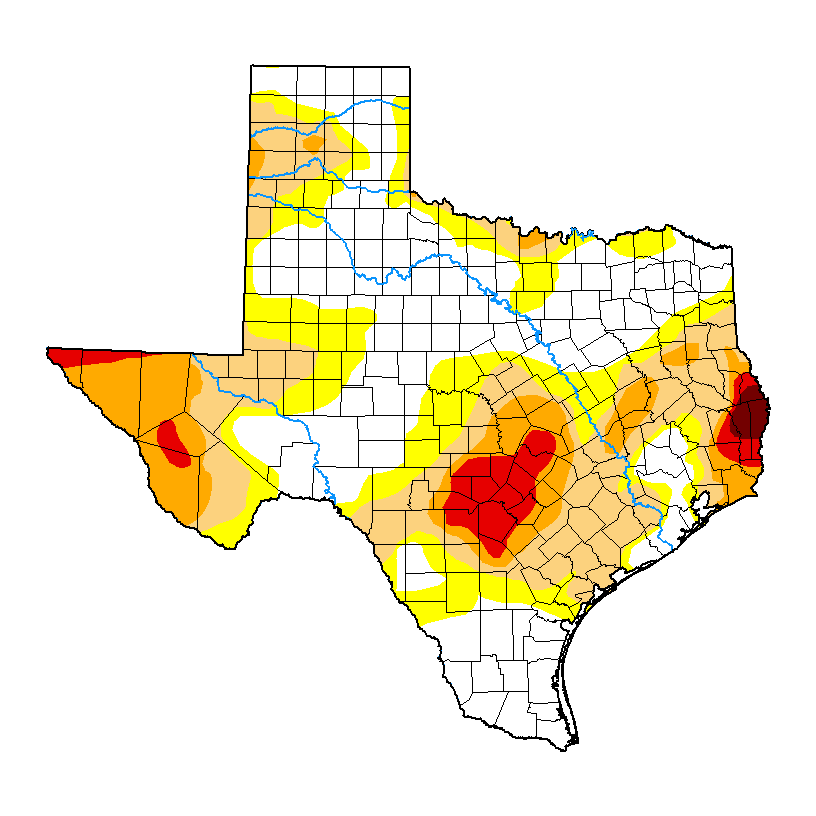
The amount of the state under drought conditions (D1–D4) decreased from four weeks ago at 44% to 39% this week (Figure 3a), with a mixed bag of drought ebbing and developing over the state (Figure 3b). Extreme drought or worse decreased from 6% of the state four weeks ago to 5.7%, with exceptional drought decreasing from 1.5% to 0.7% (Figure 3a). In all, 60% of the state is abnormally dry or worse (D0–D4; Figure 3a), down from 75% four weeks ago.

Figure 3a: Drought conditions in Texas according to the U.S. Drought Monitor (as of December 26, 2023; source).

Figure 3b: Changes in the U.S. Drought Monitor for Texas between November 28, 2023, and December 26, 2023 (source).
The North American Drought Monitor, which runs a month behind current conditions, shows drought in the American Mid-West, Pacific Northwest, the Southwest, and Gulf Coastal Area, with a raging drought in Louisiana and Mississippi (Figure 4a). Precipitation over much of the Rio Grande watershed in Colorado and New Mexico over the last 90 days was lower than normal, with small areas in southern Colorado experiencing normal to above normal precipitation (Figure 4b).
Conservation storage in Elephant Butte Reservoir—an important source of water for the El Paso area—increased to 23.3% full from 18.5% four weeks ago (Figure 4c), slightly above median storage since 1990.
The Rio Conchos basin in Mexico, which confluences with the Rio Grande just above Presidio and hosts the largest tributary to the Lower Rio Grande, remains in severe to extreme drought (Figure 4a). Combined conservation storage in the Amistad and Falcon reservoirs increased to 22.0% full from 21.4% four weeks ago, almost 40 percentage points below normal for this time of year (since 1990) and the lowest in the past 33 years (Figure 4d).

Figure 4a: The North American Drought Monitor for November 30, 2023 (source).

Figure 4b: Percent of normal precipitation for Colorado and New Mexico for the 90 days before December 29, 2023 (modified from source). The red line is the Rio Grande Basin. I use this map to check precipitation trends in the headwaters of the Rio Grande in southern Colorado, the main source of water to Elephant Butte Reservoir downstream.

Figure 4c: Reservoir storage in Elephant Butte Reservoir since 2021 with the median, min, and max for measurements from 1990 through 2022 (graph from Texas Water Development Board).

Figure 4d: Reservoir storage in Amistad and Falcon reservoirs since 2021 with the median, min, and max for measurements from 1990 through 2022 (graph from Texas Water Development Board).
Basins across the state continue to host flows over the past week below historical 25th, 10th, and 5th percentiles (Figure 5a). Statewide reservoir storage is at 68.9% full, up about 250 thousand acre-feet from 68.1% four weeks ago and about 12 percentage points below normal for this time of year since 1990 (Figure 5b). Reservoirs in the eastern part of the state range from 70% to more than 90% full (Figure 5c).
The reservoir marked in red in the Dallas-Fort Worth area (the raspberry in a sea of blueberries) is New Terrell City Lake, which dropped from full in early March (Figure 5c). I could not discern the cause, but I suspect it’s for work on the reservoir and/or dam.
My (drumroll please) “Hydrograph of the Month” is Lake Amistad due to its lowest levels since 1990 and flirting with the lowest levels since inundation back in the 1970s (Figure 5d).

Figure 5a: Parts of the state with below-25th-percentile seven-day average streamflow as of December 28, 2023 (map modified from U.S. Geological Survey).

Figure 5b: Statewide reservoir storage since 2021 compared to statistics (median, min, and max) for statewide storage from 1990 through 2022 (graph from Texas Water Development Board).

Figure 5c: Reservoir storage as of December 28, 2023, in the major reservoirs of the state (modified from Texas Water Development Board).

Figure 5d: Hydrograph of the Month—Reservoir storage for Lake Amistad (graph from Texas Water Development Board).
Sea-surface temperatures in the Central Pacific that, in part, define the status of the weather phenomenon known as the El Niño Southern Oscillation, strongly reside in El Niño conditions (Figure 6a). Projections suggest El Niño conditions will continue with a return to neutral conditions in the April-May-June season. This month’s projection is lower than last month’s, suggesting an earlier ending to El Niño. The official probabilities, a month newer than the projections in the graph, give El Niño conditions a 90% chance of extending through the February-March-April season, giving way to favoring neutral conditions in April-May-June (Figure 6b).

Figure 6a. Forecasts of sea-surface temperature anomalies for the Niño 3.4 Region as of November 20, 2023 (modified from Climate Prediction Center and others). “Range of model predictions -1” is the range of the various statistical and dynamical models’ projections minus the most outlying upper and lower projections. Sometimes those predictive models get a little craycray.

Figure 6b. Probabilistic forecasts of El Niño, La Niña, and La Nada (neutral) conditions (graph from Climate Prediction Center and others).
The U.S. Seasonal Drought Outlook through March projects drought persistence in Far West Texas, Central Texas, and along the Red River, with likely drought removal in Southeast Texas (Figure 7a).
The three-month temperature outlook projects near-normal temperatures for much of the state (Figure 7b), while the three-month precipitation outlook favors wetter-than-normal conditions for the eastern half of the state (Figure 7c).

Figure 7a: The U.S. Seasonal Drought Outlook for November 16, 2023, through January 29, 2023 (source).

Figure 7b: Three-month temperature outlook for January-February-March 2024 (source).

Figure 7c: Three-month precipitation outlook for January-February-March 2024 (source).