SUMMARY:
- The amount of the state under drought conditions (D1–D4) decreased from four weeks ago at 75% to 44% this week.
- El Niño conditions are expected to persist through the March-April-May season.
- By one measure, the odds of drought ending in the state by the end of May range from 8% to 32%.
I wrote this article on November 27, 2023.
We saw a large decrease in drought conditions across the state over the past month. Interestingly, the drought hotspot is now in southeast Texas as part of a severe drought extending across Louisiana and into Mississippi, where less than half of normal rainfall has fallen over the past three months.
Although we continue to be under El Niño conditions, which tend to be cooler and wetter than normal, we haven’t—so far—seen dramatic state-wide drought-busting rainfalls. However, the frog in the pot is de-boiling as we see improvements across the state.
The amount of rainfall to end the drought in the state over the next month ranges from 4.5 to 14 inches (Figure 1a), with the probability of that happening at less than 1.5% for the vast majority of the state (the Lower Rio Grande Valley area has a 4% chance). Over a more reasonable time frame, say in six months at the end of May, the amount of rainfall to end the drought ranges from 6 to 28 inches (Figure 1b) with the probability at 8% to 32% (Figure 1c).

Figure 1a: Precipitation needed to end the drought in one month (source).

Figure 1b: Precipitation needed to end the drought in six months (source).

Figure 1c: Probability of ending the drought in six months (source).
Over the past month, we’ve had some storms drop more than two inches of rain over much of East Texas and the coast, with four or more inches in the southern coastal area and a small part of northeast Texas (Figure 2a). However, large parts of Far West Texas and the Panhandle received less than 0.5 inches (Figure 2a). Except for the southern coastal area, part of the Big Bend area, and the western portion of the Edwards Plateau, most of the state received less than normal rainfall over the past 30 days (Figure 2b). A greater part of the state, particularly the central region, has received normal and more-than-normal rainfall over the past 90 days (Figure 2c).

Figure 2a: Inches of precipitation that fell in Texas in the 30 days before November 27, 2023 (modified from source). Note that cooler colors indicate lower values, and warmer indicate higher values. Light grey is no detectable precipitation.

Figure 2b: Rainfall as a percent of normal for the 30 days before November 27, 2023 (modified from source).

Figure 2c: Rainfall as a percent of normal for the 90 days before November 27, 2023 (modified from source).
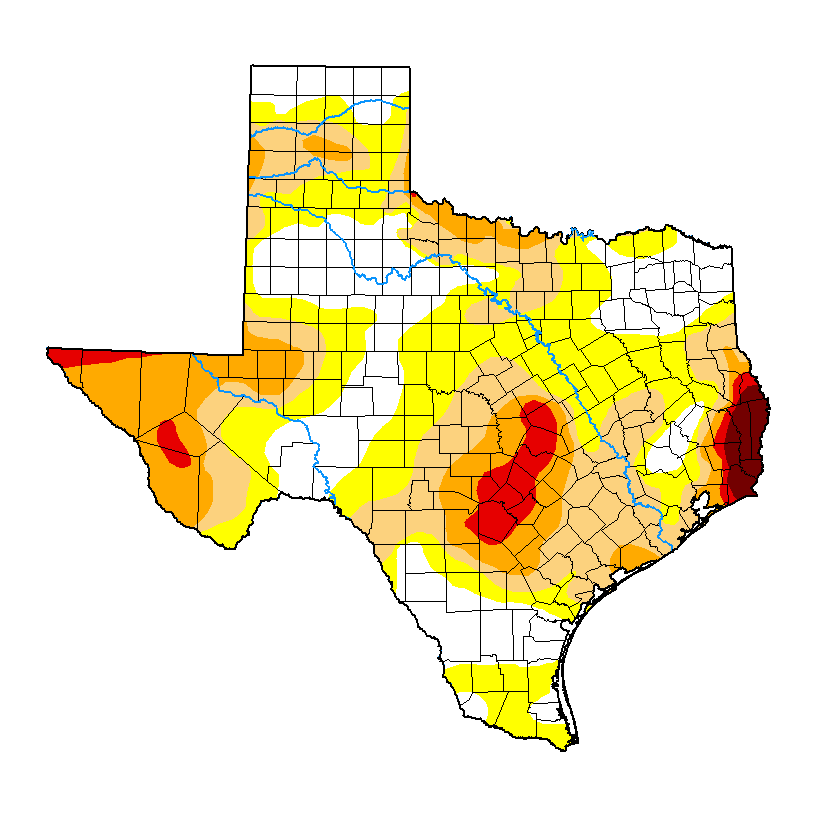
The amount of the state under drought conditions (D1–D4) decreased from four weeks ago at 75% to 44% this week (Figure 3a), with drought ebbing over the vast majority of the state (Figure 3b). Extreme drought or worse decreased from 25% of the state five weeks ago to 6%, with exceptional drought decreasing from 6.8% to 1.5% (Figure 3a). In all, 75% of the state is abnormally dry or worse (D0–D4; Figure 3a), down from 89% four weeks ago.

Figure 3a: Drought conditions in Texas according to the U.S. Drought Monitor (as of November 21, 2023; source).

Figure 3b: Changes in the U.S. Drought Monitor for Texas between October 24, 2023, and November 21, 2023 (source).
The North American Drought Monitor, which runs a month behind, shows drought in the American Mid-West, Pacific Northwest, the Southwest, and Gulf Coast, with a raging drought in Louisiana and Mississippi (Figure 4a). Precipitation over much of the Rio Grande watershed in Colorado and New Mexico over the last 90 days was lower than normal, with small areas in southern Colorado receiving normal to above-normal precipitation (Figure 4b).
Conservation storage in Elephant Butte Reservoir—an important source of water for the El Paso area—increased to 18.5% full from 16.9% four weeks ago (Figure 4c), right at median storage since 1990.
The Rio Conchos basin in Mexico, which confluences with the Rio Grande just above Presidio and is the largest tributary to the Lower Rio Grande, remains in severe to extreme drought (Figure 4a). Combined conservation storage in the Amistad and Falcon reservoirs increased to 21.4% full from 20.9% four weeks ago, almost 40 percentage points below normal for this time of year and the lowest in the past 33 years (Figure 4d).

Figure 4a: The North American Drought Monitor for October 31, 2023 (source).

Figure 4b: Percent of normal precipitation for Colorado and New Mexico for the 90 days before November 27, 2023 (modified from source). The red line is the Rio Grande Basin. I use this map to see check precipitation trends in the headwaters of the Rio Grande in southern Colorado, the main source of water to Elephant Butte Reservoir downstream.

Figure 4c: Reservoir storage in Elephant Butte Reservoir since 2021 with the median, min, and max for measurements from 1990 through 2022 (graph from Texas Water Development Board).

Figure 4d: Reservoir storage in Amistad and Falcon reservoirs since 2021 with the median, min, and max for measurements from 1990 through 2022 (graph from Texas Water Development Board).
Basins across the state continue to host flows over the past week below historical 25th, 10th, and 5th percentiles (Figure 5a). Statewide reservoir storage is at 68.1% full, up about 1 million acre-feet from 65.0% four weeks ago and about 12 percentage points below normal for this time of year (Figure 5b). Reservoirs in the eastern part of the state range from 70 to more than 90% full (Figure 5c).
New Terrell City Lake is the reservoir marked in red in the Dallas-Fort Worth area (the raspberry in a sea of blueberries). It has dropped from full in early March to about 18% today (Figure 5c). I couldn’t discern the cause, but I suspect it’s for work on the reservoir and/or dam.
My (drumroll please) “Hydrograph of the Month” is Choke Canyon Reservoir due to its low levels, which are flirting with the lowest levels since inundation back in the 1980s (Figure 5d). Its current level (25.1% full) is the lowest since 2018 and would need to fall below 23% to be the lowest since inundation.

Figure 5a: Parts of the state with below-25th-percentile seven-day average streamflow as of November 26, 2023 (map modified from U.S. Geological Survey).

Figure 5b: Statewide reservoir storage since 2021 compared to statistics (median, min, and max) for statewide storage from 1990 through 2022 (graph from Texas Water Development Board).

Figure 5c: Reservoir storage as of November 27, 2023, in the major reservoirs of the state (modified from Texas Water Development Board).

Figure 5d: Hydrograph of the Month—Reservoir storage for Choke Canyon Reservoir (graph from Texas Water Development Board).
Sea-surface temperatures in the Central Pacific that, in part, define the status of the El Niño Southern Oscillation reside in El Niño conditions (Figure 6a). The graph shows El Niño conditions continuing with a return to neutral conditions toward the middle of next year. This month’s projection is lower than last month’s. The official probabilities, a month newer than the projections in the graph, give El Niño conditions a 90% chance of extending through the March-April-May season, giving way to greater chances for neutral conditions in the May-June-July season (Figure 6b).

Figure 6a. Forecasts of sea-surface temperature anomalies for the Niño 3.4 Region as of October 19, 2023 (modified from Climate Prediction Center and others). “Range of model predictions -1” is the range of the various statistical and dynamical models’ projections minus the most outlying upper and lower projections. Sometimes those predictive models get a little craycray.

Figure 6b. Probabilistic forecasts of El Niño, La Niña, and La Nada (neutral) conditions (graph from Climate Prediction Center and others).
The U.S. Seasonal Drought Outlook through February 2024 projects drought persistence in Far West Texas and improvement in the rest of the state (Figure 7a).
The three-month temperature outlook projects near-normal temperatures for much of the state (Figure 7b), while the three-month precipitation outlook favors wetter-than-normal conditions for the eastern half of the state (Figure 7c).

Figure 7a: The U.S. Seasonal Drought Outlook for November 16, 2023, through January 29, 2023 (source).

Figure 7b: Three-month temperature outlook for December-January-February 2023-2024 (source).

Figure 7c: Three-month precipitation outlook for December-January-February 2023-2024 (source).